Monitoring dashboard
Monitoring dashboards in Database Autonomy Service (DAS) let you build a single view across multiple database instances. Select the instances and metrics you care about, then compare trends side by side — across engines, across instances, at the same point in time.
Prerequisites
Before you begin, make sure that:
-
Your database instance is one of the following types:
-
ApsaraDB RDS for MySQL, self-managed MySQL, or PolarDB for MySQL
-
Tair (Redis OSS-Compatible) or self-managed Redis
-
ApsaraDB for MongoDB or self-managed MongoDB
-
ApsaraDB RDS for PostgreSQL
-
ApsaraDB RDS for SQL Server
-
-
The instance is connected to DAS and in the Accessed state. To connect an instance, see:
Add a monitoring dashboard
-
Log on to the DAS console.
-
In the left-side navigation pane, click Monitoring Dashboard.
-
On the Custom Dashboard page, click the tab for your database engine.
-
Click Add Monitoring Dashboard.
-
In the Create Monitoring Dashboard dialog box, enter a Dashboard Name and click OK.
-
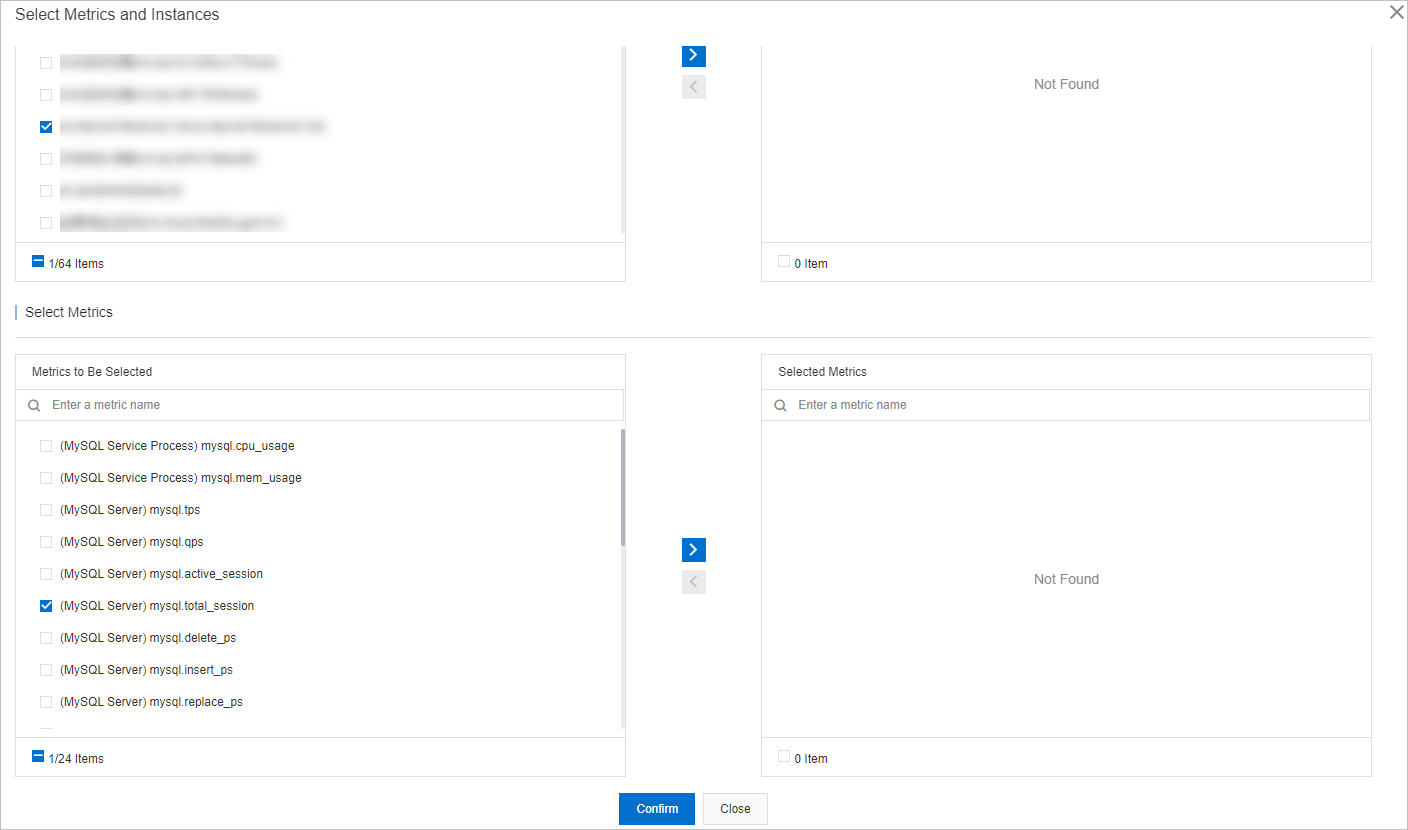
Click Select Instances and Metrics. In the Select Metrics and Instances dialog box, select the instances and metrics to monitor, then click
 .
.You can select up to 32 instances at a time. For metric descriptions, see Metrics.
-
Click Confirm.
To modify instances or metrics after creating the dashboard, click Add Instances and Metrics.
View metric trends
-
Log on to the DAS console.
-
In the left-side navigation pane, click Monitoring Dashboard.
-
On the Custom Dashboard page, click the tab for your database engine.
-
Select the monitoring dashboard, then set a time range. The end time must be later than the start time. The maximum time range is seven days.
For Tair (Redis OSS-Compatible) instances, the maximum time range is 3 hours.
Dashboard controls
| Control | Description |
|---|---|
| Filter by Instance | Select specific instances to compare their metrics side by side. |
| Auto Refresh (Every 5 Seconds) | Automatically refresh all metric trend charts every five seconds. |
| Linkage Chart | Enable multi-metric linkage to view the values of different metrics at the same point in time. |
| Chart Layout | Set the number of metric trend charts displayed per row. |
| Add Instances and Metrics | Add or change the instances and metrics in the dashboard. |
| Details (in a chart) | Zoom in on a specific chart to inspect a narrower time range. |
| Delete (in a chart) | Remove a metric from the dashboard. |
Click theicon next to a metric name in the dashboard to view its description.
Metrics
The following tables list the available metrics for each supported database engine.
ApsaraDB RDS for MySQL and self-managed MySQL
| Category | Metric | Description |
|---|---|---|
| MySQL Server | tps | Transactions per second (TPS). |
| qps | Queries per second (QPS). | |
| active_session | Number of active sessions. | |
| total_session | Total number of sessions. | |
| delete_ps | Average DELETE statements executed per second. | |
| insert_ps | Average INSERT statements executed per second. | |
| replace_ps | Average REPLACE statements executed per second. | |
| update_ps | Average UPDATE statements executed per second. | |
| select_ps | Average SELECT statements executed per second. | |
| bytes_received | Average bytes received from all clients per second. | |
| bytes_sent | Average bytes sent to all clients per second. | |
| iops_usage | IOPS usage. | |
| InnoDB storage engine | innodb_bp_hit | Read cache hit ratio of the InnoDB buffer pool. |
| innodb_bp_dirty_pct | Ratio of dirty pages in the InnoDB buffer pool. | |
| innodb_bp_usage_pct | Utilization of the InnoDB buffer pool. | |
| innodb_data_written | Average bytes written to InnoDB tables per second. | |
| innodb_data_read | Average bytes read from InnoDB tables per second. | |
| innodb_rows_deleted | Average rows deleted from InnoDB tables per second. | |
| innodb_rows_read | Average rows read from InnoDB tables per second. | |
| innodb_rows_inserted | Average rows inserted into InnoDB tables per second. | |
| innodb_rows_updated | Average rows updated in InnoDB tables per second. | |
| MySQL process | cpu_usage | CPU utilization of the MySQL process. The maximum value is 100% for Alibaba Cloud database instances. |
| mem_usage | Memory usage of the MySQL database within the operating system. | |
| iops | IOPS of the MySQL database. | |
| disk_usage | Disk usage. |
Tair (Redis OSS-Compatible) and self-managed Redis
| Category | Metric | Description |
|---|---|---|
| Database | instantaneous_ops_per_sec | Commands processed per second. |
| get_qps | Read requests per second. | |
| put_qps | Write requests per second. | |
| connection_usage | Connection usage. | |
| inflow | Data read from the database over the network per second. | |
| outflow | Data written to the database over the network per second. | |
| used_memory | Total bytes allocated by Redis using its allocator. | |
| mem_usage | Memory usage. | |
| Redis | avg_rt | Average response time of Redis. |
| max_rt | Maximum response time of Redis. | |
| proxy.avg_rt | Average response time of the Redis proxy node. | |
| proxy.max_rt | Maximum response time of the Redis proxy node. | |
| proxy.connection_usage | Connection usage of the Redis proxy. | |
| cpu_usage | CPU utilization of the Redis process. | |
| Keys | evicted_keys | Keys evicted due to the maximum memory limit. |
| total_keys | Total keys in the database. | |
| expired_keys | Total key expiration events. | |
| Redis Keys | hit | Number of hit keys. |
| miss | Number of missed keys. |
ApsaraDB for MongoDB and self-managed MongoDB
| Category | Metric | Description |
|---|---|---|
| MongoDB | opcounters.insert | INSERT operations per second. |
| opcounters.query | QUERY operations per second. | |
| opcounters.update | UPDATE operations per second. | |
| opcounters.delete | DELETE operations per second. | |
| opcounters.command | COMMAND operations per second. | |
| opcounters.getmore | GETMORE operations per second. | |
| connections.current | Number of active sessions. | |
| metrics.cursor.open.total | Number of open cursors. | |
| metrics.cursor.timedOut | Number of timed-out cursors. | |
| network.bytesIn | Bytes written to MongoDB per second. | |
| network.bytesOut | Bytes read from MongoDB per second. | |
| network.numRequests | Requests sent to MongoDB per second. | |
| MongoDB process | cpu_usage | CPU utilization of the MongoDB process. |
| mem_usage | Memory usage of the MongoDB process. | |
| disk_usage | Disk usage of the MongoDB process. |
ApsaraDB RDS for PostgreSQL
| Category | Metric | Description |
|---|---|---|
| Host | cpu_sys_ratio | CPU utilization of the PostgreSQL process in kernel state. |
| cpu_user_ratio | CPU utilization of the PostgreSQL process in user state. | |
| cpu_usage | CPU utilization of the PostgreSQL process. | |
| mem_usage | Memory usage of the PostgreSQL process. | |
| data.r_s | Read IOPS of the disk on which the data directory resides. | |
| data.iops | IOPS of the disk on which the data directory resides. | |
| data.w_s | Write IOPS of the disk on which the data directory resides. | |
| local_fs_size_total | Total disk space of the host. | |
| data.fs.used | Used space on the disk where the data directory resides. | |
| data.fs.usage | Space usage of the disk where the data directory resides. | |
| network_out_io | Outbound network traffic of the PostgreSQL process. | |
| network_io | Network traffic of the PostgreSQL process. | |
| network_in_io | Inbound network traffic of the PostgreSQL process. | |
| PostgreSQL basic monitoring | waiting_connection | Number of pending connections. |
| idle_in_transaction | Number of idle sessions. | |
| active_session | Number of active connections. | |
| total_session | Total number of current connections. | |
| tup_inserted | Records inserted per second. | |
| tup_deleted | Records deleted per second. | |
| tup_updated | Records updated per second. | |
| tup_returned | Records returned per second for full table scans. | |
| tup_fetched | Records returned per second for index scans. | |
| tps | TPS in PostgreSQL. | |
| xact_rollback | Transactions rolled back per second. | |
| xact_commit | Transactions committed per second. | |
| deadlocks | Deadlocks per second. | |
| oldest_snapshot | The earliest point in time before which dead tuples can be recycled by the instance. | |
| max_sent_delay | Replication lag from the secondary instance (data send delay). | |
| max_replay_delay | Replication lag on the secondary instance (transaction replay delay). | |
| long_query_5s | SQL statements running for 5 seconds or longer. | |
| long_query_3s | SQL statements running for 3 seconds or longer. | |
| long_query_1s | SQL statements running for 1 second or longer. | |
| long_idle_in_transaction_5s | Transactions idle for 5 seconds or longer. | |
| long_idle_in_transaction_3s | Transactions idle for 3 seconds or longer. | |
| long_idle_in_transaction_1s | Transactions idle for 1 second or longer. | |
| long_2pc_5s | Two-phase commit (2PC) transactions lasting 5 seconds or longer. | |
| long_2pc_3s | Two-phase commit (2PC) transactions lasting 3 seconds or longer. | |
| long_2pc_1s | Two-phase commit (2PC) transactions lasting 1 second or longer. |
ApsaraDB RDS for SQL Server
| Category | Metric | Description |
|---|---|---|
| SQL Server process | cpu_usage | CPU utilization of the ApsaraDB RDS for SQL Server instance within the operating system. |
| db_io | I/O requests per second. | |
| db_io_read | Read I/O requests per second. | |
| db_io_write | Write I/O requests per second. | |
| other_size | Disk space occupied by system files. | |
| log_size | Disk space occupied by log files. | |
| tmp_size | Disk space occupied by temporary files. | |
| ins_size | Total disk space occupied by the instance. | |
| data_size | Disk space occupied by data files. | |
| Database | qps | Average SQL statements executed per second. |
| connection_reset | Logon attempts from the connection pool per second. | |
| active_temp_tables | Number of active temporary tables. | |
| active_session | Number of active threads. | |
| active_cursors | Number of active cursors. | |
| sessions | Total number of connections. | |
| active_transactions | Number of active transactions. | |
| transactions | Average transactions per second. | |
| write_transactions | Average write transactions per second. | |
| read_kb | Average outbound traffic from the instance per second. | |
| write_kb | Average inbound traffic to the instance per second. | |
| Basic monitoring | cache_hit_ratio | Cache hit ratio. |
| bufferpool | Percentage of pages found in the high-speed cache out of all pages read from disk. | |
| fullscans | Average full table scans per second. | |
| autoparam_attempts_per_sec | Auto-parameterization attempts per second. | |
| forced_parameterizations_per_sec | Successful forced auto-parameterizations per second. | |
| sql_compilations | SQL compilations per second. | |
| unsafe_autoparams_per_sec | Unsafe auto-parameterization attempts per second. | |
| failed_autoparams_per_sec | Auto-parameterization failures per second. | |
| safe_autoparams_per_sec | Safe auto-parameterization attempts per second. | |
| resqlcompilations | SQL recompilations per second. | |
| lazy_writes | Dirty pages written to disk per second. | |
| checkpoint | Dirty pages written per second by checkpoint operations. | |
| logout | Logouts per second. | |
| logins | Logons per second. | |
| locktimeout | Lock requests that time out per second, including NOWAIT locks. | |
| deadlock | Lock requests resulting in a deadlock per second. | |
| lock_requests_per_sec | New locks and lock conversions per second. | |
| lockwaits | Lock requests that clients wait for per second. | |
| lock_waits | Statistics of processes waiting for locks. | |
| latchwaits | Latch requests not immediately granted per second. | |
| lock_wait_time_ms | Average wait time per lock request that results in a wait. | |
| average_latch_wait_time | Average wait time to acquire a latch. | |
| table_lock_escalations_per_sec | Lock escalations to the HoBT or table level per second. | |
| average_lock_wait_time | Average wait time for a requested lock. | |
| total_latch_wait_time | Total latch wait time in the last second. |
PolarDB for MySQL
| Category | Metric | Description |
|---|---|---|
| Database | com_delete | Average DELETE statements executed per second. |
| com_insert | Average INSERT statements executed per second. | |
| com_replace | Average REPLACE statements executed per second. | |
| com_select | Average SELECT statements executed per second. | |
| com_update | Average UPDATE statements executed per second. | |
| qps | QPS of the PolarDB for MySQL cluster. | |
| tps | TPS of the PolarDB for MySQL cluster. | |
| PolarDB process | cpu_usage | CPU utilization of the PolarDB process. A value of 200% means two CPU cores are in use. |
| mem_usage | Memory usage of the PolarDB for MySQL cluster within the operating system. | |
| PolarDB Server | active_session | Number of active sessions. |
| total_session | Total number of sessions. | |
| output_traffic | Average bytes sent to all clients per second. | |
| input_traffic | Average bytes received from all clients per second. | |
| InnoDB storage engine | innodb_data_read | Average bytes read from InnoDB tables per second. |
| innodb_data_written | Average bytes written to InnoDB tables per second. | |
| innodb_buffer_dirty_ratio | Ratio of dirty pages in the InnoDB buffer pool. | |
| innodb_buffer_read_hit | Read cache hit ratio of the InnoDB buffer pool. | |
| innodb_buffer_use_ratio | Utilization of the InnoDB buffer pool. | |
| innodb_rows_deleted | Average rows deleted from InnoDB tables per second. | |
| innodb_rows_inserted | Average rows inserted into InnoDB tables per second. | |
| innodb_rows_read | Average rows read from InnoDB tables per second. | |
| innodb_rows_updated | Average rows updated in InnoDB tables per second. |