Database Autonomy Service (DAS) provides SQL Explorer and Audit for security auditing and performance diagnostics on your databases.
Prerequisites
The database engine is PolarDB for PostgreSQL.
SQL Explorer and Audit has been gradually rolled out for PolarDB for PostgreSQL since February 24, 2023.
Features
-
SQL audit log
Records all operations on your databases. You can use these logs for fault analysis, behavior analysis, and security auditing.
-
Enhanced search
Lets you perform multi-dimensional searches by database, user, client IP, thread ID, execution duration, and number of scanned rows. You can also export and download the results.
-
SQL analysis
Analyzes SQL logs over a specified time range using interactive visualizations to help you identify abnormal SQL and locate performance issues.
-
Related SQL identification
Analyzes monitoring metrics and related SQL metrics to identify SQL statements whose trends correlate with changes in monitoring metrics.
ImportantThe related SQL identification feature is currently available for PolarDB for PostgreSQL instances in the China region.
Billing
PolarDB for PostgreSQL instances do not currently support the DAS Enterprise Edition. The SQL Explorer and Audit feature is provided by the database engine's SQL Explorer function, and PolarDB for PostgreSQL bills the resulting fees.
-
Trial Version: Free to use. SQL audit logs are retained for one day, which limits queries to that 24-hour period. Advanced features such as data export are not supported, and data integrity is not guaranteed.
-
Enterprise Edition: For more information, see SQL Explorer billing rules (optional).
Enable SQL Explorer and Audit
Log on to the DAS console.
In the navigation pane on the left, click .
Find the target instance and click the instance ID to open the instance details page.
-
In the left-side navigation pane, click .
-
Click Official Edition, select a retention period for SQL audit logs, and then click Confirm.
You can also select the Trial Version. The Trial Version is free but retains SQL audit logs for only one day, limiting queries to that 24-hour period. It does not support advanced features such as data export, and data integrity is not guaranteed.
Modify SQL audit log storage duration
Log on to the DAS console.
In the navigation pane on the left, click .
Find the target instance and click the instance ID to open the instance details page.
-
In the left-side navigation pane, click .
-
Click Service Settings, modify the SQL audit log retention period, and then click OK.
Export SQL audit logs
Log on to the DAS console.
In the navigation pane on the left, click .
Find the target instance and click the instance ID to open the instance details page.
-
In the left-side navigation pane, click .
-
On the SQL Explorer and Audit page, click Search to go to the Search tab.
-
In the log list on the Search tab, click Export.
-
In the dialog box that appears, select the fields and time range for the export, and then click OK.
-
After the export is complete, download the file from the View Exported Logs and save it to a secure location.
Disable SQL Explorer and Audit
Disabling SQL Explorer and Audit does not affect your services, but it clears all existing SQL audit logs. Before you disable this feature, be sure to export and save any necessary logs. If you re-enable the feature, logging resumes from that point forward.
Log on to the DAS console.
In the navigation pane on the left, click .
Find the target instance and click the instance ID to open the instance details page.
-
In the left-side navigation pane, click SQL Explorer and Audit.
-
Export the SQL audit logs. For more information, see Export SQL audit logs.
-
Click Service Settings. When the Service Settings page opens, deselect all selected features and then click Submit.
NoteAbout one hour after you disable SQL Explorer and Audit, the system releases the storage space used by the SQL Explorer and Audit data.
View audit log size and consumption
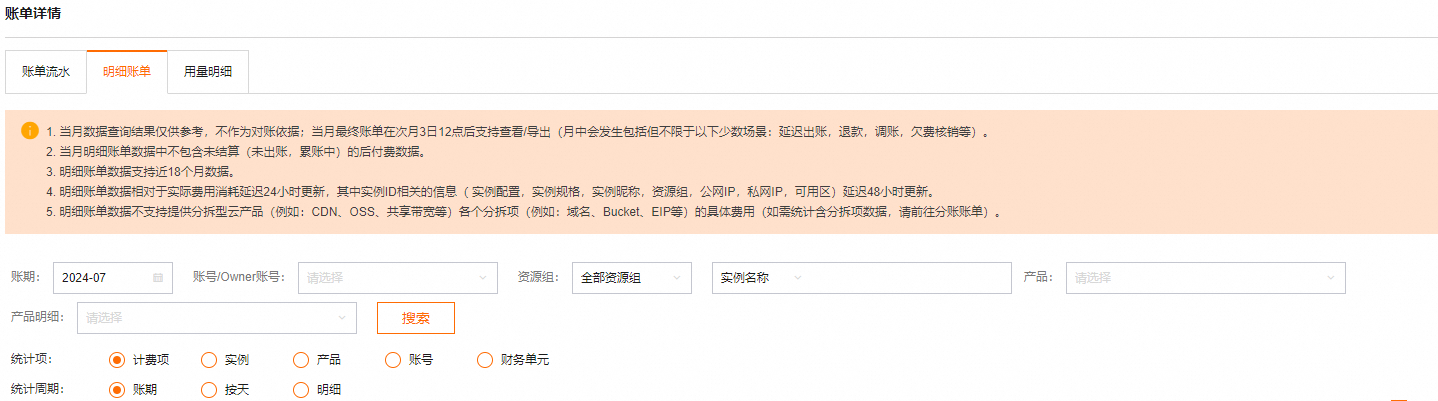
Log on to the Alibaba Cloud Console. In the upper-right corner of the page, choose Expenses.
In the left-side Expenses and Costs navigation pane, choose . View the cost details where the Billable Item column is sql_explorer.
On the Bill Details page, search by Instance ID. View the cost details where the Billable Item column is sql_explorer.