Use a DataV template to build a Double 11 Shopping Festival visualization application.
Background information
-
This example uses a Static Data Source, so you can paste prepared data directly in the widget data configuration area. For CSV File, Database, or other source types, add a data source first.
-
For an API data source, enter the API address in the data configuration bar. To enable Server Proxy Request, follow Configure cross-domain data.
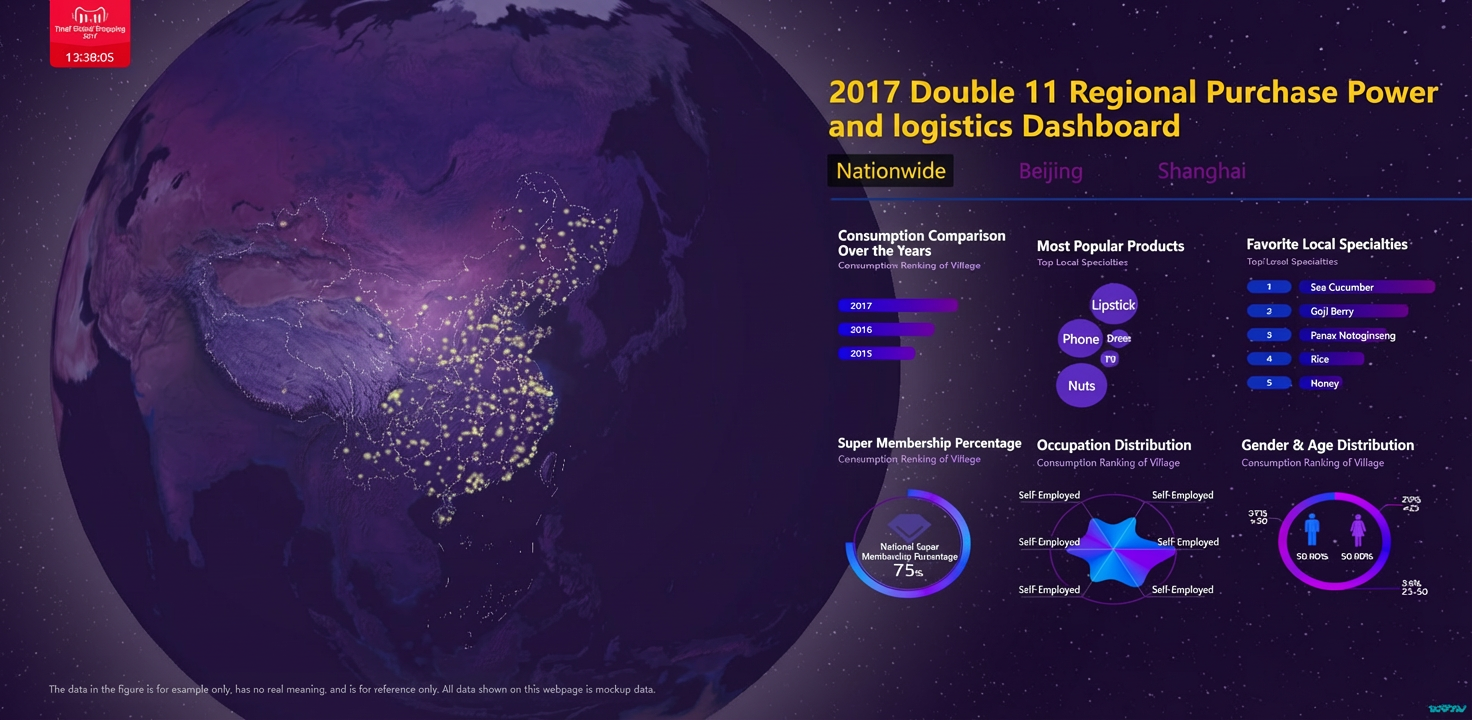
Expected result
Workflow
Complete the following steps to build a visualization application from a template.
Step 1: Create a visualization application
-
Log on to the DataV console.
-
On the Projects page, click PC Creation and select a template. This example uses 2017 Double 11 Shopping Festival. Click Create Project.
-
In the Create Project dialog box, enter the application name and select a project group. If no group exists, select Ungrouped.
-
Click Create.
After creation, the canvas editor opens with a pre-designed template for enterprise new retail business data.
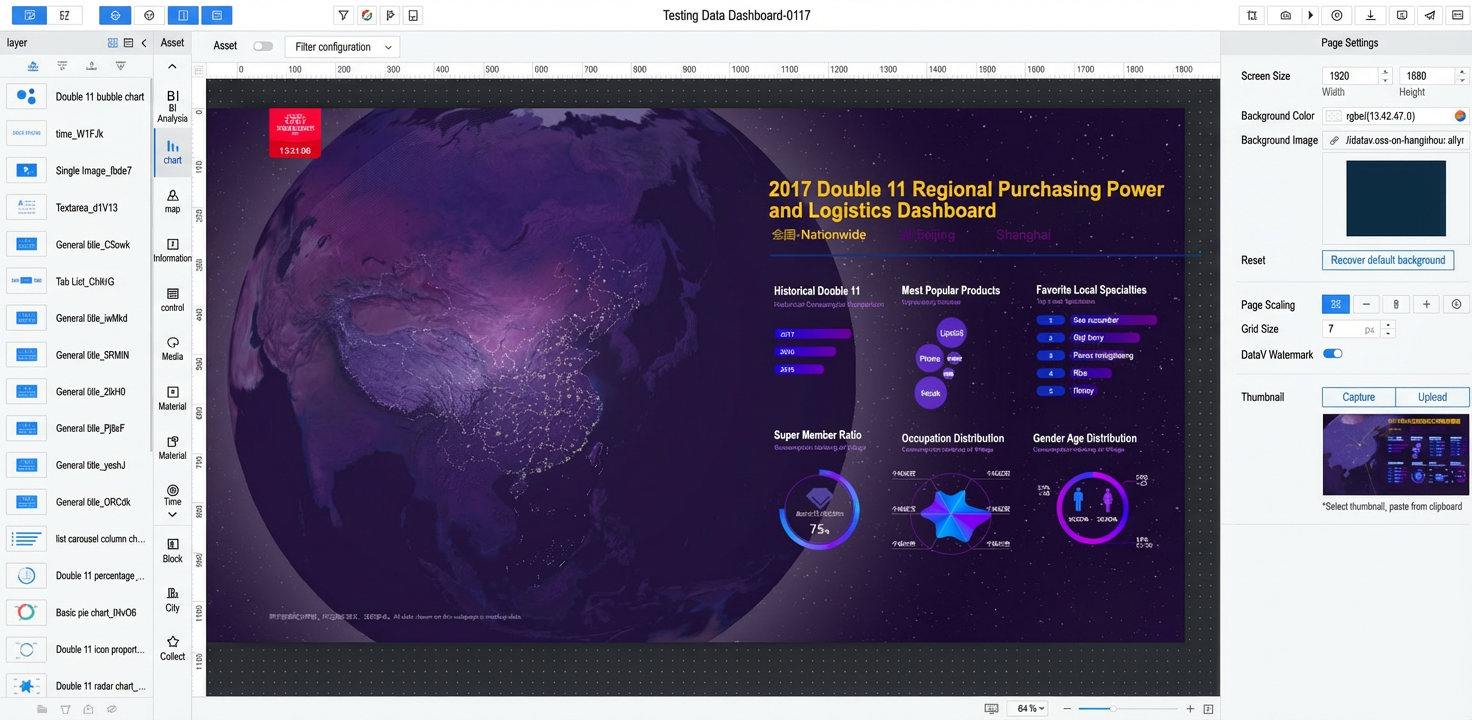
Step 2: Configure widget styles
Modify widget styles using the following methods.
-
Select a widget in the Layers panel on the left, then adjust its style in the panel on the right.
 Note
NoteDouble-click a widget name in the canvas editor to rename it.
-
Repeat for other widgets as needed.
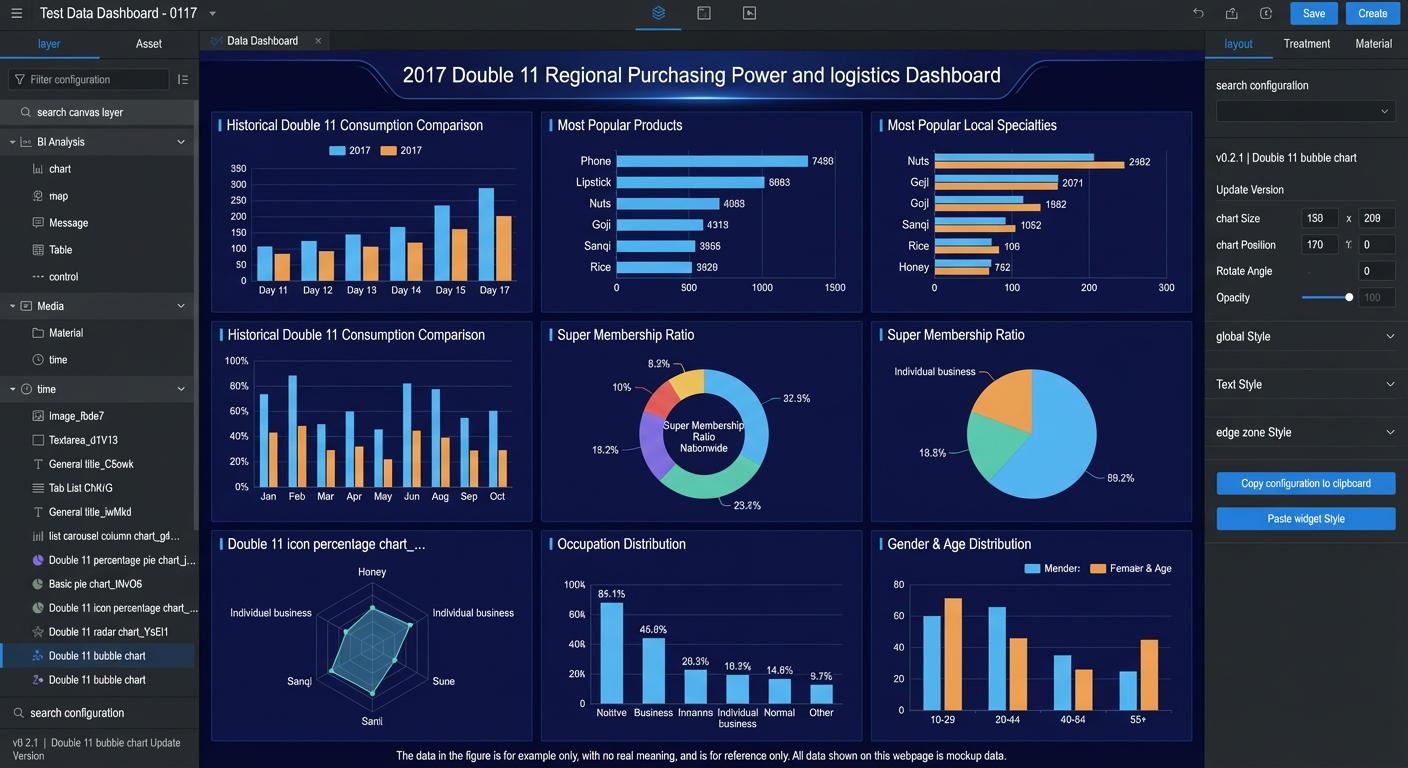
Step 3: Adapt widget data
Modify widget data using the following methods.
-
In the Layers panel, select a widget, such as the Double 11 bubble chart.
-
Click the Data tab in the right panel and click Configure Data Source. In the Data Source dialog box, set Data Source Type to Static Data.
-
Edit the template data in the configuration area, or paste your own JSON data.
NoteField names must match the system settings.
-
Click the
 icon next to Data Response Result on the Set Data Source page to refresh the result.
If the response succeeds, the Data page displays Configuration Complete and Matched Successfully.
-
Repeat for all widgets in the application.
Step 4: Preview and publish the application
After configuring widget styles and data sources, preview and publish the application.
-
Click the
 icon in the upper-right corner of the canvas editor to preview the application.
After previewing, publish the application by following these steps.
-
Click the
 icon in the upper-right corner of the canvas editor, then click Publish Project in the dialog box.
 -
On the publish page, click the
icon next to Sharing URL to copy the link.NoteThe publish page also supports publication information and snapshot management.
-
Open the URL in a browser to view the published application.
 icon in the upper-right corner of the canvas editor, then click Publish Project in the dialog box.
 icon next to Sharing URL to copy the link.