Process data
This document explains how to process data from a CSV file into JSON format.
The Isoline Map widget requires data in the format shown in the following figure. You must process the data to conform to the DataV data specifications.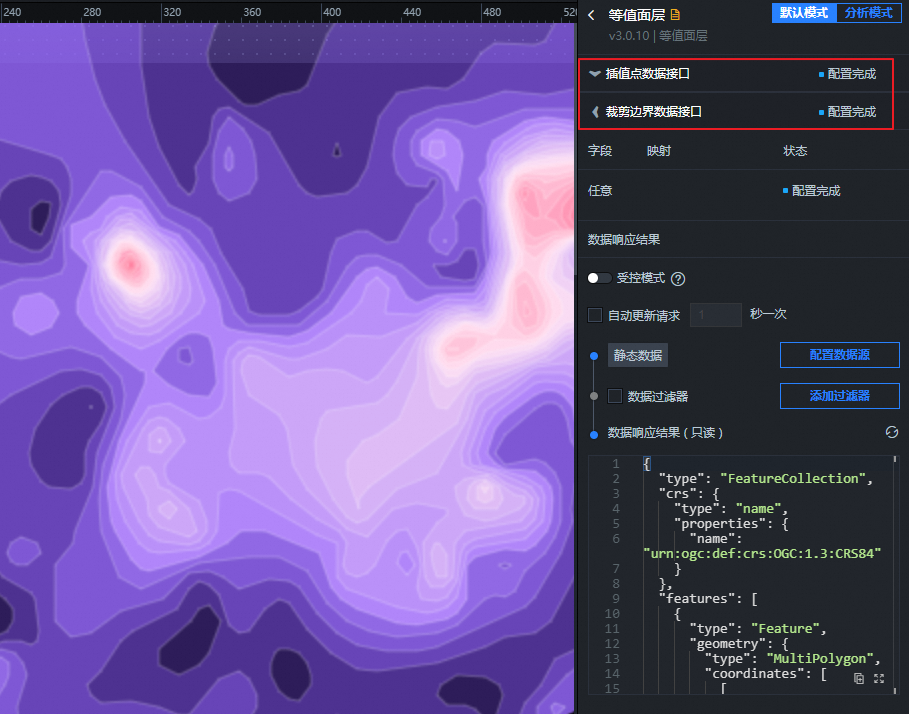
Clipping border data: The border data for the study area, in GeoJSON format.
GeoJSON is a format for encoding geographic data structures. For more information, see the GeoJSON specification.
Interpolation point data: An array that contains the longitude, latitude, and a specific metric value for each monitoring site.
To create an isoline map for a specific time on a single day, such as an air quality index (AQI) map for 12:00 PM on January 20, 2017, you must specify the location (longitude and latitude) and the corresponding AQI value for each monitoring site.
Process the data as follows.
Use the following Node.js script to process the CSV file for all monitoring sites in the country.
NoteTo obtain the CSV file for all monitoring sites in the country, see Get data.
var csv = require("fast-csv");
var fs = require('fs');
var map = {};
csv
.fromPath("./site_list_with_lat_lon_new_1497.csv", { headers: true, objectMode: true })
.on("data", function (data) {
 map[data['code']] = data;
})
.on("end", function () {
 fs.writeFile('./site_lat_lon_mapping.json', JSON.stringify(map));
 console.log("done");
});
This creates a dictionary where the monitoring site ID is the key and the site information is the value.
{
 "1001A": {
     "code": "1001A",
     "name": "Wanshouxigong",
     "city": "Beijing",
     "lng": "116.366",
     "lat": "39.8673"
 },
 "1002A": {
     "code": "1002A",
     "name": "Dingling",
     "city": "Beijing",
     "lng": "116.17",
     "lat": "40.2865"
 },
 "1003A": {
     "code": "1003A",
     "name": "Dongsi",
     "city": "Beijing",
     "lng": "116.434",
     "lat": "39.9522"
 },
 ...
}
Process the data for the 1,497 nationwide monitoring sites for January 20, 2017.
Use the following script to process the 24-hour air quality metric information for each monitoring site. The script extracts this information and adds the corresponding longitude and latitude data to each site using the previously created site latitude and longitude mapping file.
var fs = require('fs');
var csv = require("fast-csv");
var mapdata = require('./site_lat_lon_mapping.json');
var file = './sites_20170101-20170202/china_sites_20170120.csv';
var filename = file.replace(/^.*[\\\/]/, '').split('.')[0].split('_')[2];
var datas = {};
csv
.fromPath(file, { headers: true, objectMode: true })
.on("data", function (data) {
 if (data.type === 'AQI') {
   datas[data.hour] = [];
   for (var key in data) {
     if (mapdata[key]) {
       datas[data.hour].push({
         name: mapdata[key].name,
         value: +data[key],
         code: mapdata[key].code,
         city: mapdata[key].city,
         lng: +mapdata[key].lng,
         lat: +mapdata[key].lat
       })
     }
   }
 }
})
.on("end", function () {
 fs.writeFile('./data/' + filename + '.json', JSON.stringify(datas));
 console.log("done");
});
Set the hour of the day as the key. Set an array of AQI values, locations, and other information from all monitoring sites for that hour as the corresponding value. This makes it easy to retrieve data for each hour and apply it to the Isoline Map widget.
{
"0": [{ "name": "Wanshouxigong", "value": 18, "code": "1001A", "city": "Beijing", "lng": 116.366, "lat": 39.8673 }, { "name": "Dingling", "value": 25, "code": "1002A", "city": "Beijing", "lng": 116.17, "lat": 40.2865 }, ...],
"1": [{ "name": "Wanshouxigong", "value": 28, "code": "1001A", "city": "Beijing", "lng": 116.366, "lat": 39.8673 }, { "name": "Dingling", "value": 65, "code": "1002A", "city": "Beijing", "lng": 116.17, "lat": 40.2865 }, ...],
"2": [{ "name": "Wanshouxigong", "value": 88, "code": "1001A", "city": "Beijing", "lng": 116.366, "lat": 39.8673 }, { "name": "Dingling", "value": 95, "code": "1002A", "city": "Beijing", "lng": 116.17, "lat": 40.2865 }, ...]
 ...
}