The Premium Edition of DataV provides a custom development feature. This feature offers more flexibility than the blueprint editor and lets you create more complex and flexible dashboard effects.
Scenarios
When the built-in features of DataV do not meet your business needs, you can perform custom development by writing JavaScript code (hook scripts) to achieve your desired effects. This feature is more flexible and powerful than the blueprint editor, which helps you customize your data dashboards.
Optimize display effects: Use hook scripts to customize Cascading Style Sheets (CSS) for more impressive effects.
Data processing and transformation: Use hook scripts to perform frontend data processing and transformation to meet specific business logic requirements.
Dynamic content updates: Use hook scripts to implement dynamic content updates and real-time data display for your dashboards.
Advanced animation effects: Use hook scripts to add more complex animation effects to enhance the visual appeal of your dashboards.
Event responses: Respond to user actions, such as clicks and hovers, to enhance dashboard interactivity.
Limits
This feature is available only for Premium Edition users. If you are not a Premium Edition user, upgrade your product first.
How to use hook scripts for development
Log on to the DataV console.
- On the My Visualizations page, click Edit above the project that you created.
Go to the visualization application canvas and add the required widgets.
In this example, a regular widget and a map widget are added. A map sub-widget is then added to the map widget.
Click a regular widget on the canvas, such as the Liquid Fill Gauge widget shown in the following figure.
Open the developer tools in your browser.
On a Windows computer, press the F12 keyboard shortcut. On a Mac computer, press the command+option+i composite key to open the debugging console.
On the Console tab of the debugging console, view the key value of each widget.
Select the regular widget to view and retrieve its key value in the console.
Select the map widget on the canvas, such as the Basic 2D Map widget in the following figure. Similar to how you retrieved the key for the regular widget, view and retrieve the key value of the parent map container on the Console tab.
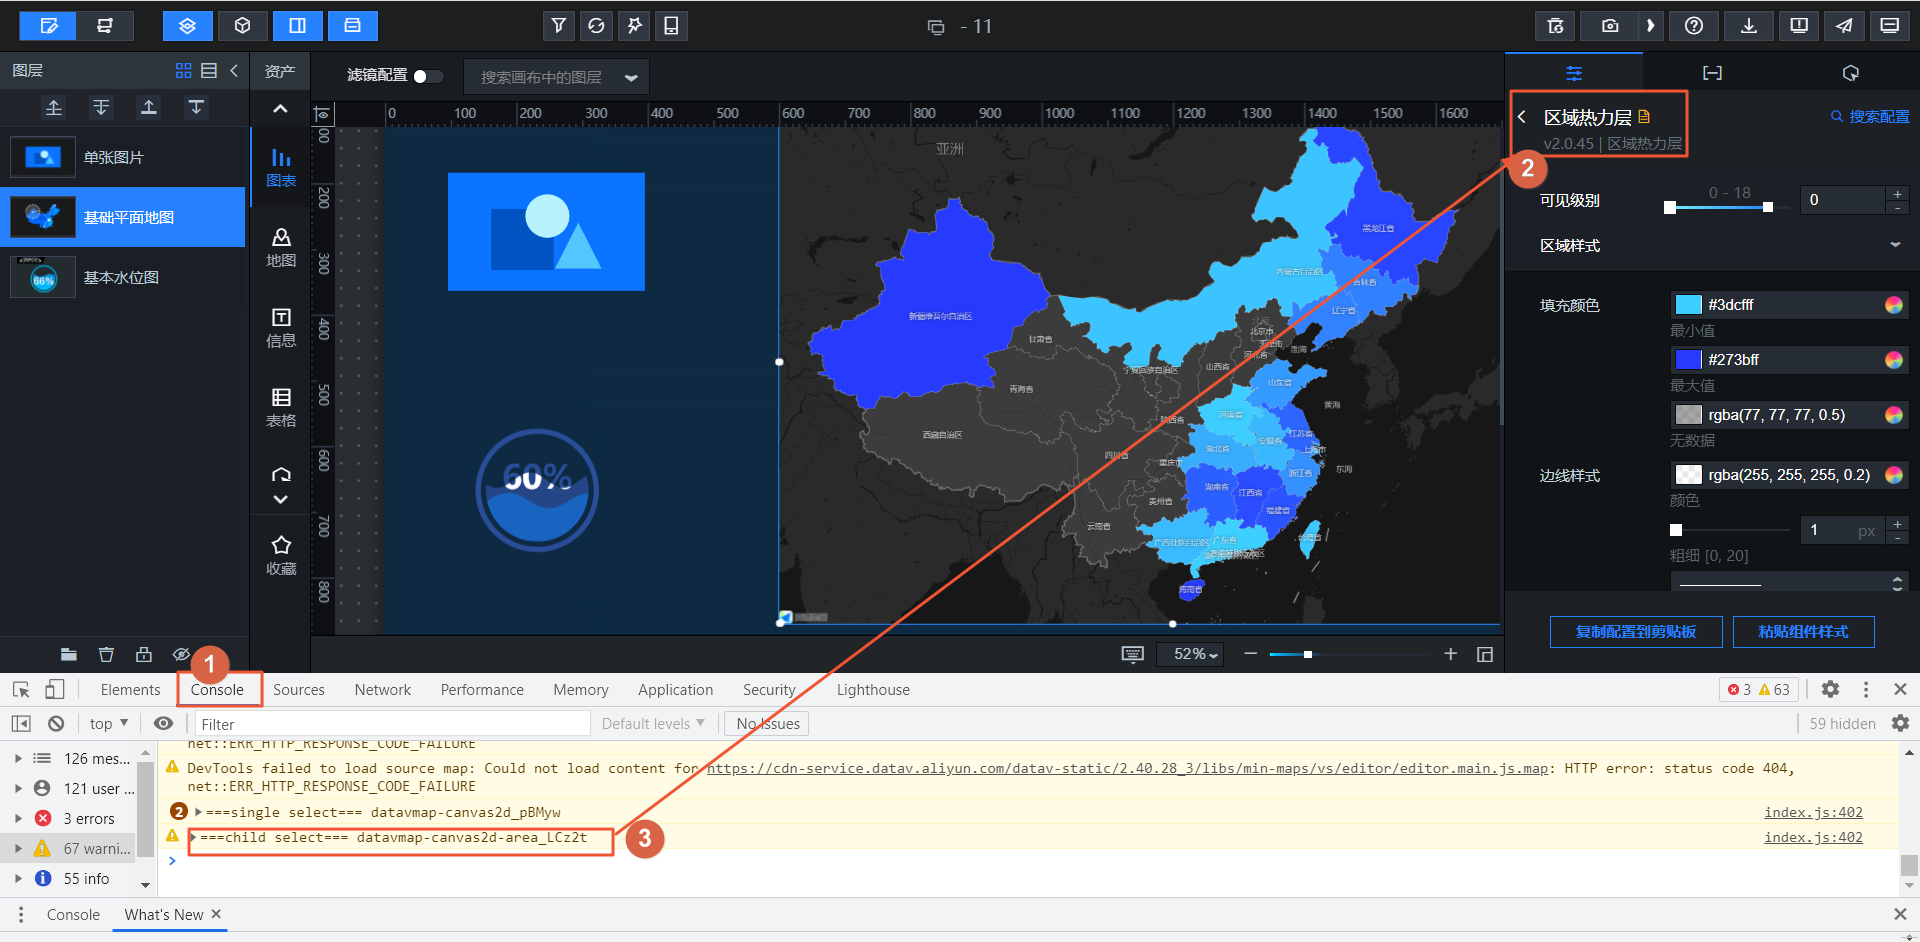
This example uses a Choropleth Layer sub-widget added to the Basic 2D Map widget. In the map widget's configuration pane, click the Choropleth Layer sub-widget. Similar to how you retrieved the key for the parent map container, view and retrieve the key value of the Choropleth Layer sub-widget on the Console tab.
Figure 1. Select the choropleth layer sub-widget
Figure 2. View and retrieve the key of the choropleth layer
On the DataV canvas editor page, replace screen in the page URL with hook. Open the modified URL to open the hook editor for the current visualization application.
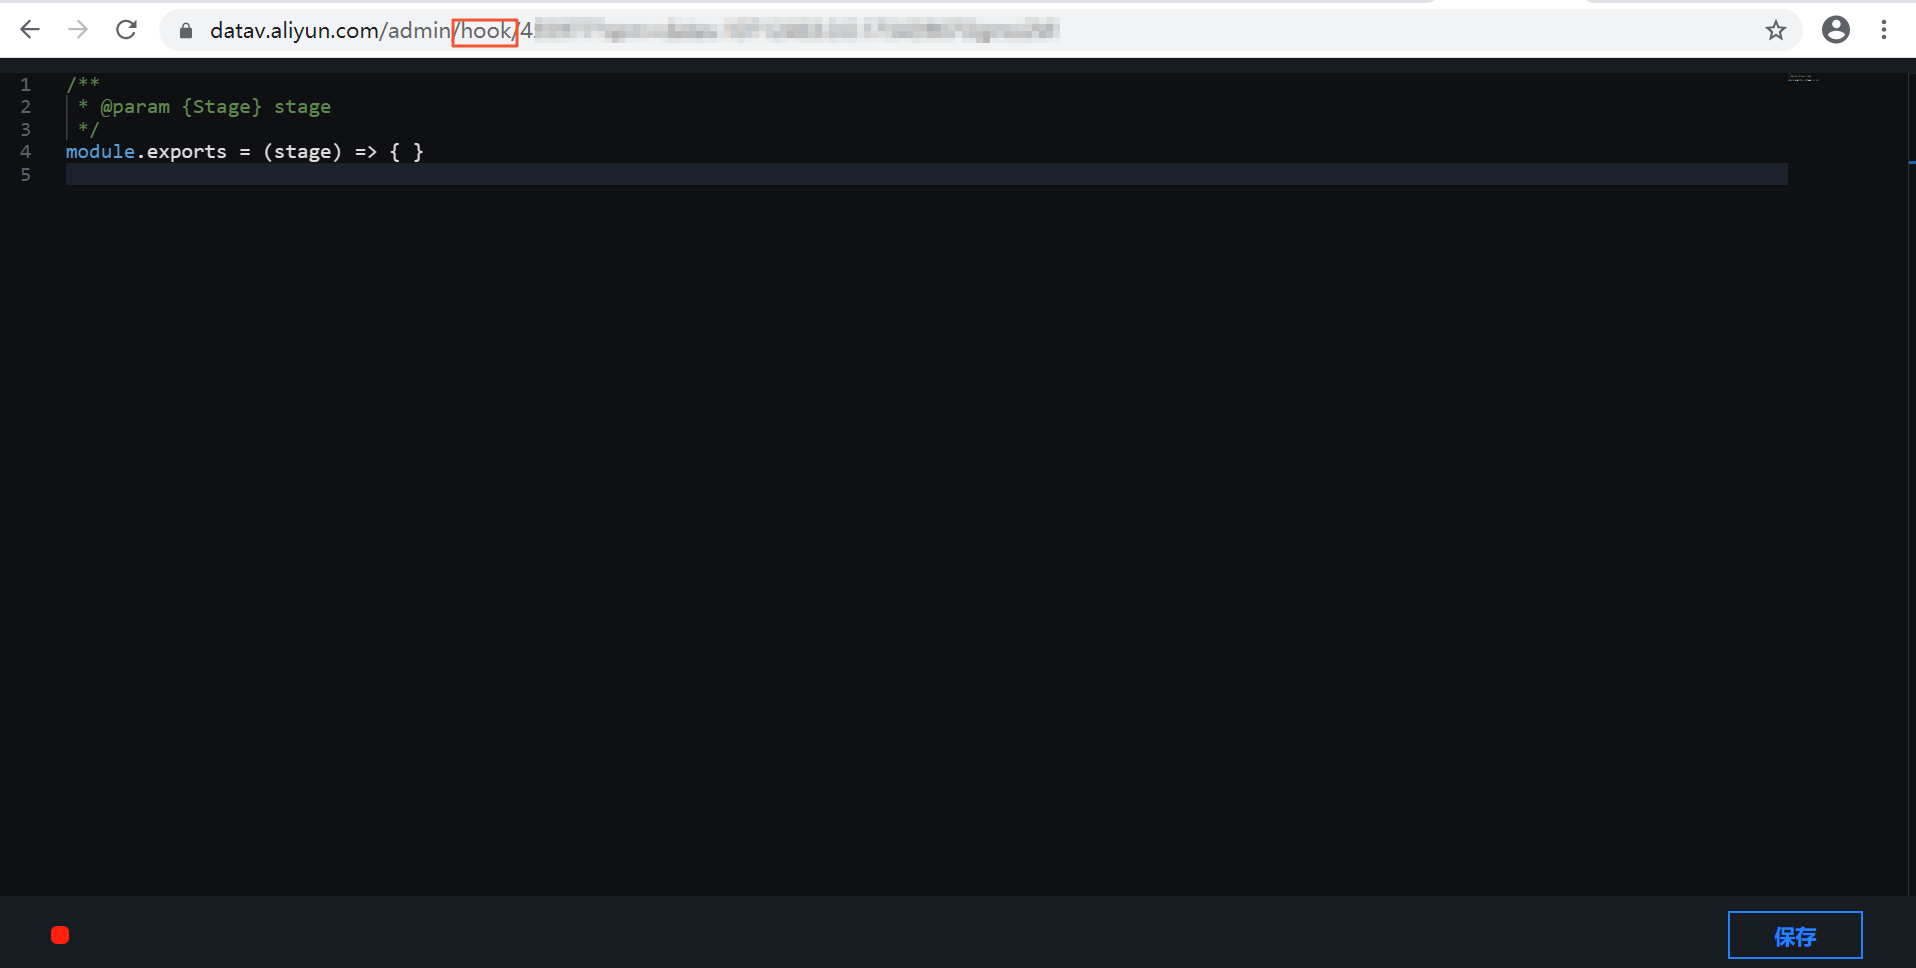
In the hook script editor, retrieve the widget object.
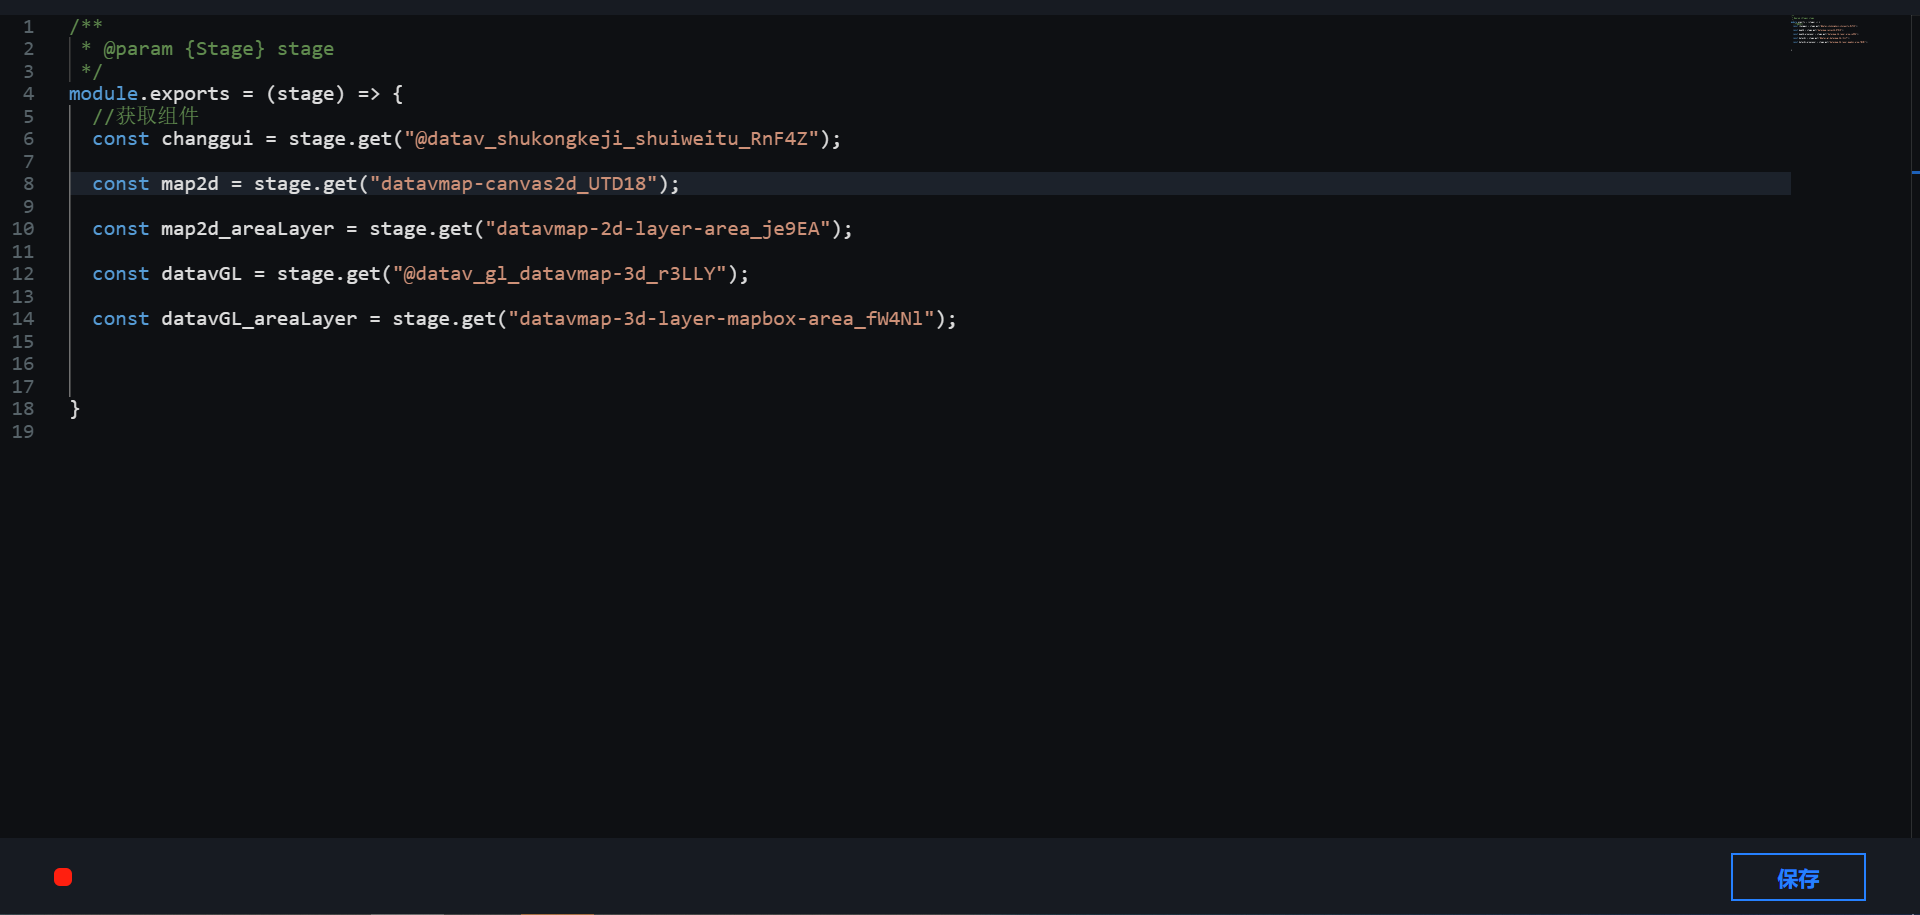
The following code provides an example.
module.exports = (stage) => {
 // Get the widgets
 const regularWidget =
stage.get("@datav_shukongkeji_shuiweitu_ARVrX");

 const map2d =
stage.get("datavmap-2d_CpH7b");

 const map2d_areaLayer =
stage.get("datavmap-2d-layer-area_je9EA");

 const datavGL =
stage.get("@datav_gl_datavmap-3d_r3LLY");

 const datavGL_areaLayer =
stage.get("datavmap-3d-layer-mapbox-area_fW4Nl");

}
Basic DOM operations on a DataV visualization application page
Basic Document Object Model (DOM) operations in a DataV application include the following:
View the overall DOM layout of a DataV application on the preview page.
To view the DOM layout, perform the following steps:
Click Preview for the visualization application to open the preview page.
On the preview page, press the F12 keyboard shortcut on a Windows computer or the command+option+i composite key on a Mac computer to open the debugging console.
On the Elements tab of the debugging console, view the application's container div and all the widgets added to it.
The container div of the application (① in the figure).
All widgets added to the application (② in the figure).
Go to the hook editor to view the page's DOM layout in the hook script editor.
The following code provides an example.
module.exports = function (stage) {
 // The hook editor supports jQuery by default. You can use $(".layer") to get the dashboard container div node.
 let datavLayout = $(".layer");
}
Modify the DOM node style of a DataV widget.
The following sample code shows how to modify the node style in the hook script editor.
module.exports = function (stage) {
 const com = stage.get("WidgetKey"); // Get the widget
 // Modify the widget position
 $(com.container).parent().css({
 "left": 0,
 "top": 100
 });
 // Modify the widget opacity
 $(com.container).parent().css("opacity",
0.6);

 $(com.container).parent().fadeIn();

 $(com.container).parent().fadeOut();

 // Other jQuery animations, and so on
}
Use SVG on a DataV visualization application page
The following sample code shows how to use Scalable Vector Graphics (SVG) in a DataV application.
module.exports = function (stage) {
 let datavLayout = $(".layer");

 const mySvg = '<svg
width="1920" height="1080"
xmlns="http://www.w3.org/2000/svg">'
 + '<path d="M50,100 q300,200
420,300 q700,200 1000,0" stroke="#cd0000"
stroke-width="10" fill="none" />'
 + '<text font-family="microsoft
yahei" x="0" y="0" fill="white"
style="font-size:100">DataV'
 + '<animateMotion
path="M50,100 q300,200 420,300 q700,200 1000,0" begin="0s"
dur="3s" rotate="auto"
repeatCount="indefinite"/>'
 + '</text>'
 + '</svg>';

 datavLayout.append(mySvg);
}
Use Canvas on a DataV visualization application page
The following sample code shows how to use Canvas in a DataV application.
module.exports = function (stage,
groupnoneed, done) {
 let datavLayout = $(".layer");

 const myCanvas = '<canvas
id="myCanvas" width="1920" height="1080"/>';
 datavLayout.append(myCanvas);

 // Get the Canvas object (the canvas).
 var canvas =
document.getElementById("myCanvas");

 // Check if the current browser supports the Canvas object to avoid syntax errors in browsers that do not support HTML5.

 if(canvas.getContext){
 // Get the corresponding CanvasRenderingContext2D object (the brush).
 var ctx =
canvas.getContext("2d");

 // Start a new drawing path.

 ctx.beginPath();
 // Set the arc color to white.

 ctx.strokeStyle = "white";
 var circle = {
 x : 400, // x-coordinate of the circle's center
 y : 300, // y-coordinate of the circle's center
 r : 100 // radius of the circle
 };

 // Draw an arc clockwise along a circle with a center at (400, 300) and a radius of 100 px.

 ctx.arc(circle.x, circle.y, circle.r,
0, Math.PI / 2, false);
 // Draw the arc along the specified path.
 ctx.lineWidth = 10;
 ctx.strokeStyle = '#e3f';
 ctx.stroke();
 }
}
Use CSS on a DataV visualization application page
The following sample code shows how to use CSS in a DataV application.
module.exports = function (stage,
groupnoneed, done) {
 const css = '<style>'
 + '.anim-opacity2{'
 + 'animation:5s opacity2 0s
infinite;'
 + '-webkit-animation:5s opacity2 0s
infinite;'
 + '-moz-animation:5s opacity2 0s
infinite}'
 + '@Keyframes
opacity2{0%{opacity:0}50%{opacity:1}100%{opacity:0}}'
 + '@-webkit-Keyframes
opacity2{0%{opacity:0}50%{opacity:1}100%{opacity:0}}'
 + '@-moz-Keyframes
opacity2{0%{opacity:0}50%{opacity:1}100%{opacity:0}}'
 + '</style>';
 $("head").append(css);

 $(stage.get("SingleImage_NCK7b").container).addClass("anim-opacity2"); // You can replace SingleImage_NCK7b with the key of any widget in the visualization application.

 const httpPre =
'http://g.alicdn.com/alilog';
 const script = '<script
type="text/javascript" async="" src="'+ httpPre
+'/oneplus/entry.js?t=212092"></script>';
 $("head").append(script);

 const css2 = '<link
href="//cdn-service.datav.aliyun.com/datav-static/1.6.24_1/css/error-cover.css"
rel="stylesheet">'
 $("head").append(css2); // Add the style tag to the <head> tag in the HTML.
}
Perform callback ID operations using hook scripts
The following sample code shows how to register and listen for callback IDs with hook scripts.
module.exports = function (stage) {
 const carouselWidget = stage.get("ListCarouselColumnChart_H56r8");
 const flylineCom =
stage.get("map3d-earth-flyingline_bPFjS"); // Fly line

 setTimeout(function(){
 for (let i=0; i<3; i++) {
 const index = i;
 setTimeout(function(){
 const adcode =
carouselWidget._data[index].adcode;
 // Register the callback ID event.
 carouselWidget.emit('global_var',
'adcode', adcode);
 }, index * 5000);
 }
 },3000);

 // Method 1: Listen for the callback ID event.
 flylineCom.addListener('global_var',
function(arg1, arg2) {
 console.log('global_var', "Method 1: " + arg1, arg2); // arg1 = 'adcode'; arg2 = '330000';
 });

 // Method 2: Listen for the callback ID event.
 flylineCom.on('global_var', function(arg1,
arg2) {
 console.log('global_var', "Method 2: " + arg1, arg2); // arg1 = 'adcode'; arg2 = '330000';

 });
}