Examples
This topic provides two examples that demonstrate how to use the geo-tool with a basic flat map: Drill down by administrative region and Custom area drill-down.
Drill down by administrative region
This example shows how to create hierarchical drill-down data. The data uses existing administrative region borders in a Province > City > District/County hierarchy. It demonstrates the complete process of creating this hierarchy.
Log on to the DataV console.
In the DataV console, select a visualization application and click Edit.
In the All Assets pane, select Map > Basic Flat Map and add it to the canvas editor.
In the Configuration panel, click + Subcomponent Management, select Custom Area Drill-down Layer, and then click + Add Subcomponent.
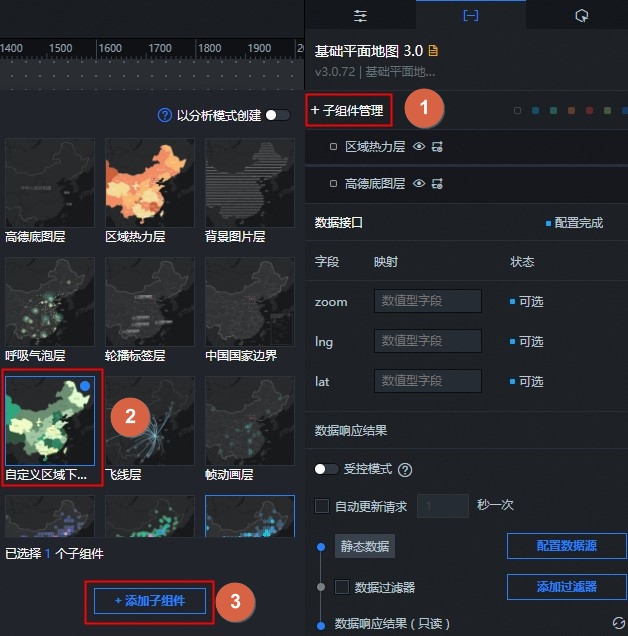
Click the Custom Area Drill-down Layer sub-widget, navigate to the Data panel, and click Custom TopoJSON Data API.
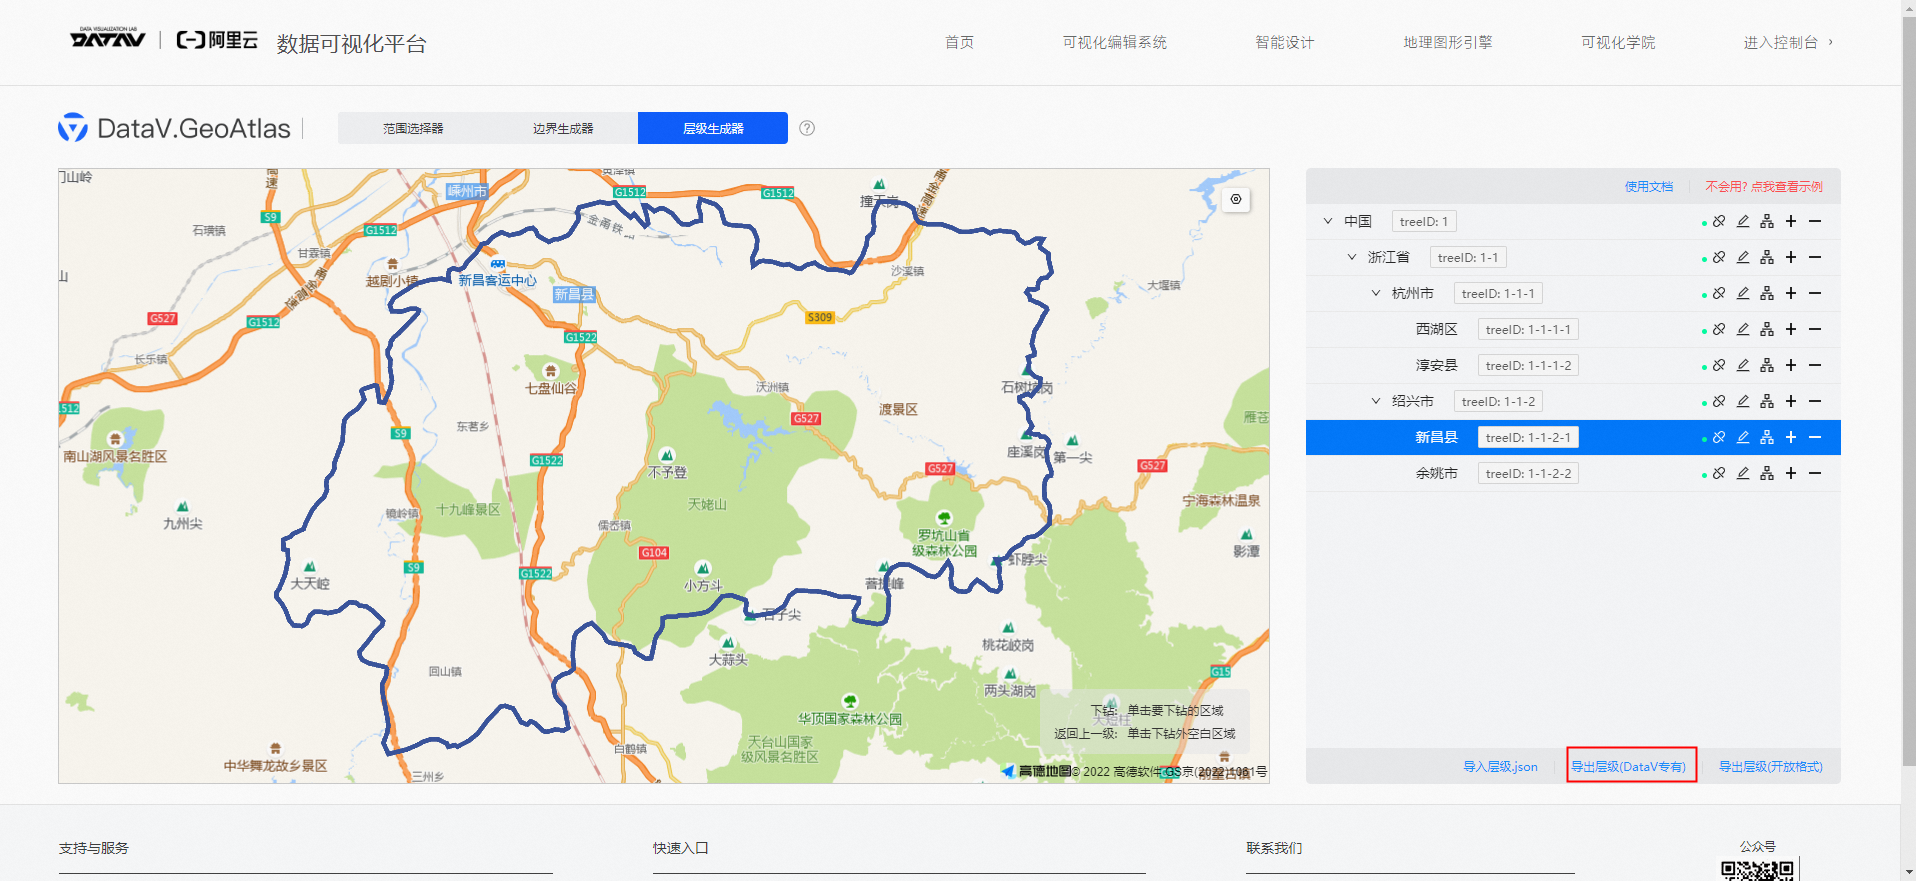
Log on to DataV.GeoAtlas and select Hierarchy Generator.
In the root area, click the
 icon to attach data.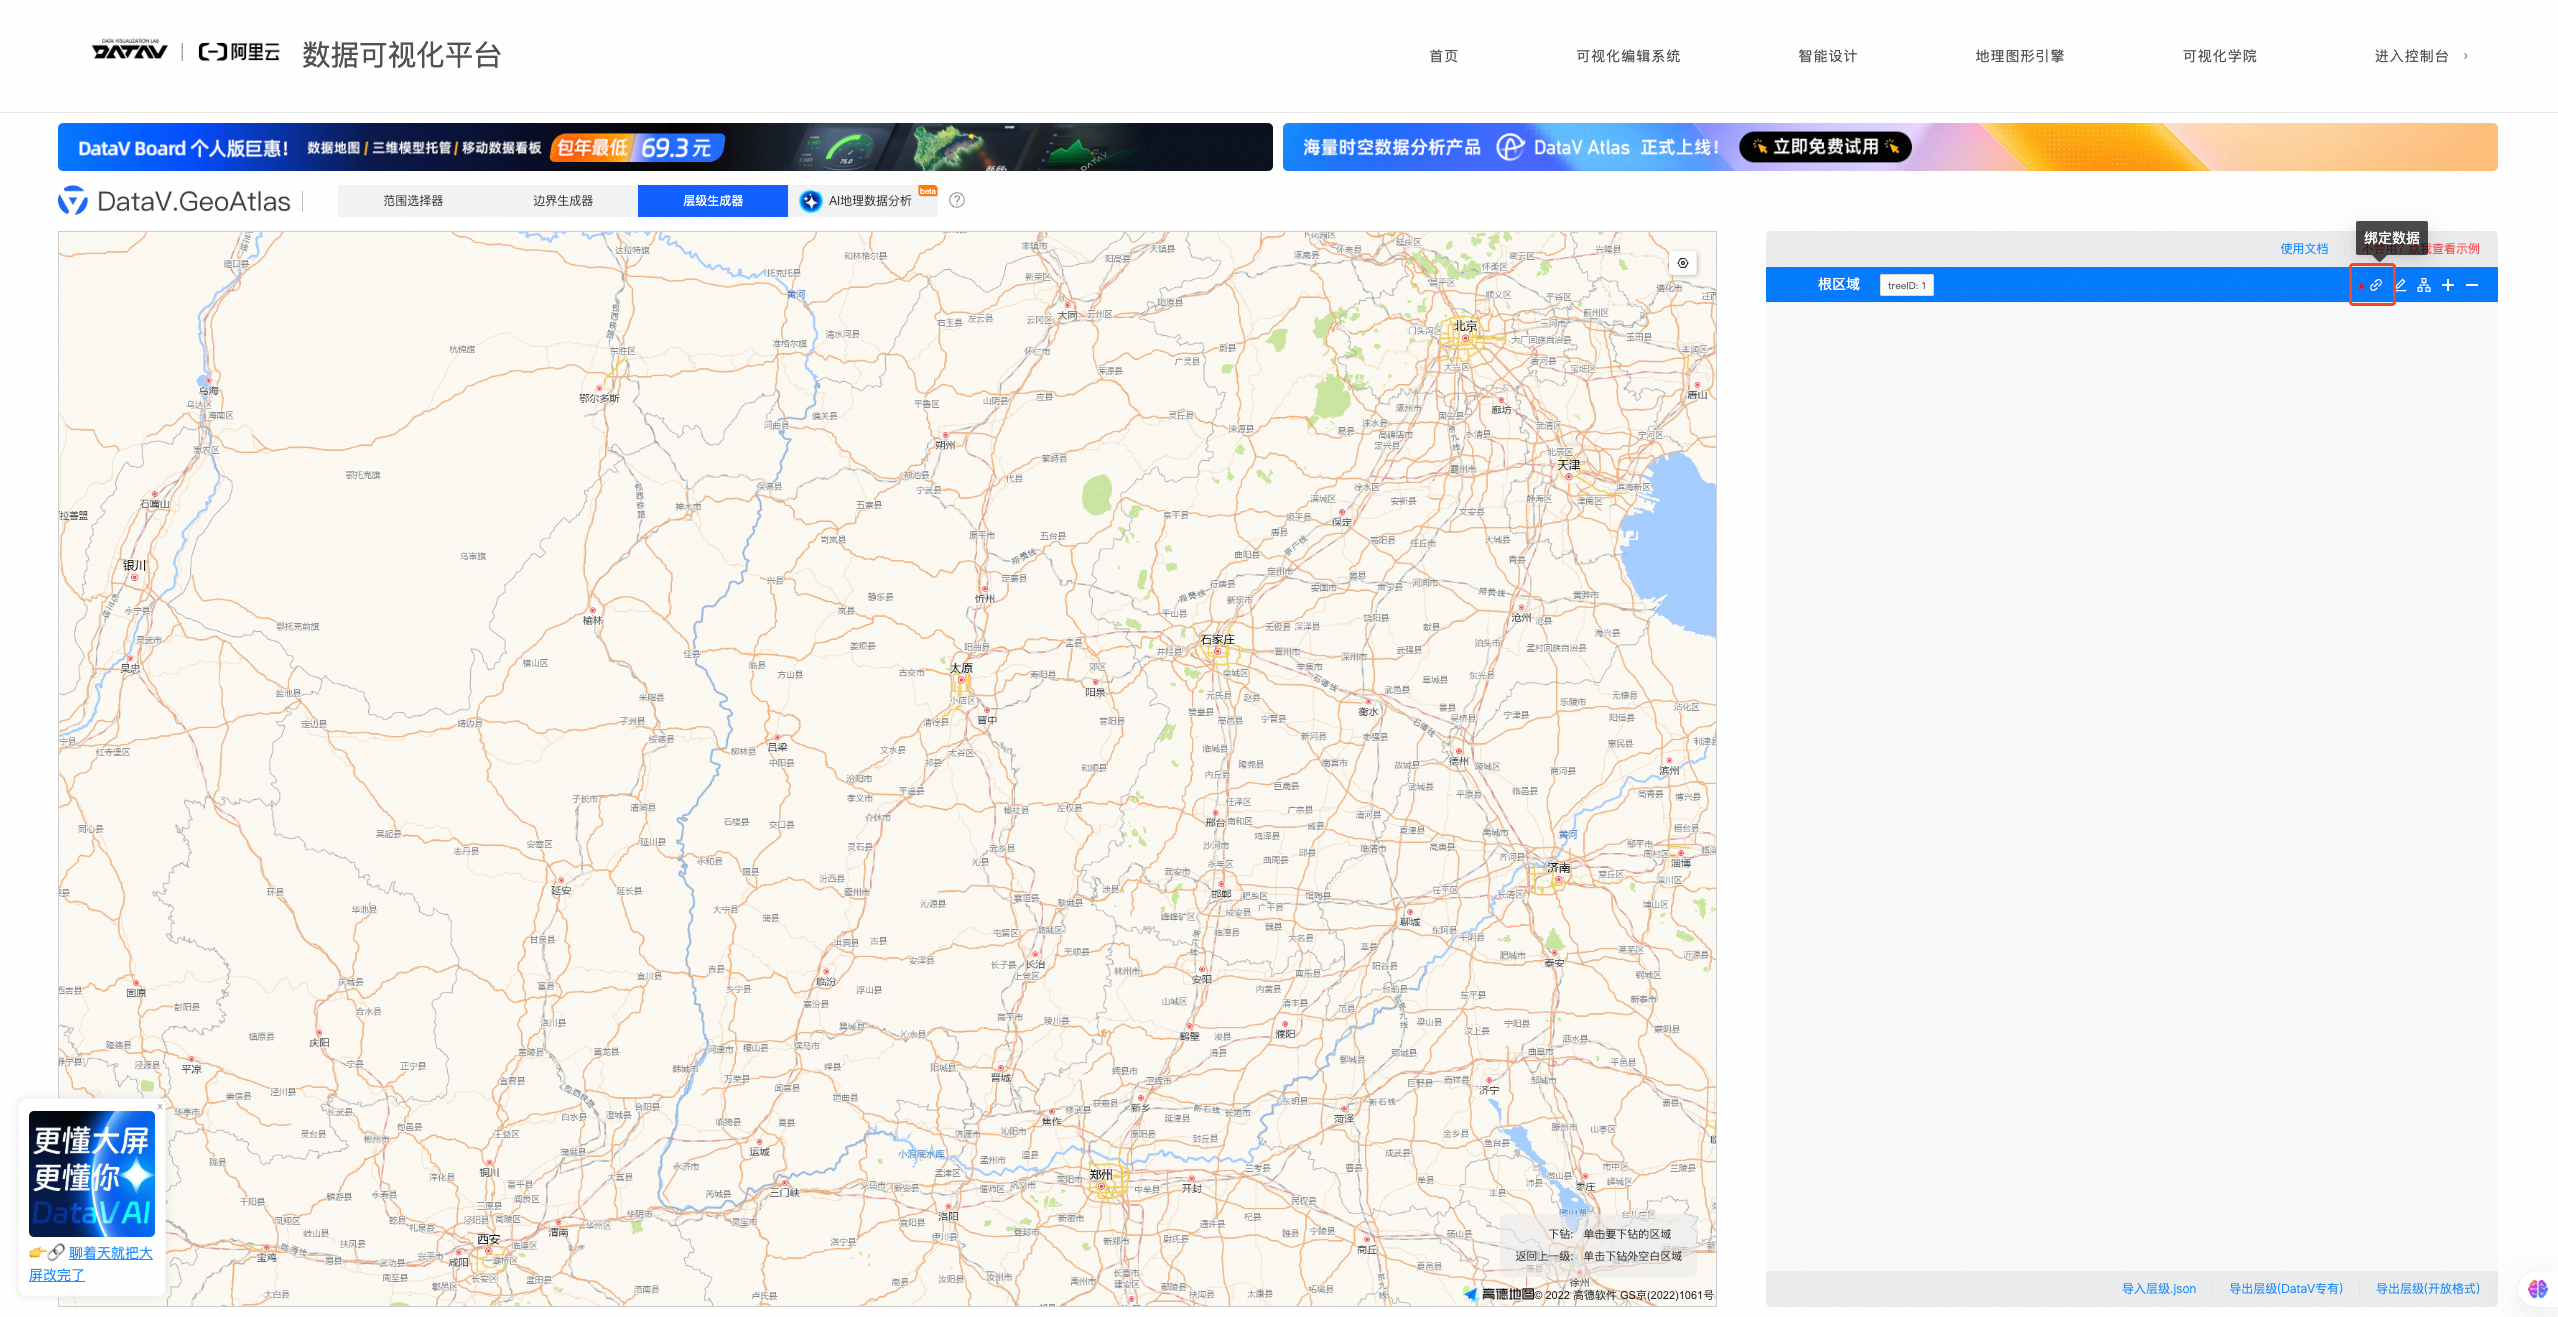
In the window that appears, enter China. Do not select the Add all descendant nodes at the same time checkbox. Click Confirm.
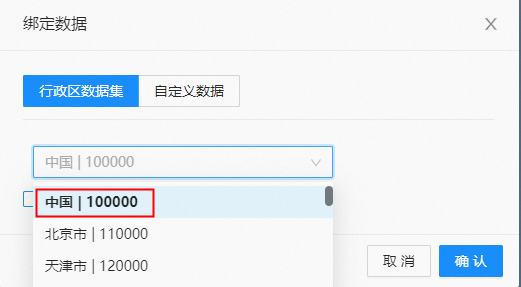
Click the
 icon to add a child node for the province level.
In the window that appears, enter Zhejiang Province. Do not select the Add all descendant nodes at the same time checkbox. Click Confirm.
To the right of the Zhejiang Province level, click the
 icon. Add Hangzhou City and Shaoxing City to create the city level.
To the right of the Hangzhou City level, click the
icon. Add Xihu District and Chun'an County to create the district/county level.To the right of the Shaoxing City level, click the
icon. Add Yuyao City and Xinchang County to create the district/county level.Click Export Hierarchy (DataV Only) to export and save the hierarchy JSON file to your computer.
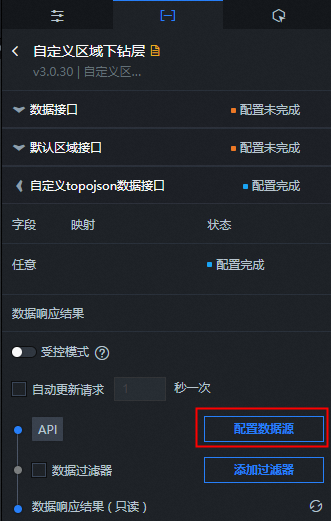
Select the Custom Area Drill-down Layer. On its Data panel, in the Custom TopoJSON Data API section, click Configure Data Source.
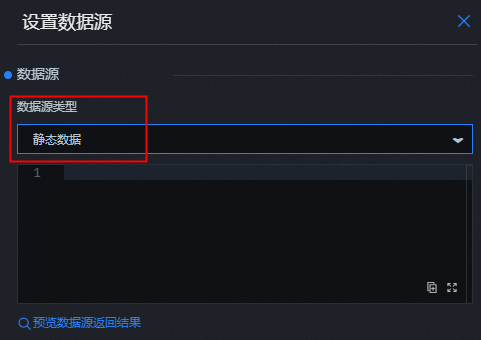
Set Data Source Type to Static Data.
Open the hierarchy file that you downloaded from the geo-tool. Copy its content and paste it into the data entry window.
To the right of the data response result, click the
icon to refresh the result.In the upper-right corner, click the Preview
icon to preview the configuration. Double-click an area to drill down. Double-click an unselected area to roll back.
 icon to refresh the result.
 icon to preview the configuration. Double-click an area to drill down. Double-click an unselected area to roll back.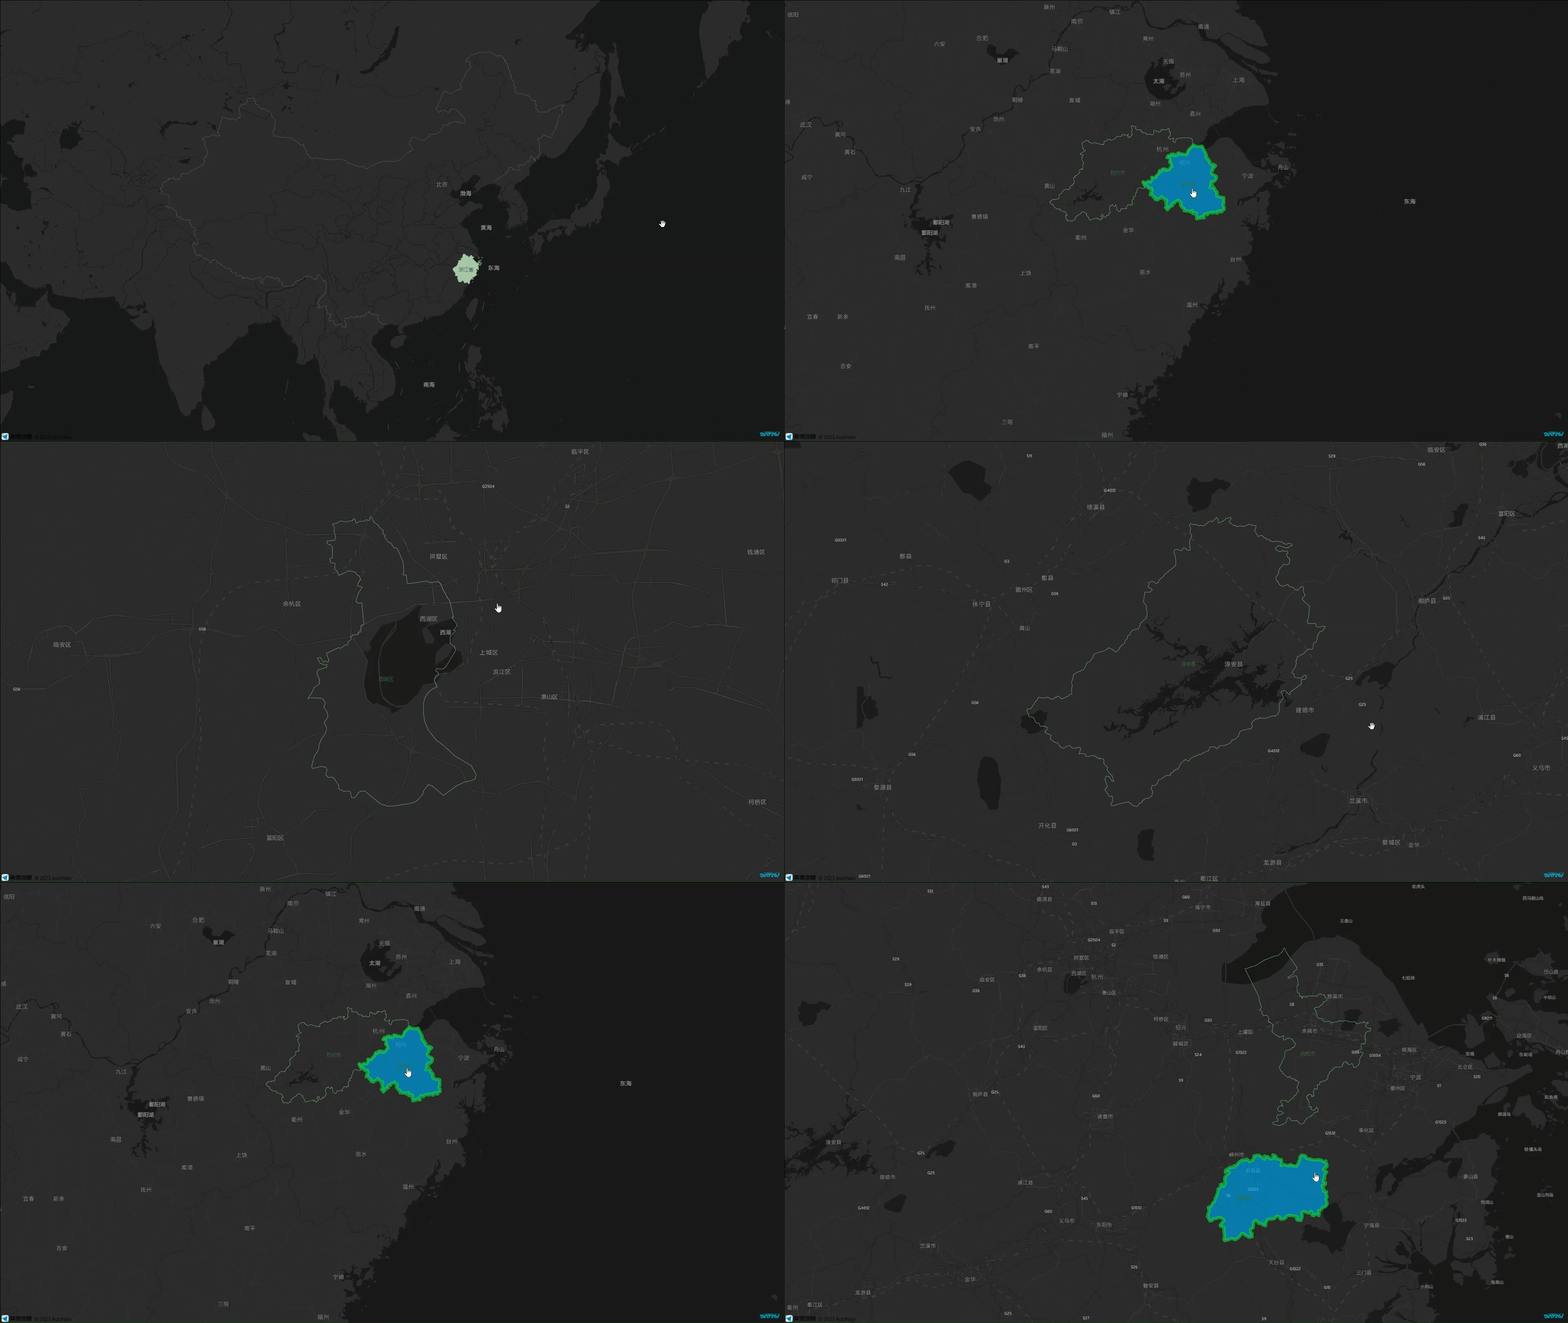
Custom area drill-down
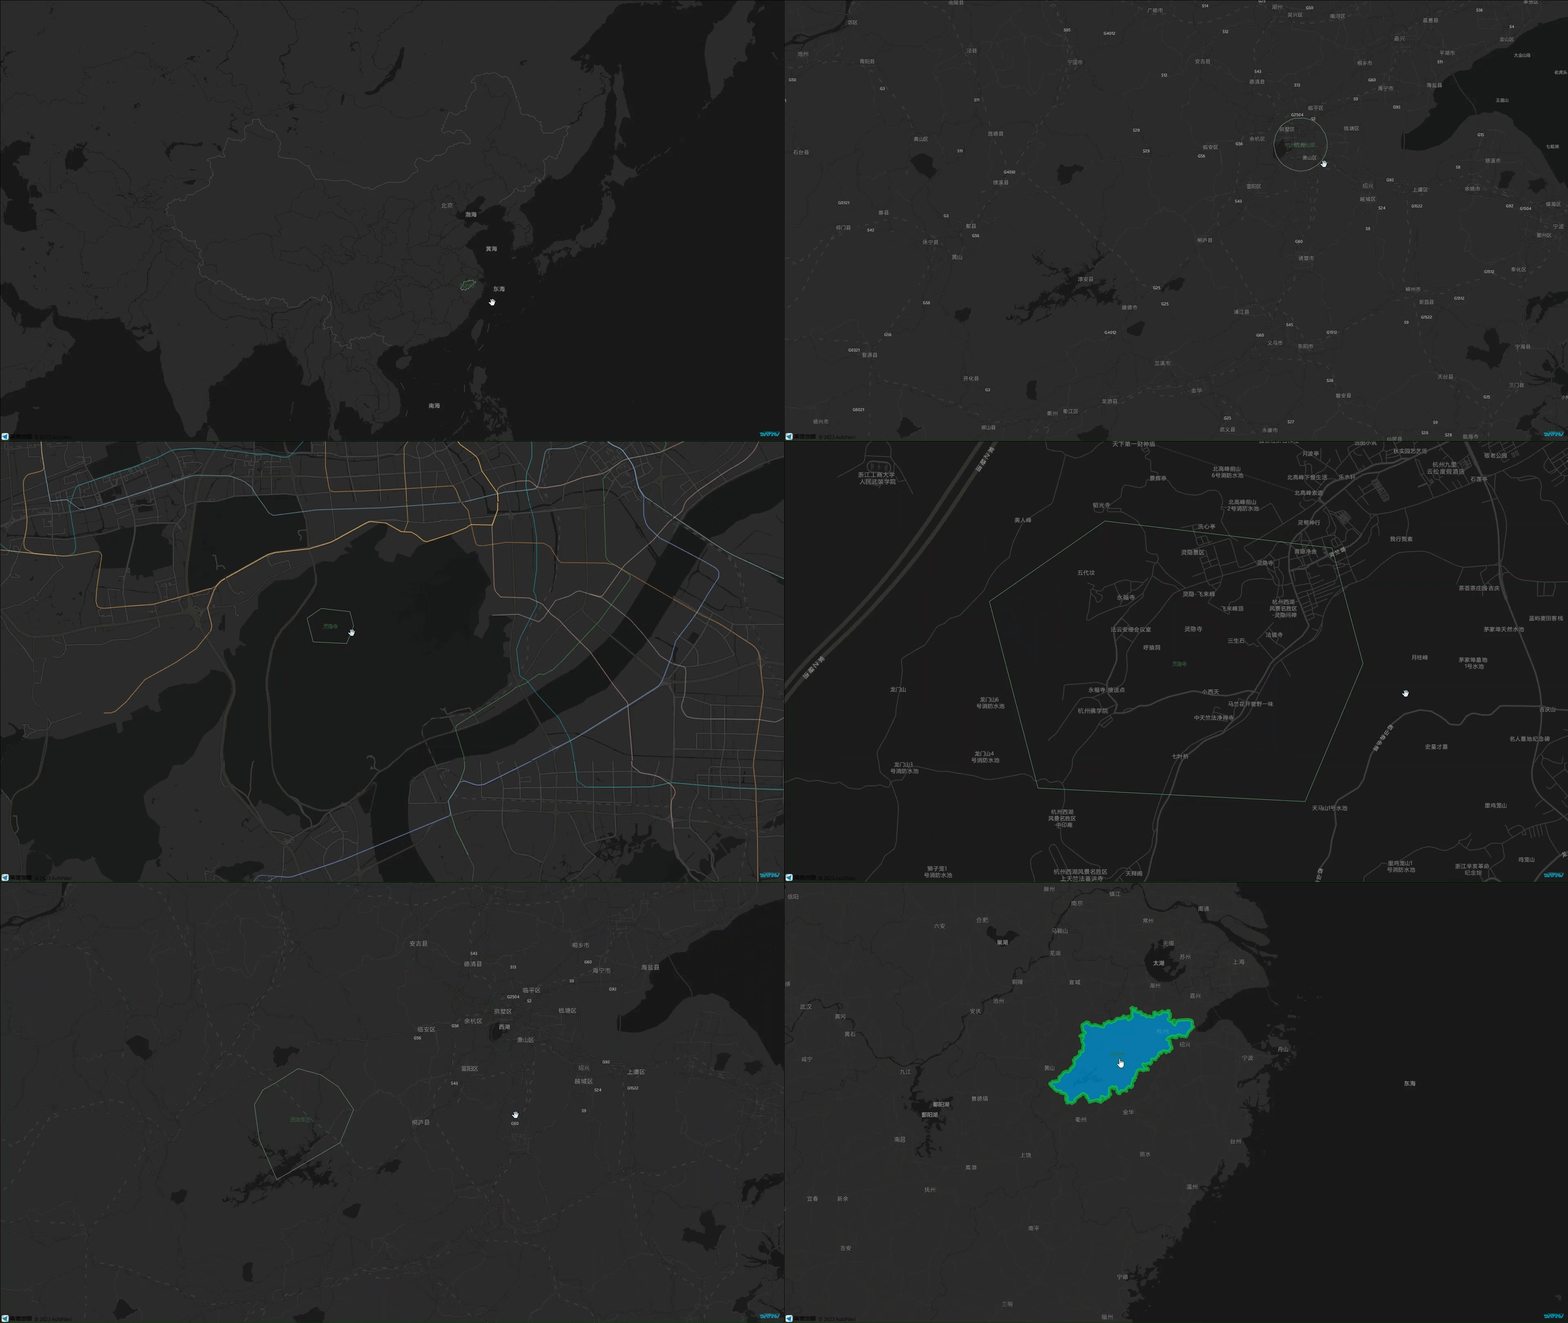
This example demonstrates how to create a custom drill-down hierarchy using drawn geometric shapes. The example starts with the administrative borders of Zhejiang Province and creates a hierarchy that drills down to Lingyin Temple in Hangzhou.
Log on to the DataV console.
In the DataV console, select a visualization application and click Edit.
In the All Assets pane, select Map > Basic Flat Map and add it to the canvas editor.
In the Configuration panel, click + Subcomponent Management, select Custom Area Drill-down Layer, and then click + Add Subcomponent.
Click the Custom Area Drill-down Layer sub-widget, navigate to the Data panel, and click Custom TopoJSON Data API.
Log on to DataV.GeoAtlas and select Range Selector.
In the map panel on the left, click the Zhejiang Province area. In the Select required data format module, click the Download
icon to save the Zhejiang Province map JSON file to your computer.Select Border Generator. In the map panel on the left, click the
icon to import the saved JSON file.In the property table panel below, select Hangzhou City and click Locate to zoom in to the Hangzhou City area.
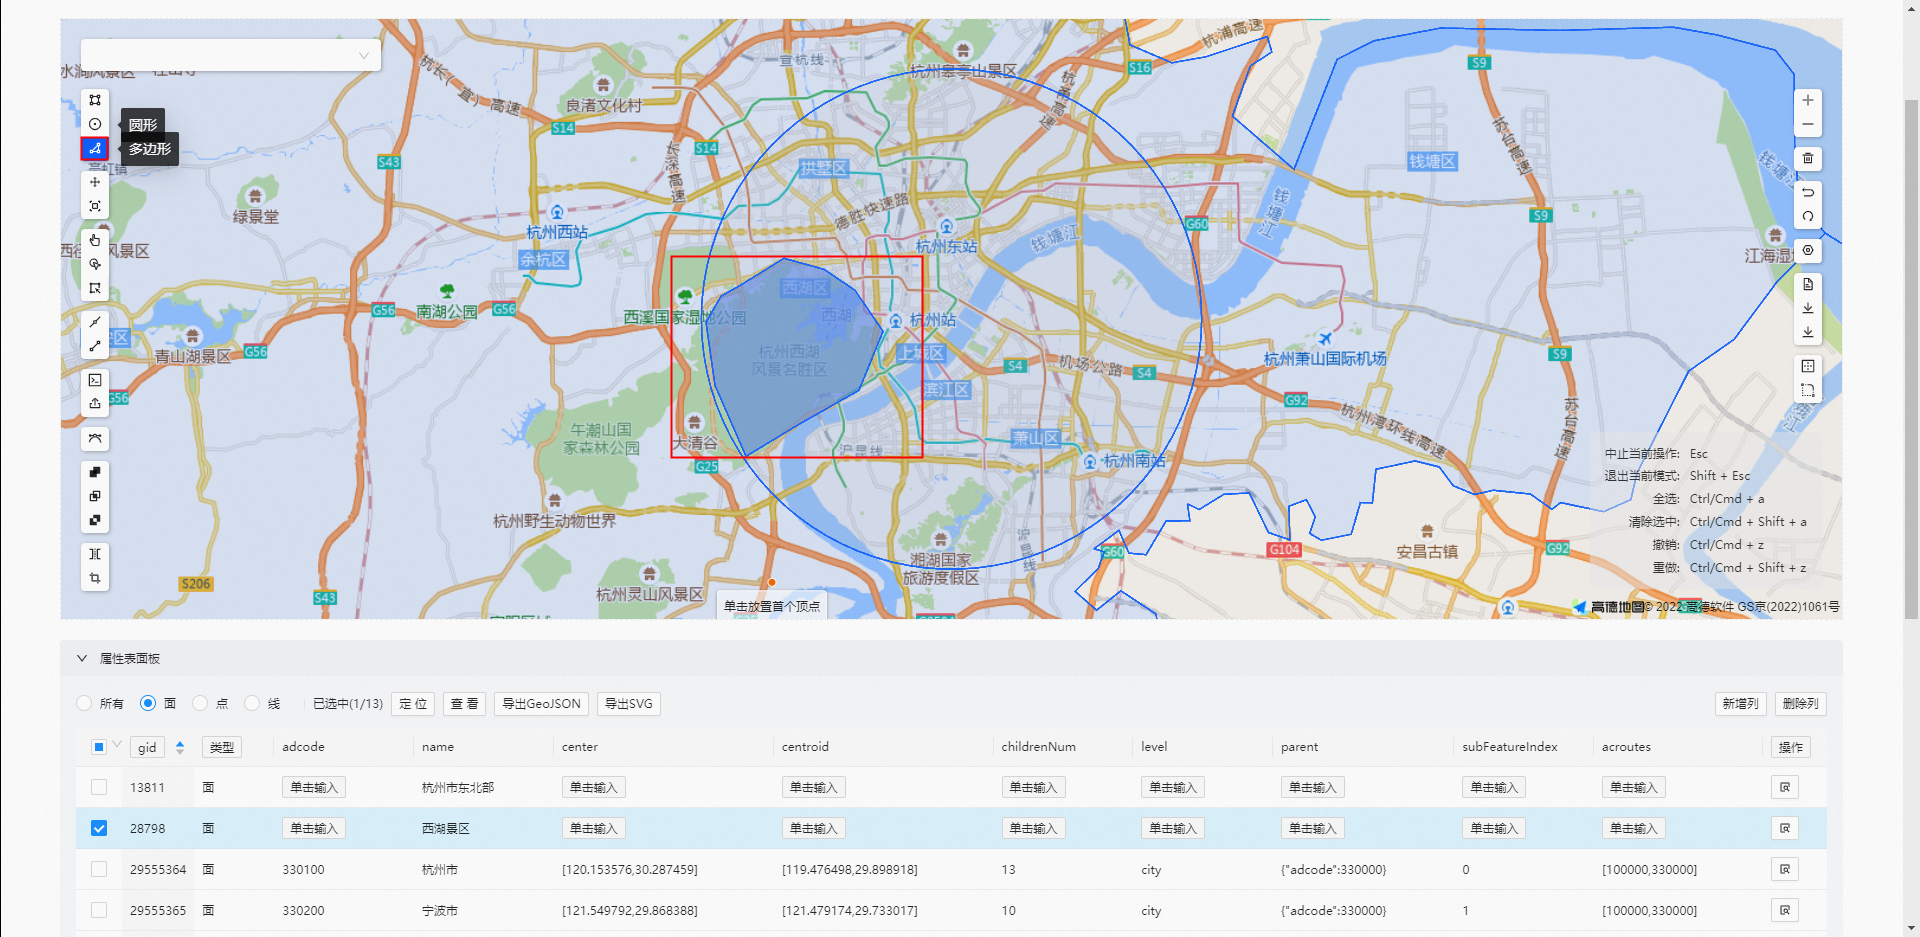
In the map panel on the left, click the
icon. Use the circular area tool to select the northeastern part of Hangzhou City. Change the namefield to Northeastern Hangzhou.In the property table panel below, select the circular area and click Locate to zoom in to the current area.
In the map panel on the left, click the
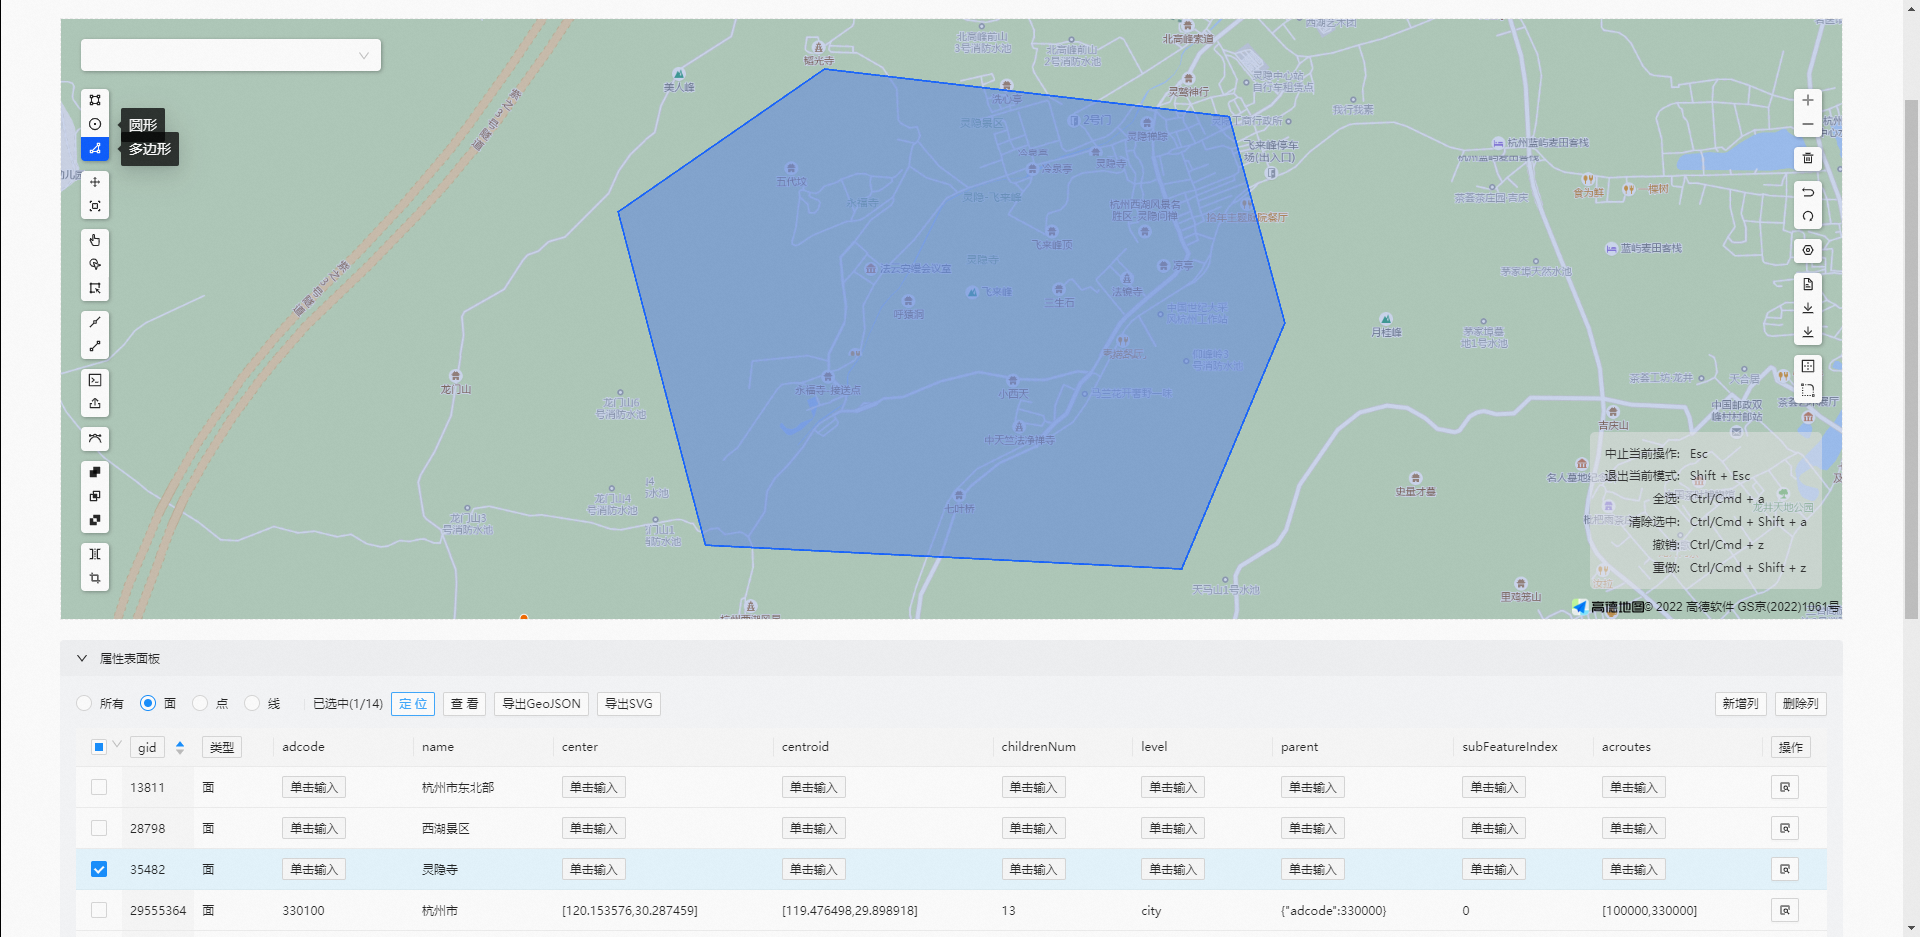
icon. Use the polygon tool to draw a border around the Hangzhou West Lake Scenic Area. Change the namefield to West Lake Scenic Area.Repeat the previous step. Within the West Lake Scenic Area, use the polygon tool to draw a border around the Lingyin Temple area, and then zoom in. Change the
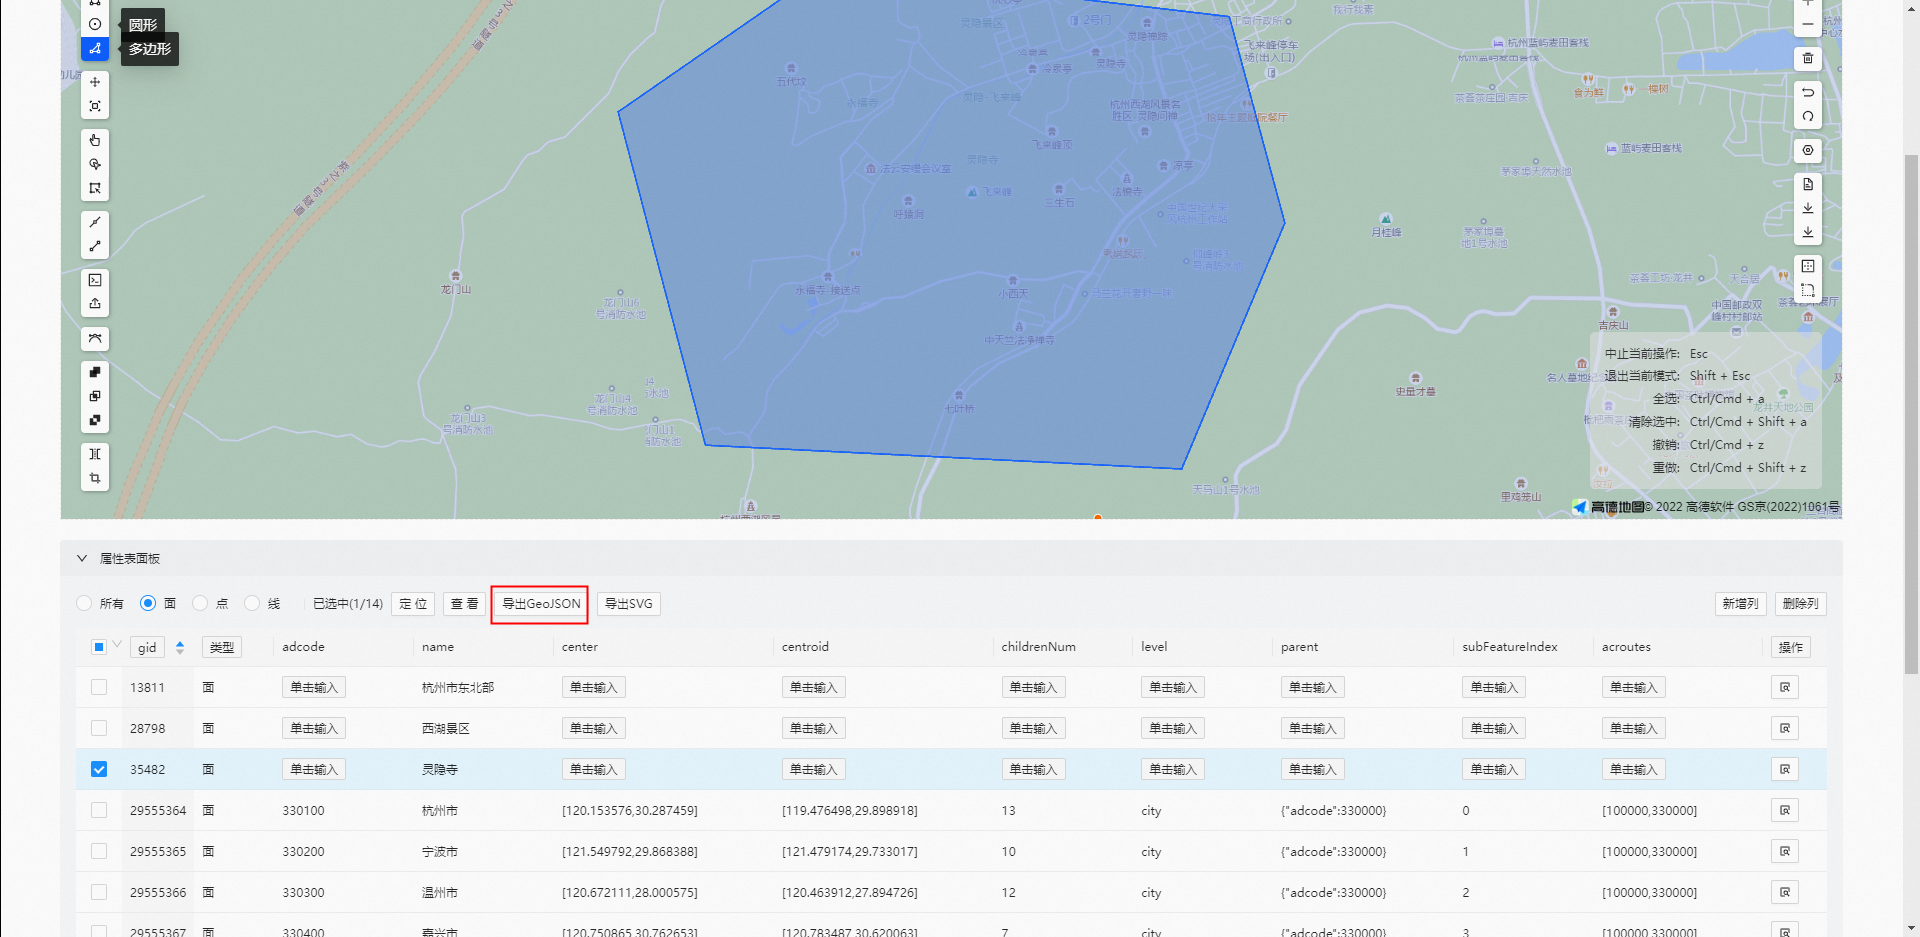
namefield to Lingyin Temple.In the property table panel, select each area and click Export GeoJSON. Export the GeoJSON files for Hangzhou City, Northeastern Hangzhou, West Lake Scenic Area, and Lingyin Temple to your computer.
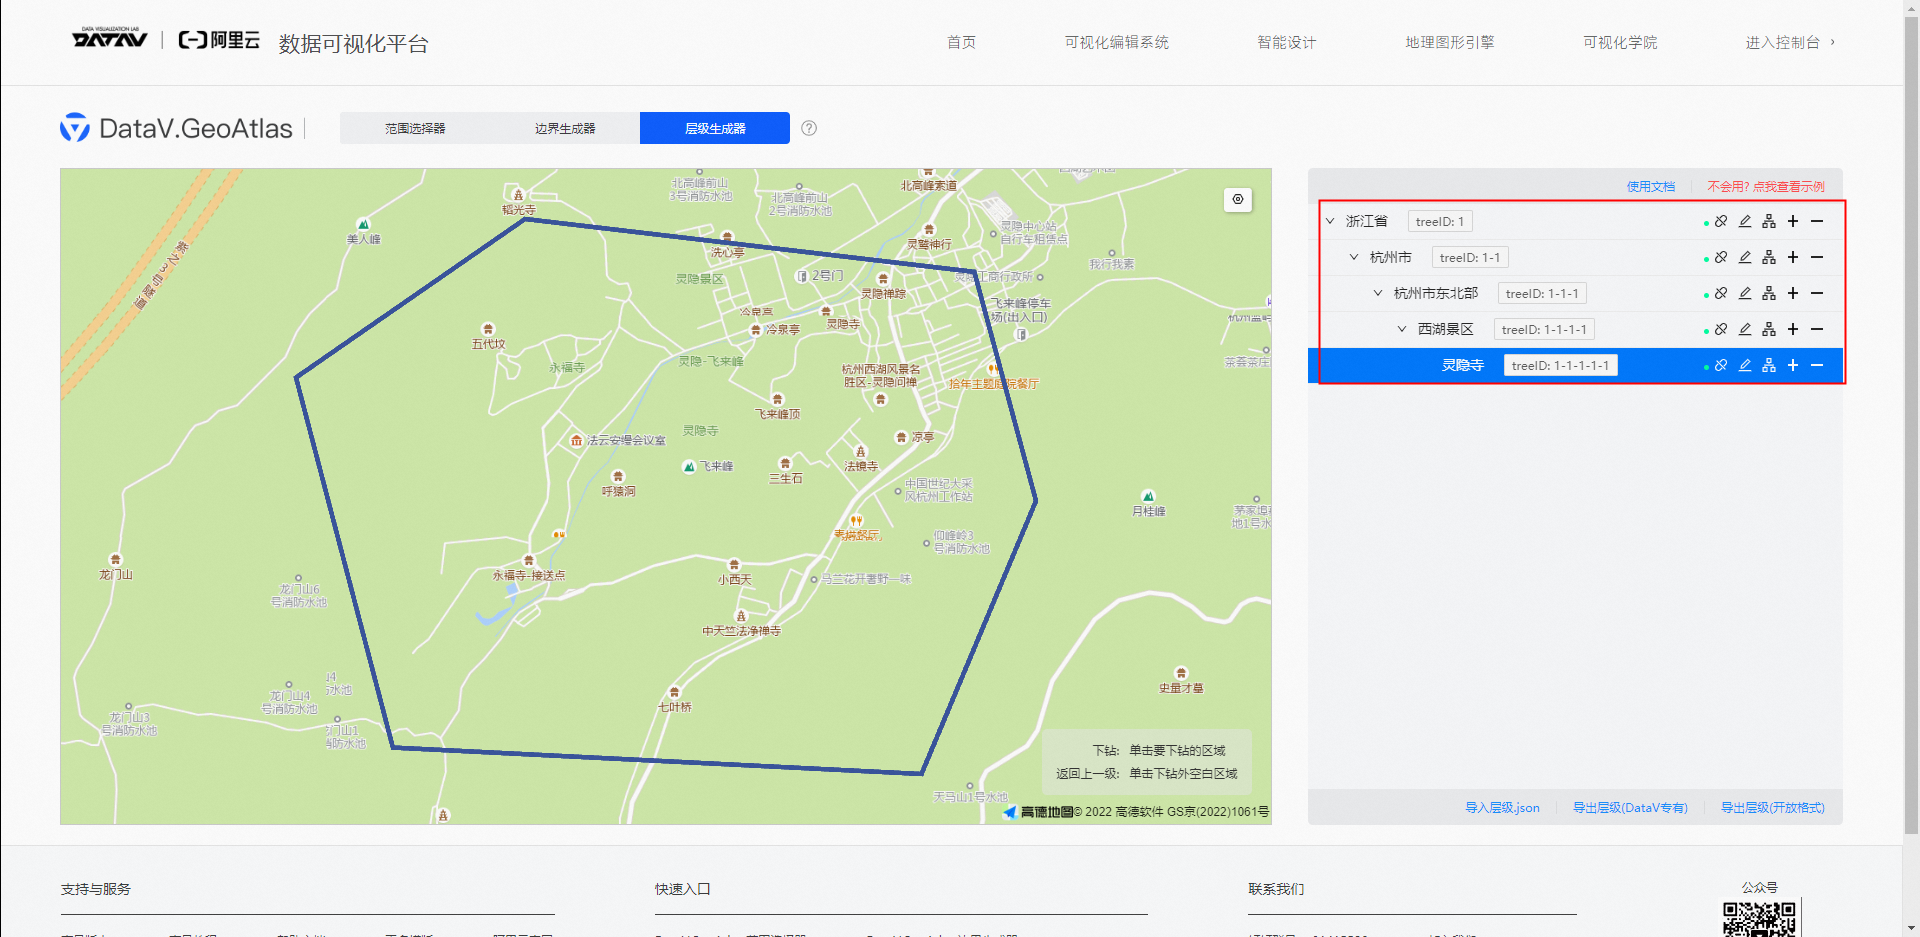
Select Hierarchy Generator. For more information, see Hierarchy tree panel features. Attach the GeoJSON files for Zhejiang Province, Hangzhou City, Northeastern Hangzhou, West Lake Scenic Area, and Lingyin Temple to the hierarchy nodes in the correct order.
Click Export Hierarchy (DataV Only) to save the created hierarchy data to your computer.
Select the Custom Area Drill-down Layer. On its Data panel, in the Custom TopoJSON Data API section, click Configure Data Source.
Set Data Source Type to Static Data.
Open the hierarchy file that you downloaded from the geo-tool. Copy its content and paste it into the data entry window.
To the right of the data response result, click the
icon to refresh the result.In the upper-right corner, click the Preview
icon to preview the configuration. Double-click an area to drill down. Double-click an unselected area to roll back.
 icon to save the Zhejiang Province map JSON file to your computer.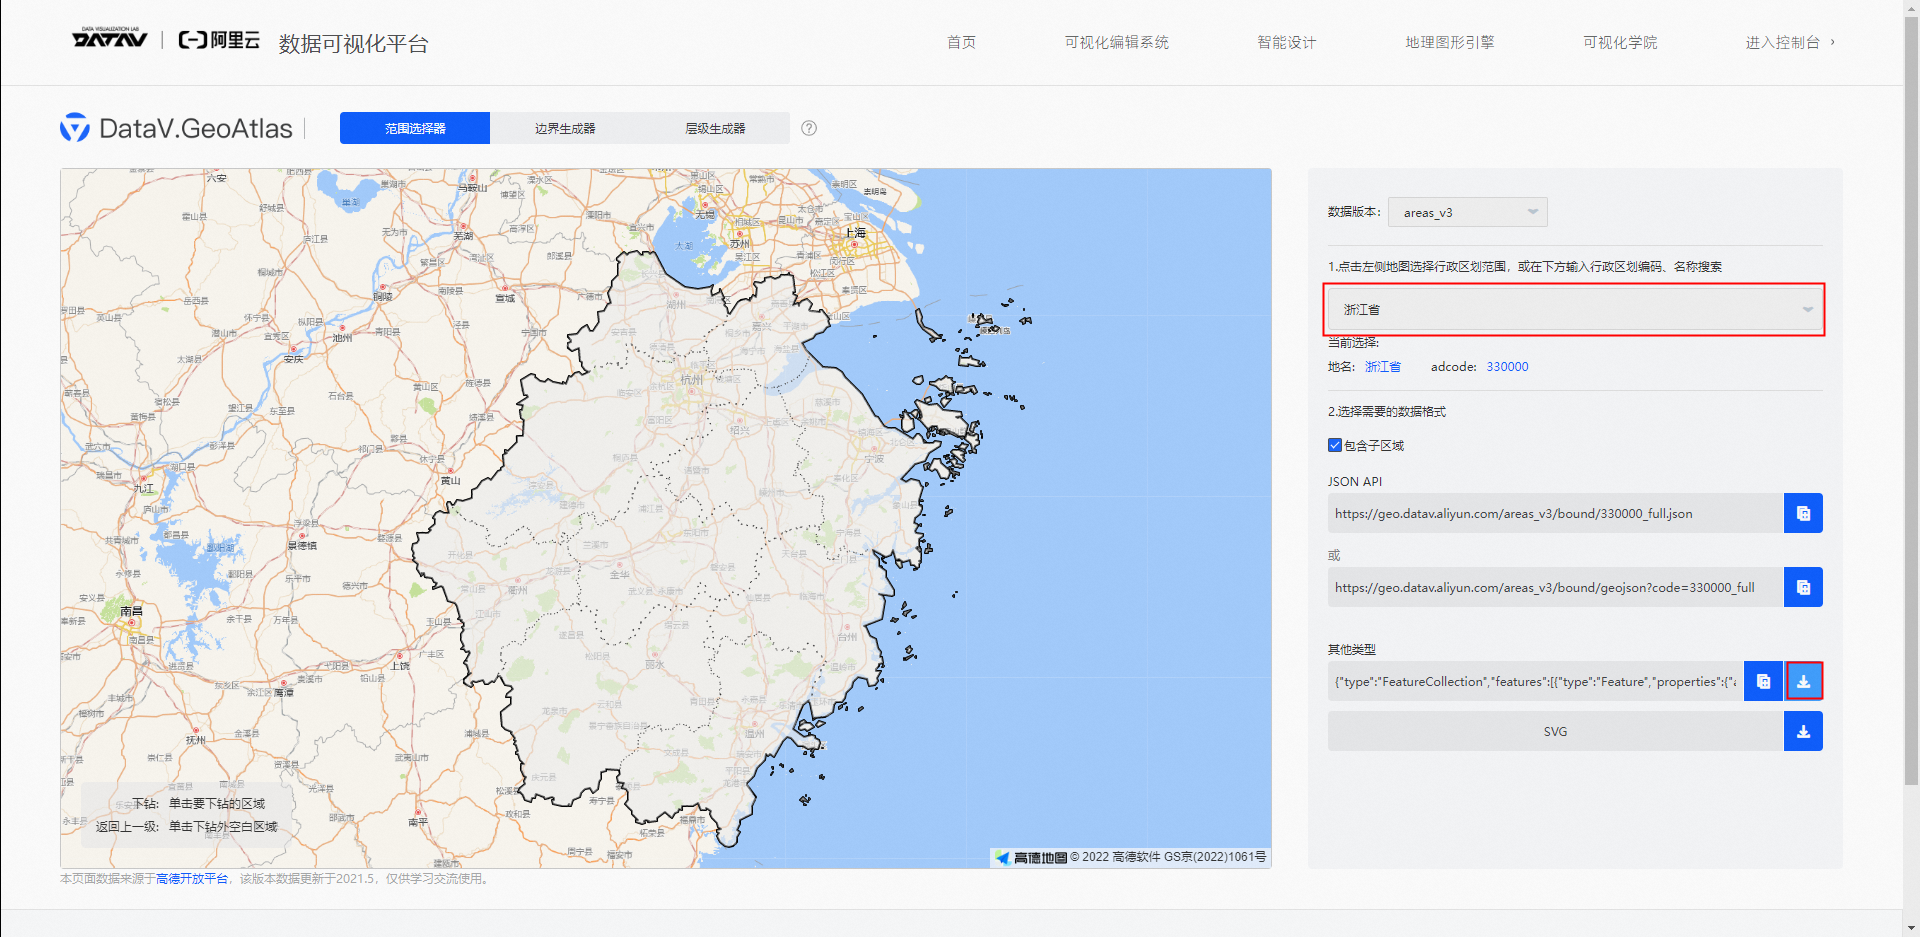
 icon to import the saved JSON file.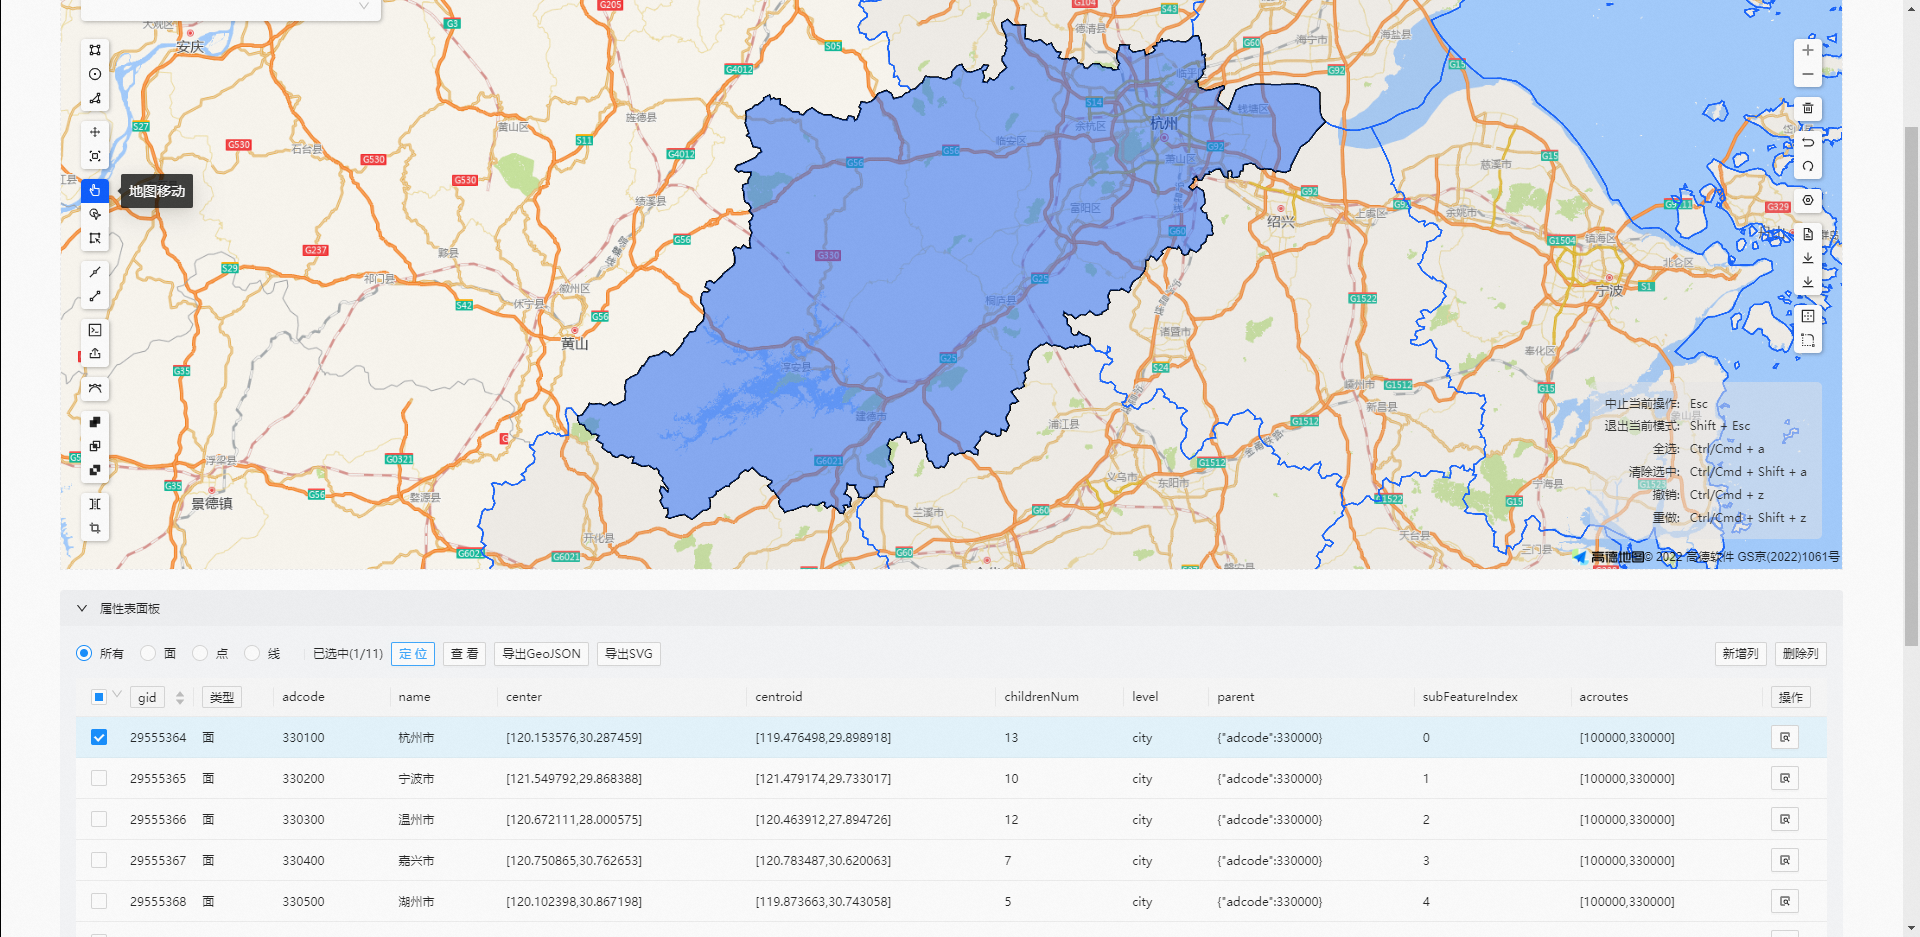
 icon. Use the circular area tool to select the northeastern part of Hangzhou City. Change the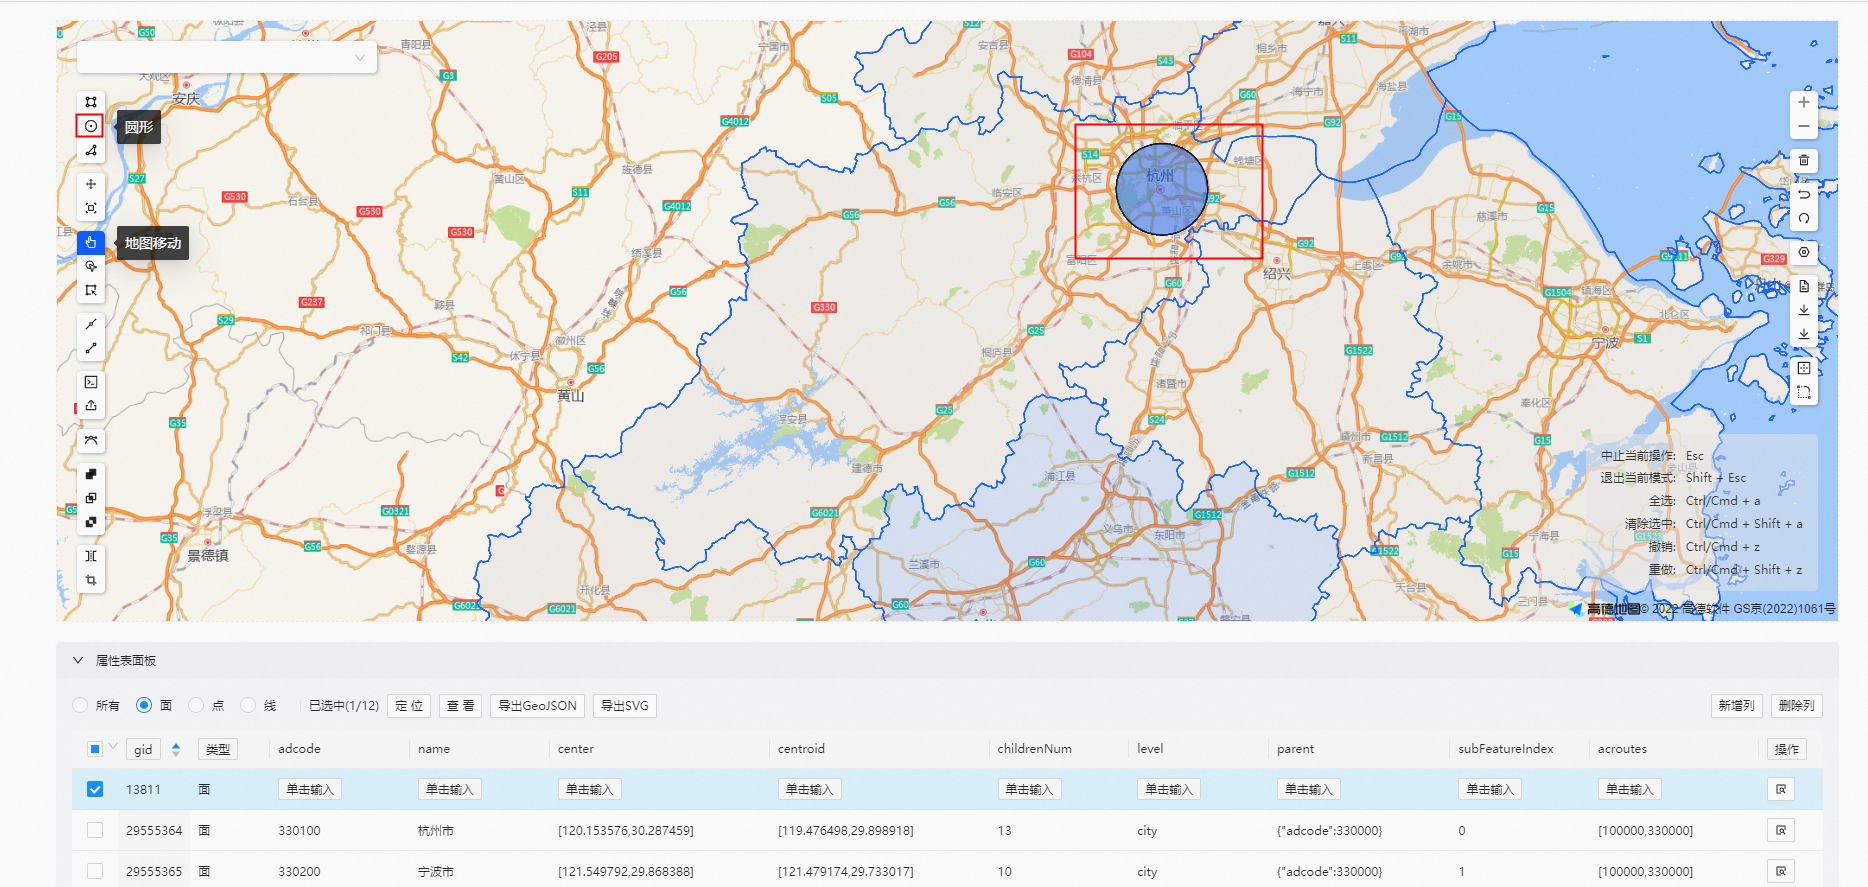
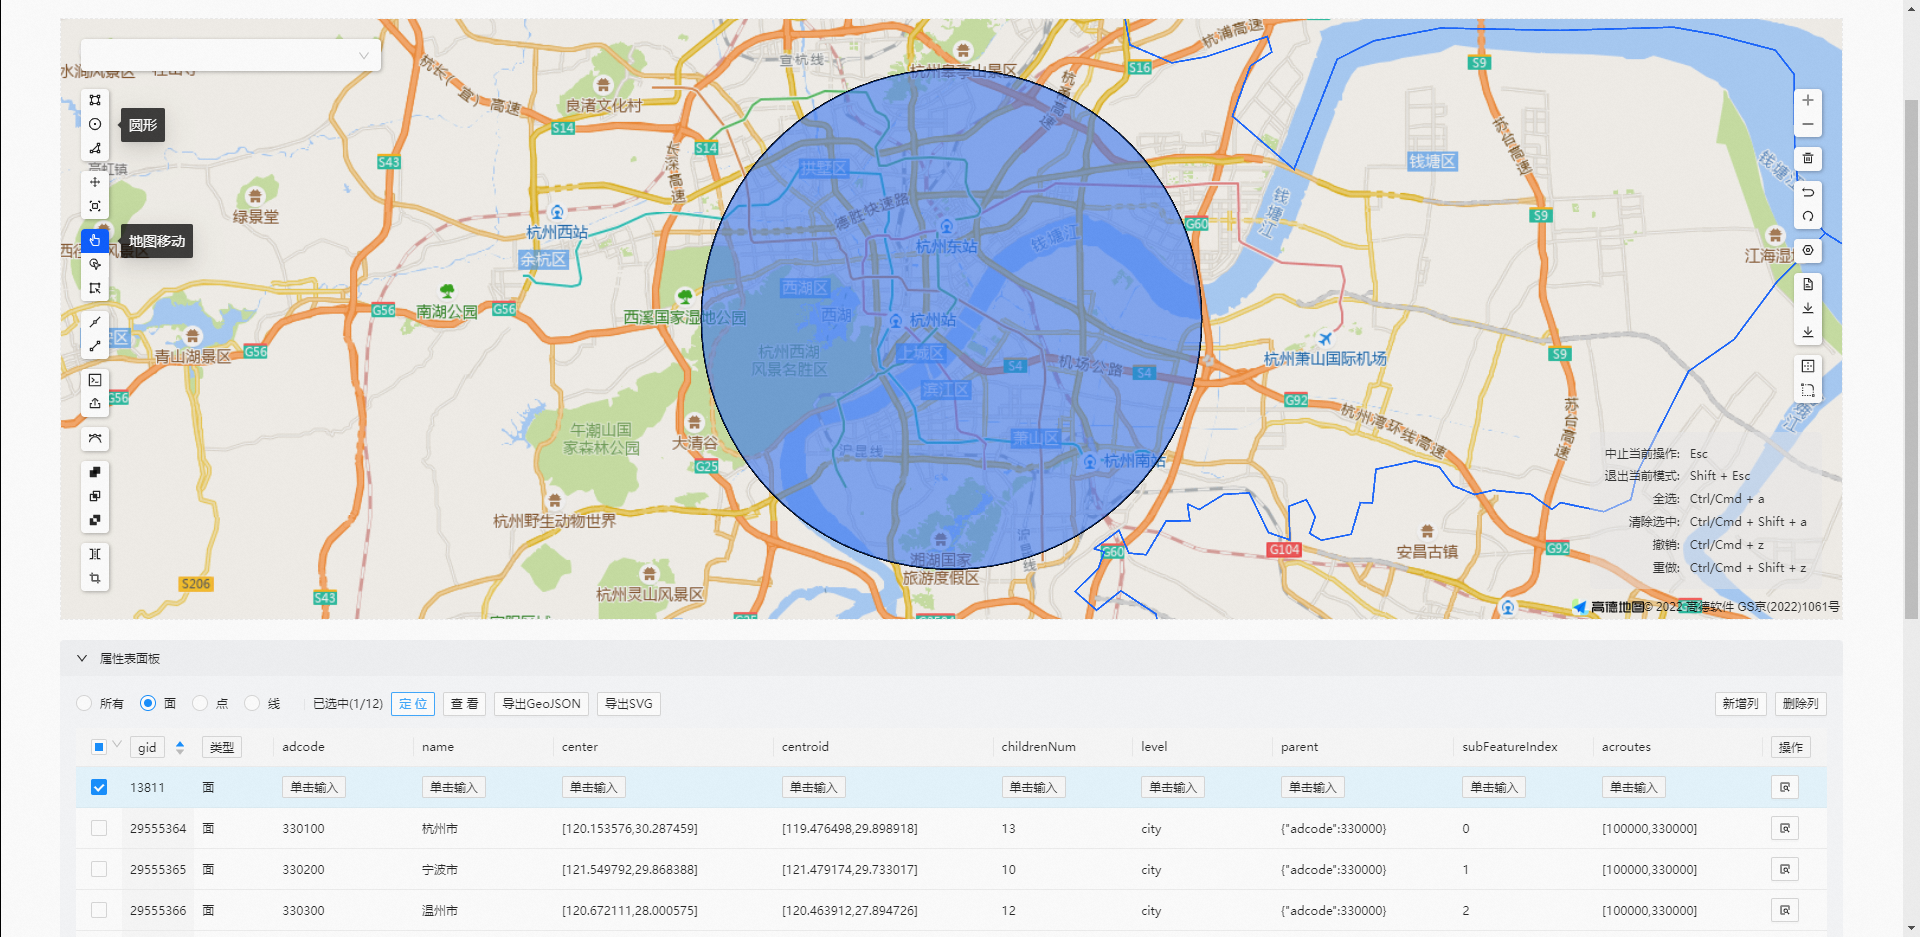
 icon. Use the polygon tool to draw a border around the Hangzhou West Lake Scenic Area. Change the