Description
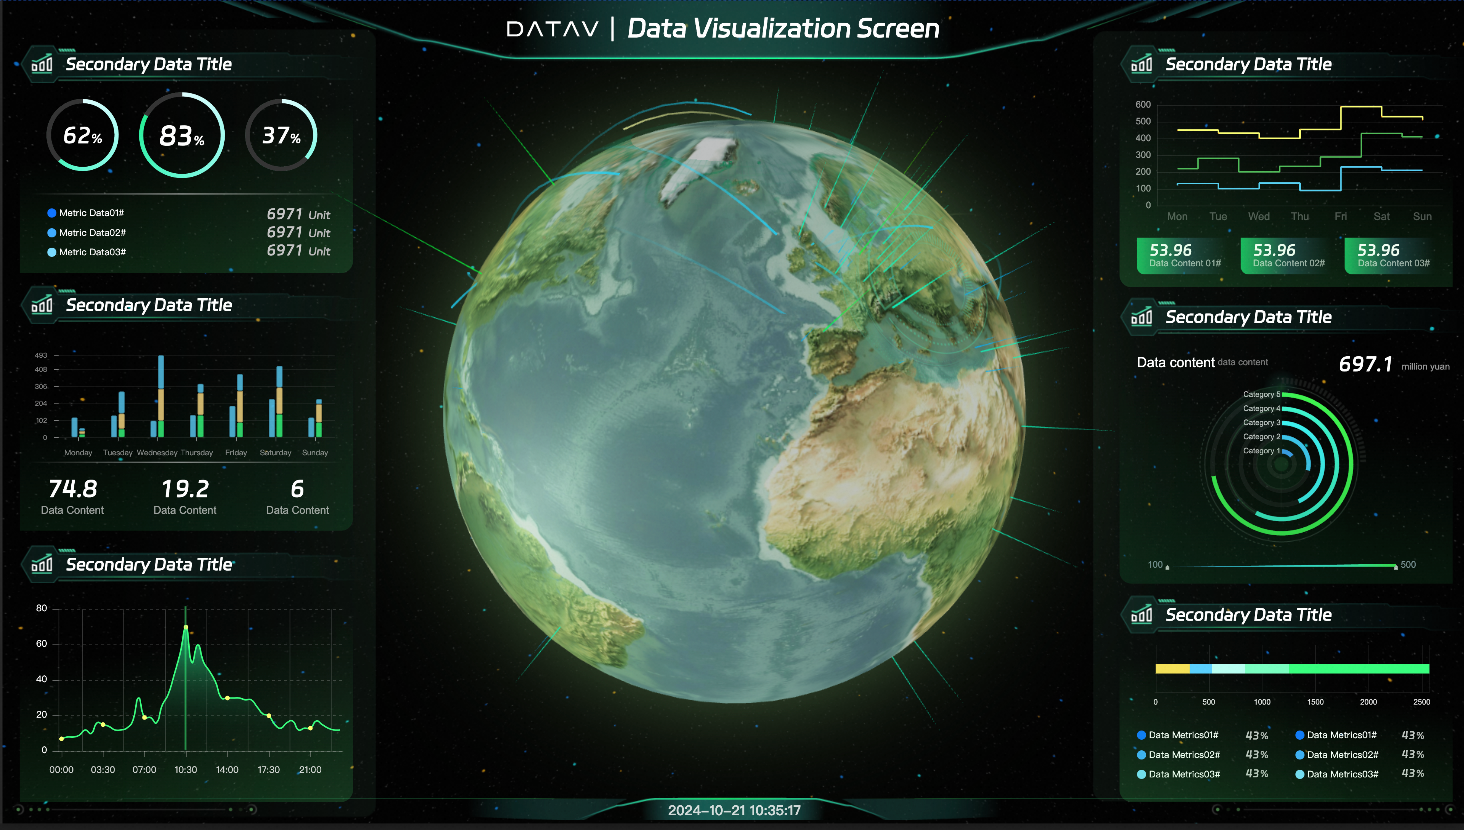
Build a visualization dashboard from a DataV-Board template. This topic uses the Emerald Green Earth General Template as an example.
Background information
-
This topic uses Static Data as an example. You can paste prepared data directly in the widget data source configuration area. If your data source is a CSV File, Database, or another type, add a data source first.
-
If you use an API as your data source, enter the API directly in the data source configuration bar. For details such as whether to select Server Proxy Request, see How to configure cross-domain data.
Operation flow
Complete the following steps to create the Emerald Green Earth General dashboard and explore DataV-Board features.
Step 1: Create a dashboard
Create a visualization dashboard from a template.
-
Log on to the DataV-Board console.
-
On the Workspace page, move your mouse over Create PC Dashboard, and click +Select Template.
-
Select a suitable template (for example: Emerald Green Earth General Template), hover your mouse over the template, and click the Create Dashboard button that appears.
-
In the Create Dashboard dialog box, enter a dashboard name and select a project group. If you have not created a group, you can select Ungrouped.
-
Click Create Dashboard.
After the dashboard is created successfully, you will be redirected to the canvas editor page, where you can see a well-designed template for displaying geographic information data.
Step 2: Configure widget styles
Modify widget styles after creating the dashboard.
-
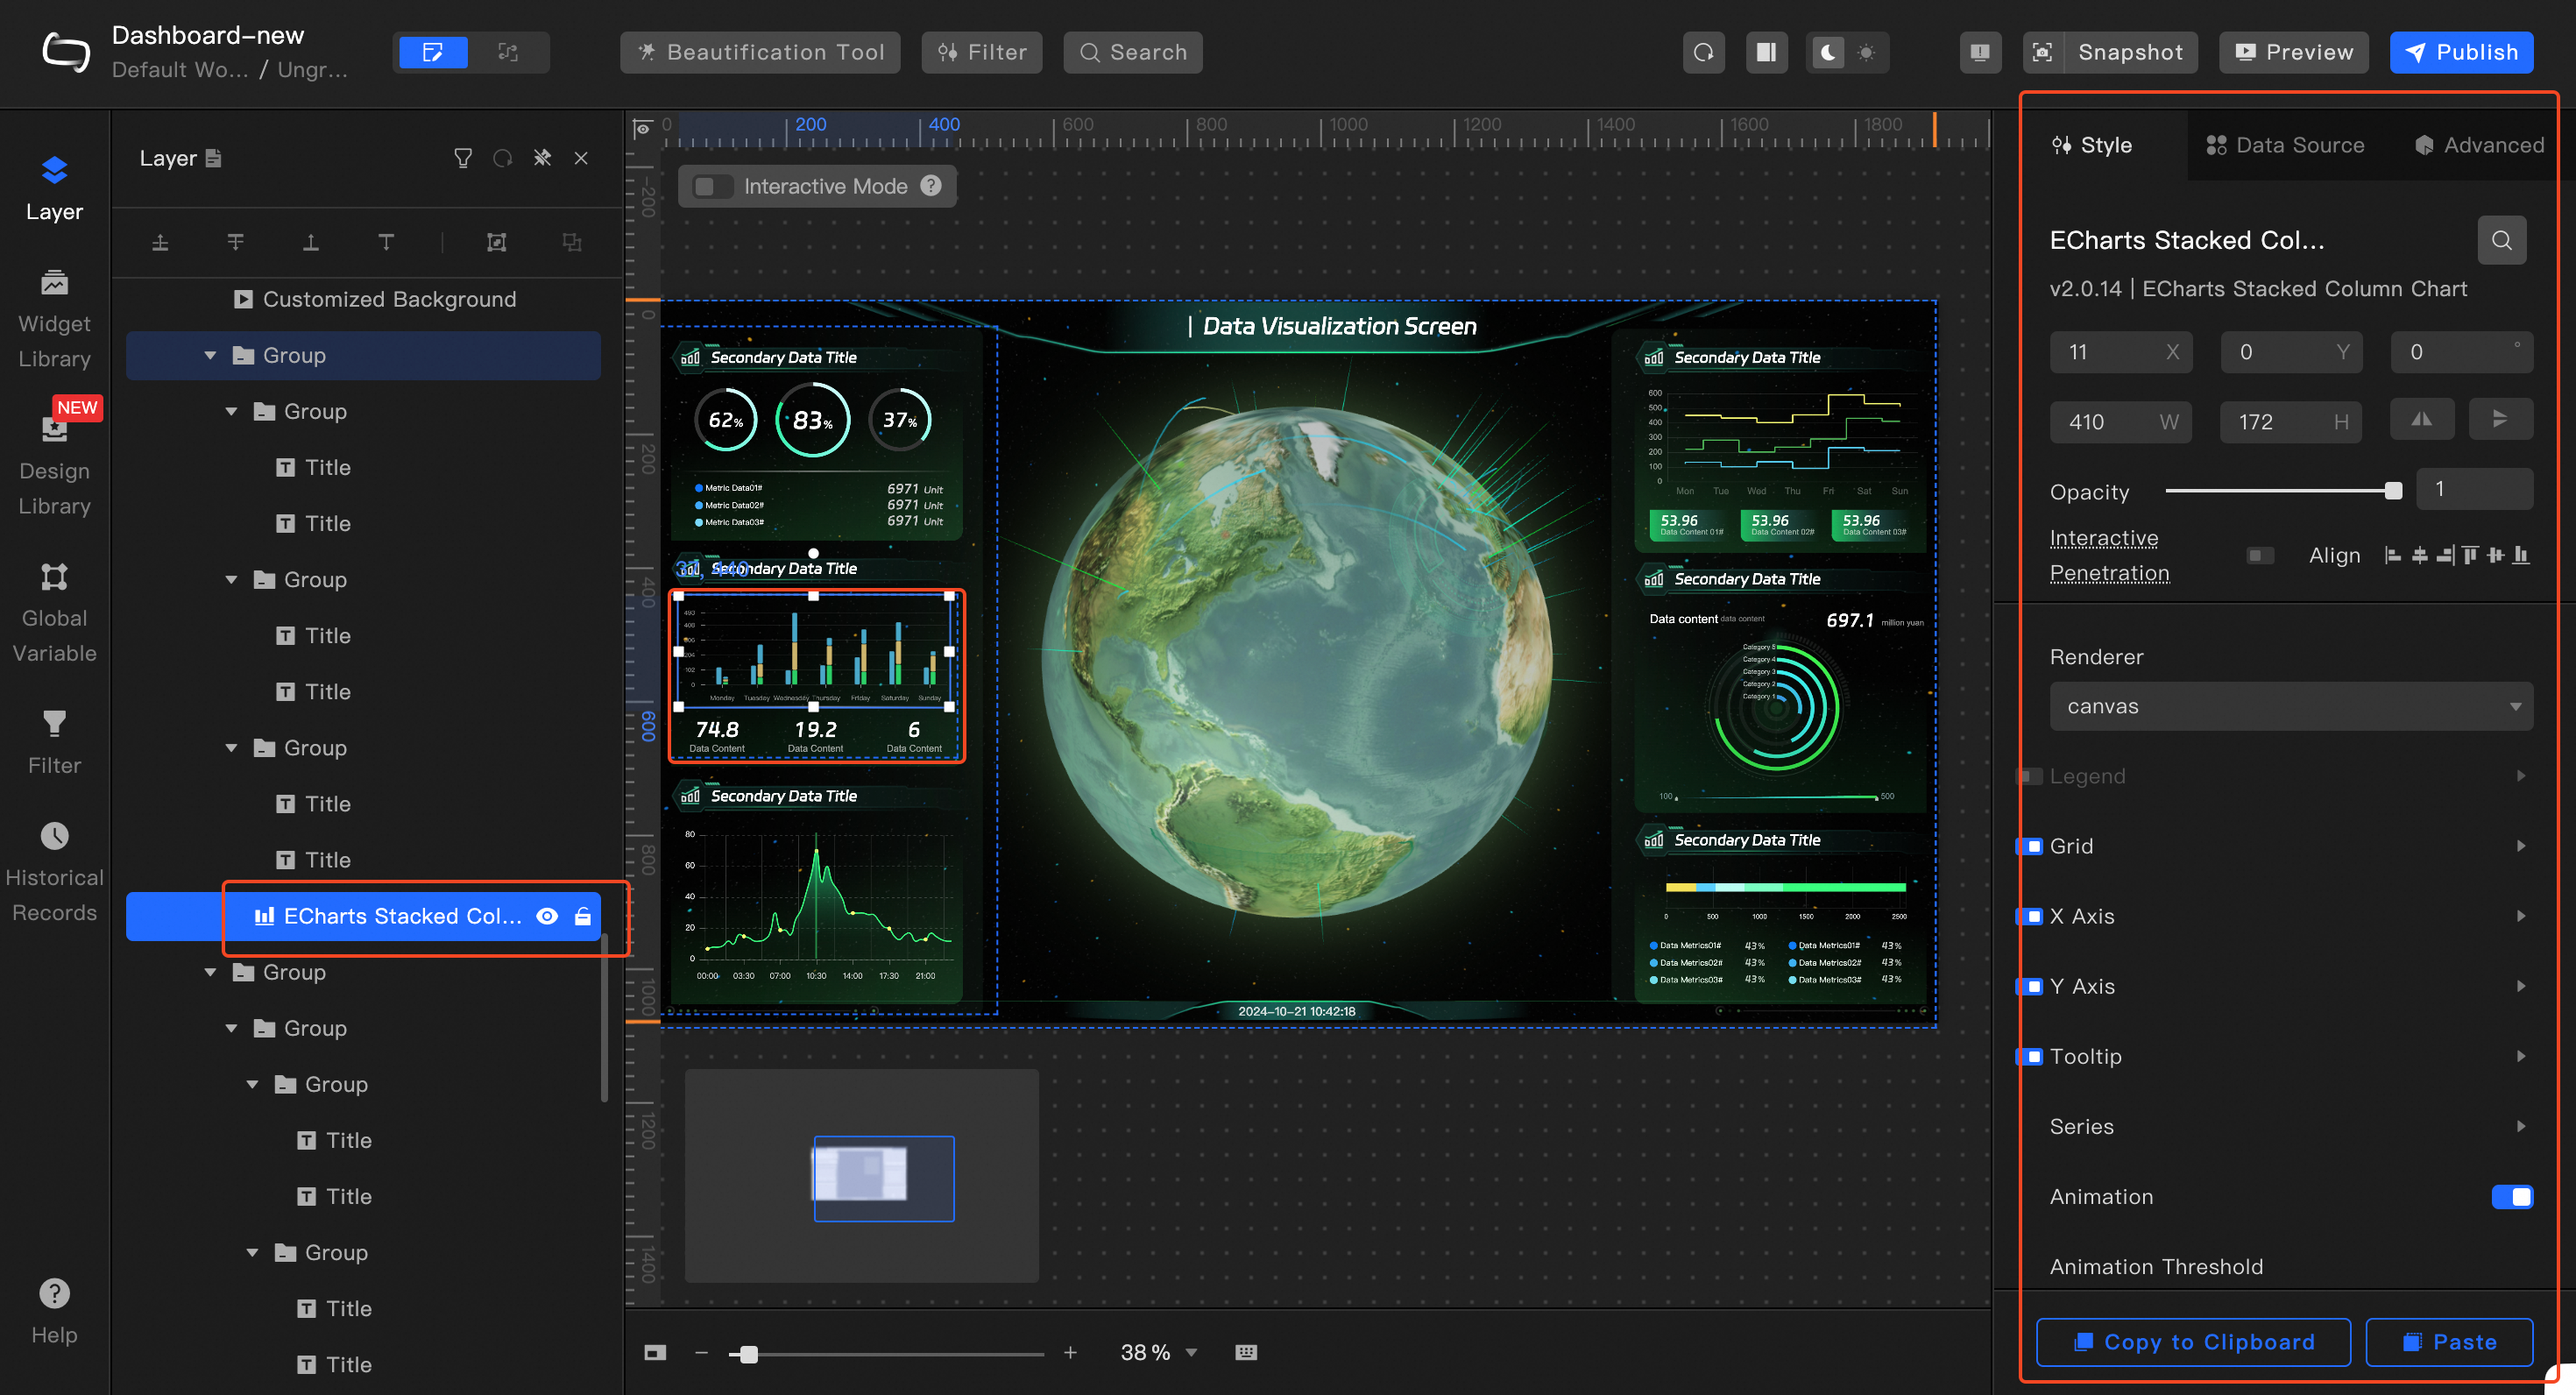
Click a widget in the Layers panel on the left, and then adjust its style configuration through the style panel on the right.
 Note
NoteYou can double-click the widget name in the canvas editor layer to rename the current widget.
-
Use the same method to adjust the configuration of other widgets according to your requirements.
Step 3: Adapt widget data
Replace the template data in each widget with your own data.
-
In the layers panel on the left, click to select a widget. For example: ECharts Basic Line Chart.
-
In the style panel on the right, select the Data Source tab, and select Data Source Type as Static Data.
-
In the data configuration area below, modify the existing template data according to your requirements, or paste prepared JSON format data.
NoteThe field names when adding data must be consistent with the system settings.
-
After the data configuration is complete, you can click the Data Response Results
 icon to refresh the data response result.
 -
Use the same method to configure the data for all widgets in the dashboard.
Step 4: Preview and publish the dashboard
Preview and publish the dashboard after configuring widget styles and data sources.
-
Click Preview in the upper right corner of the canvas editor to jump to a new page to preview the dashboard.
After the preview is successful, you can publish the dashboard by following these steps.
-
Click Publish in the upper right corner of the canvas editor, and in the dialog box that appears, click Publish Dashboard to open the publish page.
-
On the publish page, click the Share Link and then click the Copy icon
 on the right.Note
On the publish page, you can manage publication information and snapshots as needed.
-
Open a browser, paste the copied link into the address bar, and you can view the successfully published dashboard online.