Yida is a low-code application building platform developed by Alibaba. It lets you quickly build data applications by dragging and dropping elements. This topic describes how to add and use a Yida data source in DataV and explains its parameter settings.
Prerequisites
You have logged on to the Yida console with a DingTalk account and created a Yida data form.
Background information
Data calls to a Yida data source follow the principle of least privilege. When DataV calls the data source, an account can only access form data from applications that it created in Yida. The account cannot access form data created by other accounts.
Limits
This feature is available only in DataV Enterprise Edition and later versions.
Add a Yida data source
Access the DataV console.
On the Workbench page, click . The Data Source page opens. Click New Data Source.
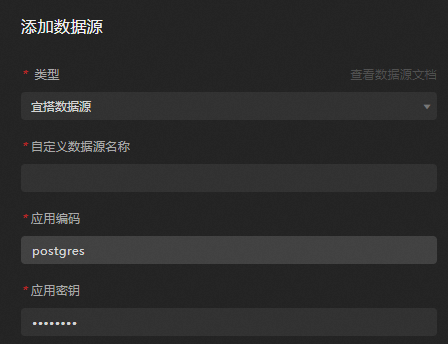
In the Add Data Source dialog box, you can set Type to Yida Data Source.
Enter the information for the Yida data source.
Parameter
Description
Custom Data Source Name
(Required) The display name of the data source.
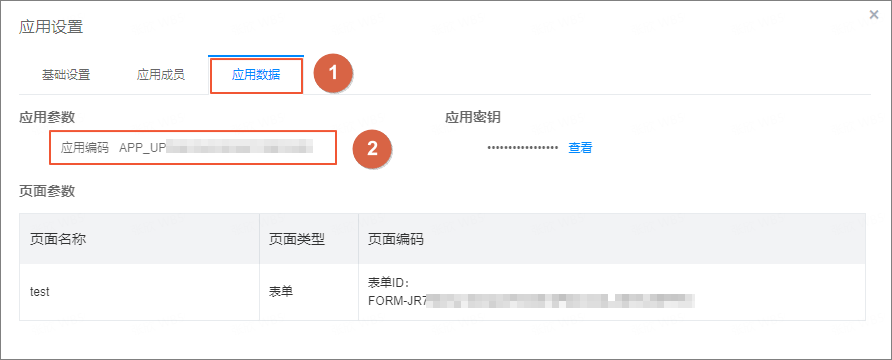
Application encoding
Required. The application code for a form created in the Yida application platform.
In the Application Settings of your Yida application, obtain the application code from the Application Data tab, as shown in the following figure.
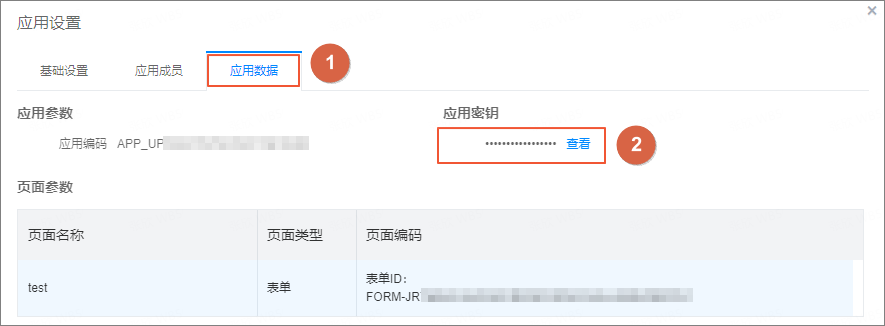
Application Key
Required. The application key for the form created in the Yida application platform.
In Application Settings for the Yida application, get the application key from the Application Data tab, as shown in the figure below.
After entering the information, click OK to add the data source.
The new data source appears in the data source list.
Use a Yida data source
The following steps show how to connect a Yida data source to a widget, using a column chart as an example.
Access the DataV console.
On the Workbench page, hover over the dashboard that you want to edit and click Edit.
NoteIf you have not created any dashboards on the Workbench page, first create a dashboard.
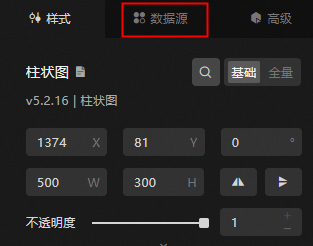
In the canvas editor, click a widget on the canvas. This example uses a column chart.
NoteIf there are no widgets on the canvas, add a widget first.
-
In the widget configuration panel on the right, select Data Source.
In the Set Data Source section, set Data Source Type to Yida Data Source.
Select a configured Yida data source from the Select Existing Data Source list.
On the right side of the page, click Data Config to open the data configuration dialog box for the chart. From the Select Dataset list, select the target dataset. The field list is then automatically populated with all fields from the selected dataset.
Drag the data fields to the field mapping area on the right and match them with the corresponding chart fields to complete the data mapping configuration.
Optional: Below the data mapping, you can configure data sorting (ascending or descending) and data screening based on the data fields.
After completing the configuration, you can view the response data in the View Data Response section on the left.
After you complete the data mapping, you can preview the chart style and data in real time in the canvas editor.
What to do next
After you obtain the raw data, see Configure a widget data source to adapt the data for your widgets.
FAQ
For more information, see FAQ about data source configuration and usage.