The data editor is a tool for editing and managing geographic data. This topic provides a detailed description of the data editor's features.
Accessing the data editor
Go to the DataV.GeoAtlas Geo-Toolkit series and open the Data Editor page.
Interface overview
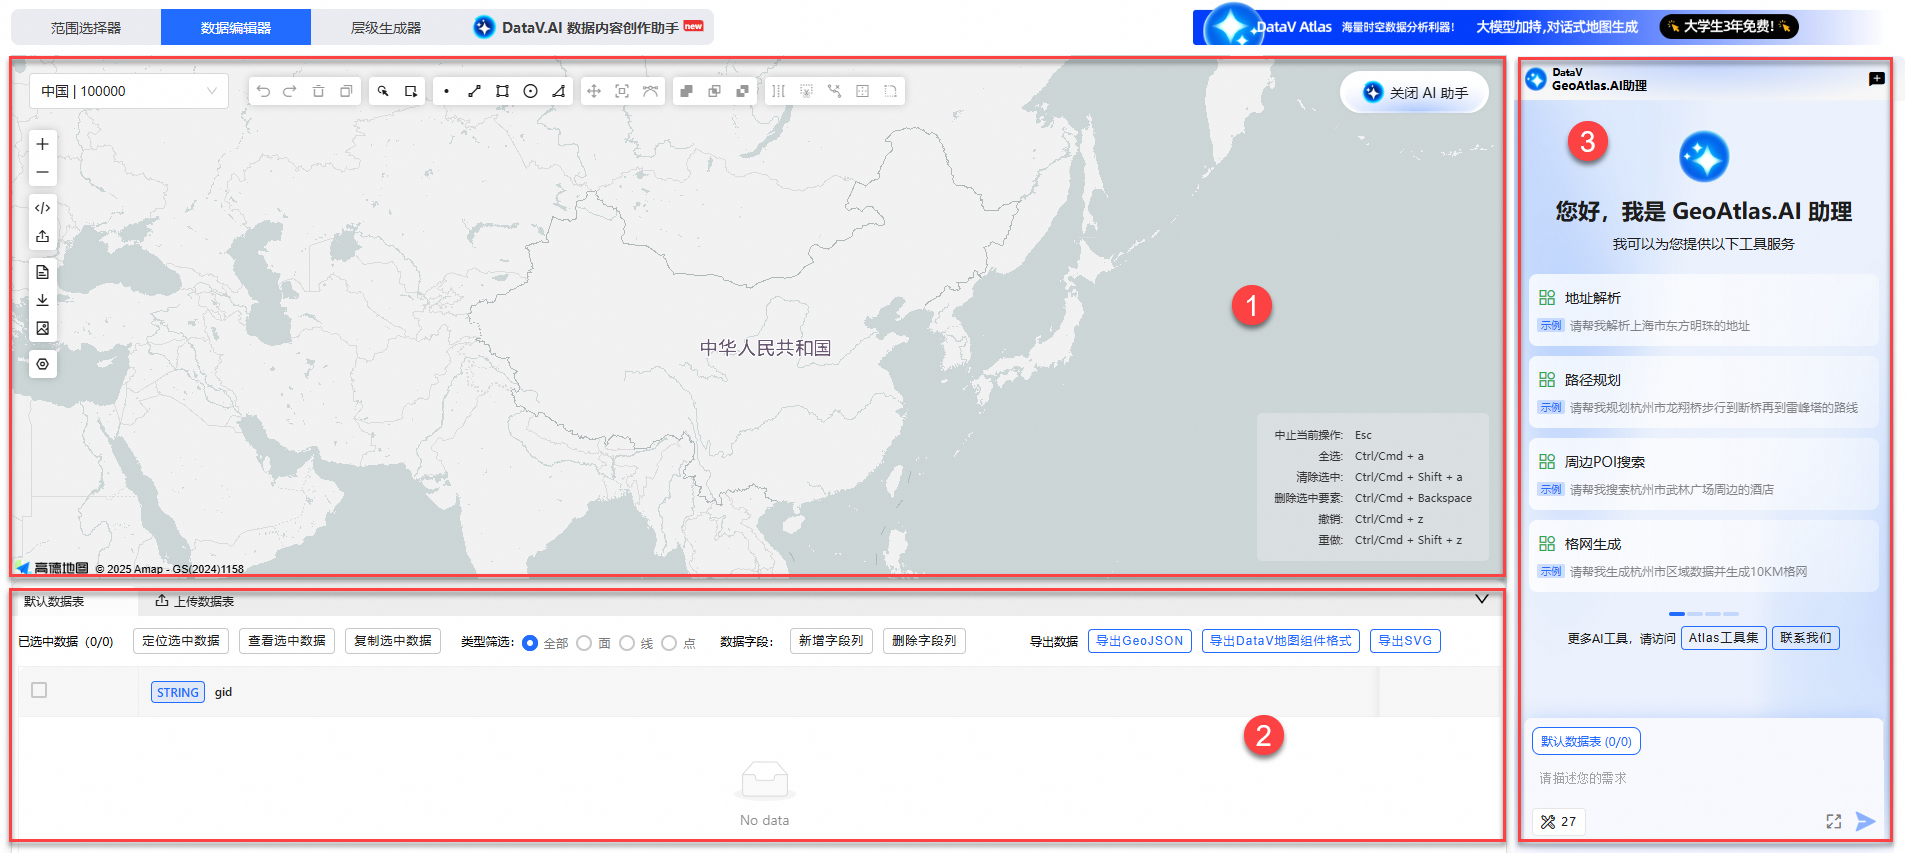
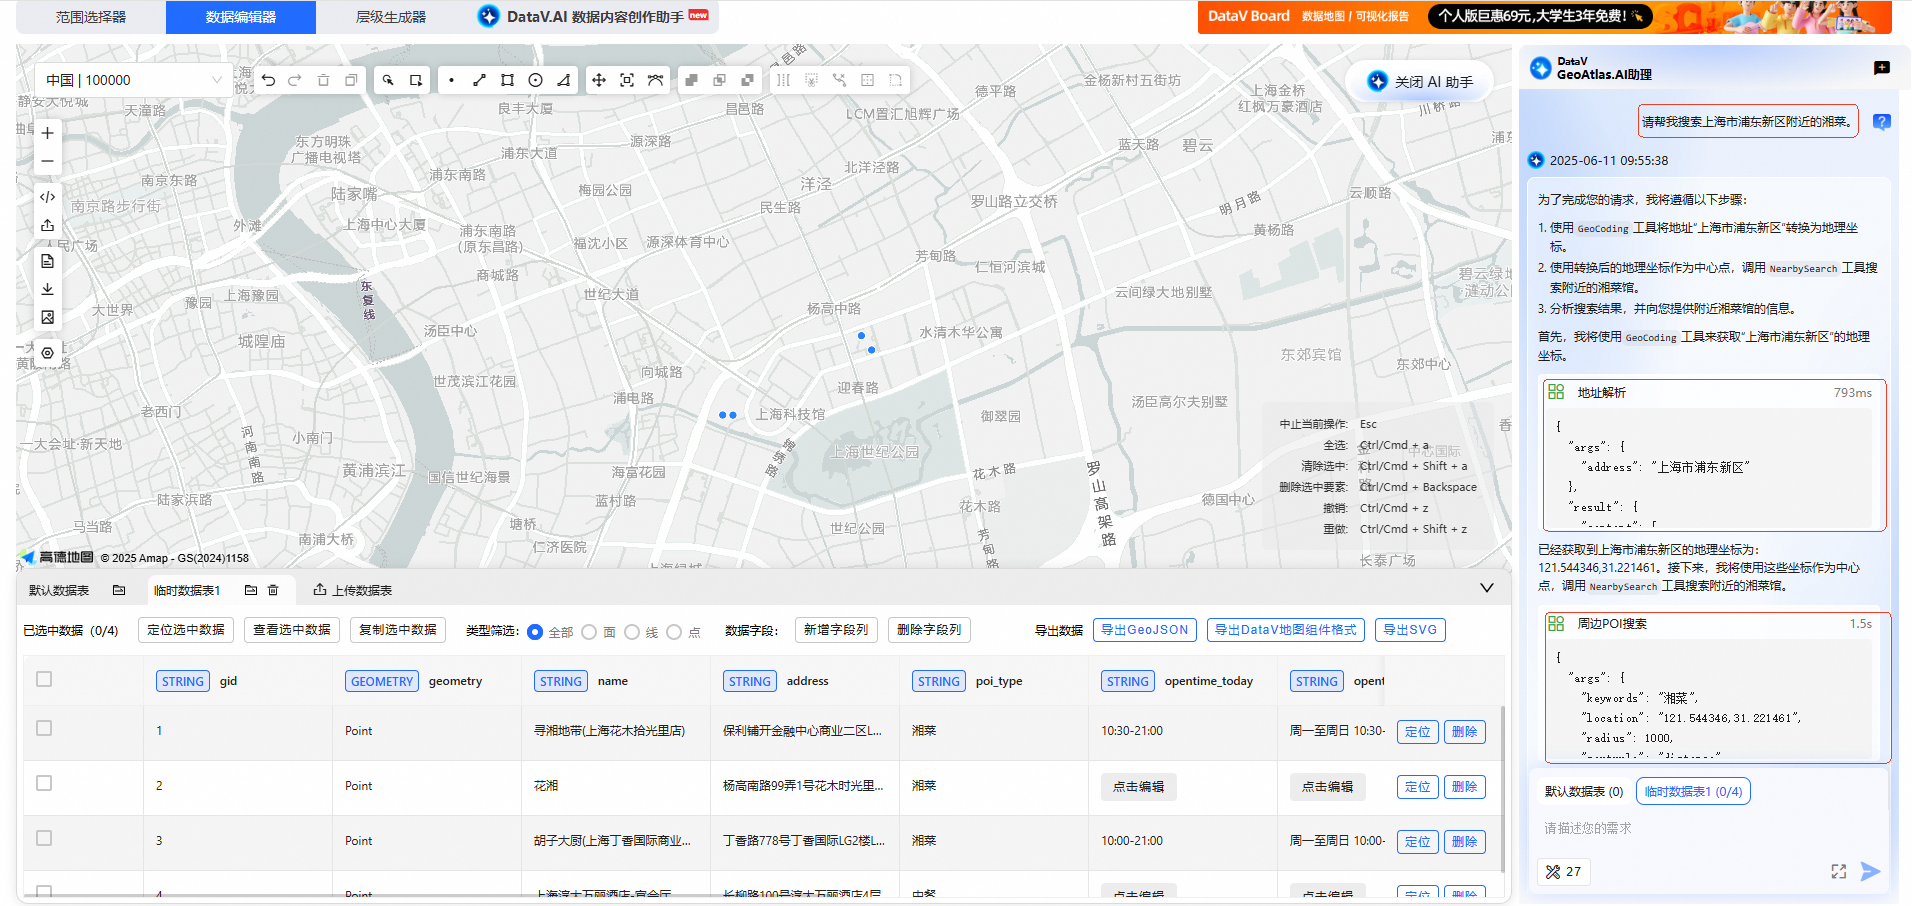
The data editor page has three main panels: the Map Panel, the Data Table Panel, and GeoAtlas Copilot.
No. |
Name |
Description |
1 |
The Map Panel is the core interface of the data editor. It combines map browsing with geometry editing. Its top and left toolbars create an efficient user experience. |
|
2 |
The Data Table Panel is the core management interface. It provides end-to-end data processing, from upload and editing to export. It supports various geographic data formats for import and standardized output. The structured design helps you manage and work with geographic data efficiently. |
|
3 |
GeoAtlas Copilot is a built-in smart tool. It uses natural language to help you complete map tasks quickly. These tasks include route planning, location queries, data simulation, and analysis. This greatly improves your efficiency. |
Map panel
The Map Panel has two toolbars. The top toolbar is for editing map features. The left toolbar is for viewing and exporting data. This design, along with global keyboard shortcuts, allows for efficient visual editing and data management.
Top toolbar

Function |
Description |
Select map area |
The left side of the toolbar has a smart area locator. You can select from a drop-down list or search by keyword for Chinese administrative regions, down to the county level. This allows for precise and fast map positioning. |
Undo and redo |
Click the
Note
The undo and redo buttons are active only when there is an edit history. Otherwise, they are disabled. |
Delete |
Delete single or multiple data items. Select data by clicking or drawing a box, then click the |
Copy |
Select data by clicking or drawing a box, then click the |
Select data |
Select data by clicking or drawing a selection box. Selected data is also highlighted in the Data Table Panel below. Press the
Note
Feature buttons such as copy, delete, merge, and intersect are enabled only when data is selected. Otherwise, they are disabled.
|
Draw feature |
Draw Point, Line, Rectangle, Circle, and Polygon features. Click an icon to start drawing. Press the |
Feature editing tools |
The feature editing tools include Translate, Rotate and Scale, and Edit Vertices. Click an icon to enter its editing mode. These tools are disabled if there is no data on the map. |
Feature spatial relationships |
These tools manage spatial relationships between features. They include Merge Geometry, Intersect Geometry, and Difference Geometry. These tools are disabled if you select fewer than two features.
Note
Same-type features are features of the same geometry class. This includes point-with-point, line-with-line, and polygon-with-polygon combinations. Polygon features include closed shapes such as rectangles, circles, and other polygons.
|
Feature processing toolset |
This toolset includes Discretize Feature, Clip Feature, Simplify Feature, Generate Random Points in Polygon, and Generate Random Points Along Line. The tools are disabled if no data is selected.
|
 icon on the right to undo the current operation. This returns you to the previous state. Click the
  icon on the right to redo the last step.
 icon. The icon is disabled if no data is selected.
 icon. A copy of the data is created at an offset from the original. The icon is disabled if no data is selected.


 icon to merge them. The features become a single entity. If they intersect, they form a new polygon.
 icon to calculate their intersection. Enable Skip points and lines to ignore any selected point and line data.
 icon to calculate their difference. Enable Skip points and lines to ignore any selected point and line data.
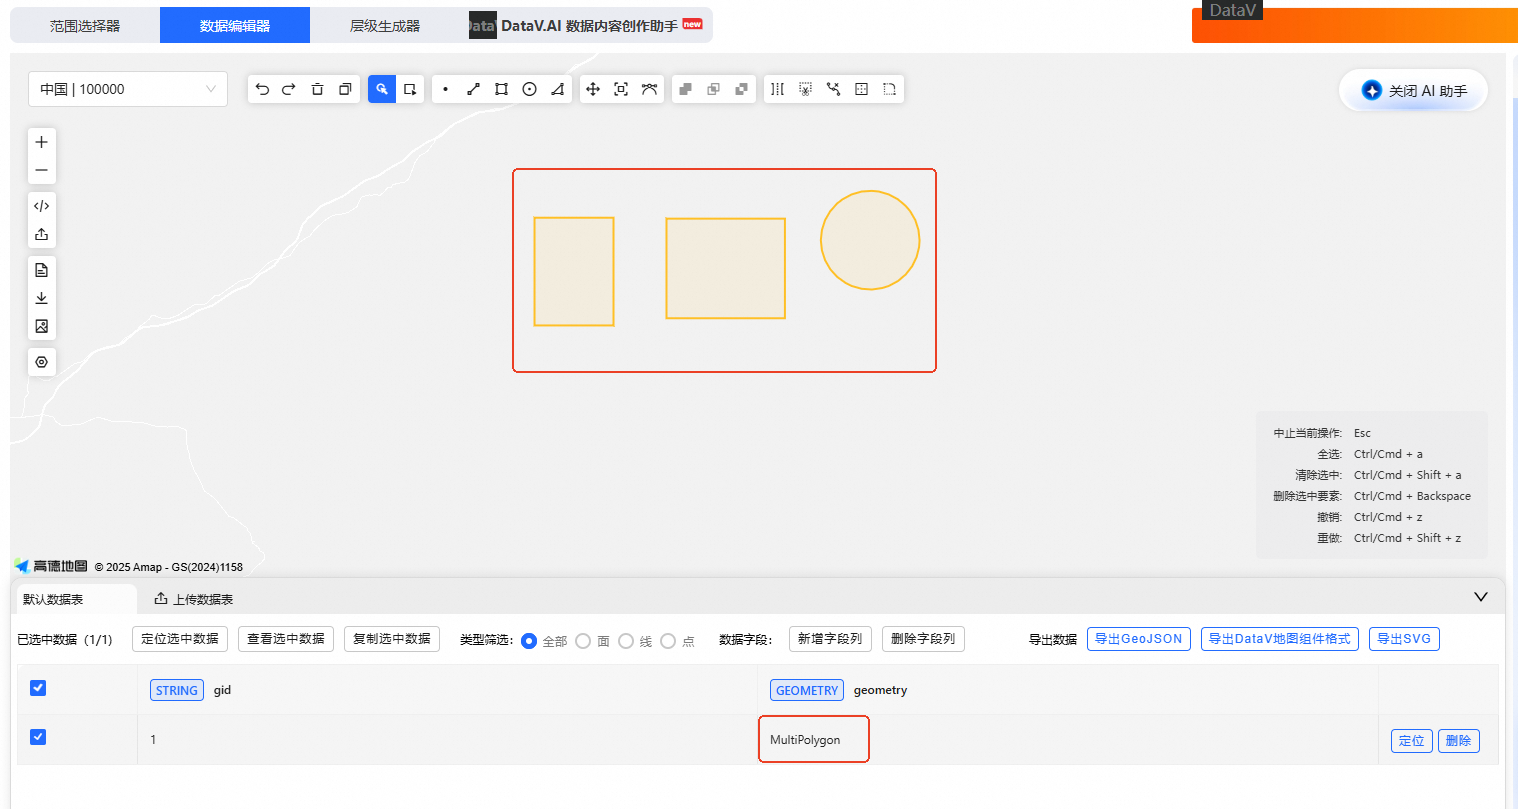
 icon. In the dialog box, select Click to draw clipping path and draw a path to clip the features. When you finish drawing, the path data appears in the input box. Click Execute to finish. The original features are split into new, separate, editable features along the path.
 icon to open a dialog box. Configure Simplification Tolerance and Simplification Quality, then click Execute.
 icon, configure the settings in the dialog box, and then click Execute.
 icon, configure the settings in the dialog box, and then click Execute.
Left toolbar

Function |
Description |
Zoom in/out map |
Click the |
Paste data |
Click the |
Import data |
Click the |
View GeoJSON |
Click the |
Export GeoJSON |
Click the |
Export SVG |
Click the |
Base map settings |
Click the |
 and
and  icons to zoom in or out on the map in the Map Panel.
 icon to import geographic data by pasting text. Supports CSV, GeoJSON, TopoJSON, WKB, WKT, and KML map data formats.
 icon to upload a geographic data file. Supports file formats such as CSV, GeoJSON, JSON, and TXT.
 icon to view GeoJSON data. You can switch data tables and filter by geometry type.
 icon, select the desired data table and geometry type, then click Download to export the data.
 icon and select the data table and geometry type to export. A real-time preview is displayed, which you can zoom using the mouse wheel. Click Download to export the file in SVG format.
 icon and select a base map style in the dialog box. Options include the default Amap Vector Basemap, Satellite Basemap, and Custom XYZ Tile Basemap. To use a custom base map, enter a standard tile URL, such as
 Map panel keyboard shortcuts
A keyboard shortcut guide is available in the lower-right corner of the Map Panel. You can use these shortcuts to perform operations quickly. The shortcuts are compatible with Windows, Linux, and macOS.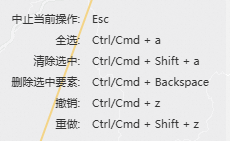
Shortcut |
Description |
Esc |
Cancel the current operation |
Ctrl/Cmd + a |
Select all features in the Map Panel |
Ctrl/Cmd + Shift + a |
Deselect features in the Map Panel |
Ctrl/Cmd + Backspace |
Delete selected features in the Map Panel |
Ctrl/Cmd + z |
Undo the last operation |
Ctrl/Cmd + Shift + z |
Redo the last undone operation |
Data panel
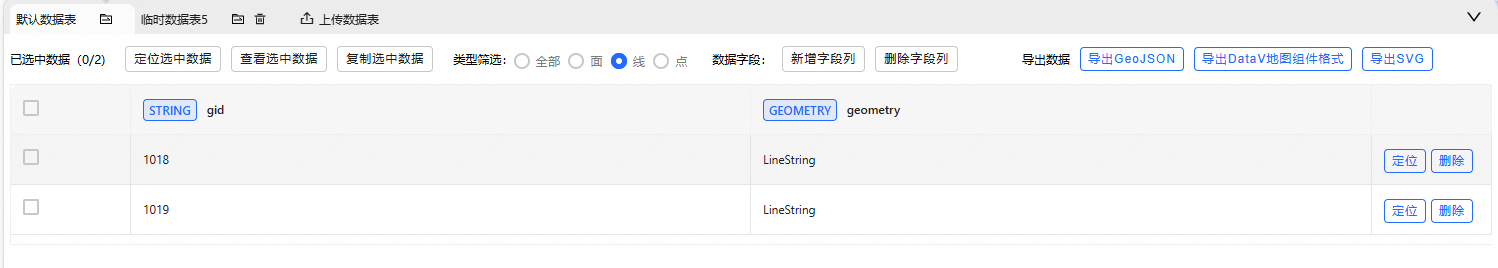
The system displays a default data table that cannot be deleted. You can also upload multiple data tables. All table data can be geolocated, imported, exported, and managed, which allows for flexible data interaction.
Click the ![]() and
and ![]() icons on the right side of the page to expand or collapse the Data Table Panel.
icons on the right side of the page to expand or collapse the Data Table Panel.
Function |
Description |
Upload data table |
Click Upload Data Table to upload a geographic data file. Supports file formats such as CSV, GeoJSON, JSON, and TXT. |
Merge data tables |
Click the |
Delete data table |
Click the
Note
The default data table cannot be deleted. |
Selected data operations |
Select single or multiple data items in the column header. After selection, you can locate, view, copy, or delete the data.
|
Type filter |
Filters the geometry types of data shown in the table and on the map. |
Data fields |
Add or delete data fields.
|
Export data |
Supports exporting table data as GeoJSON format, DataV Map Widget format, and SVG format.
Note
When you export in SVG format, a preview page opens. You can zoom the map with the mouse wheel. Click the Download button to save the SVG data to your local machine. |
Data list operations |
The data list supports data location and deletion operations.
|
 icon, select a target data table in the dialog box, and click Execute to merge. If a field conflict is detected, a prompt appears. You must confirm before the merge can proceed.
 icon, then click OK in the dialog box to delete the table.
 icon in the
 GeoAtlas Copilot
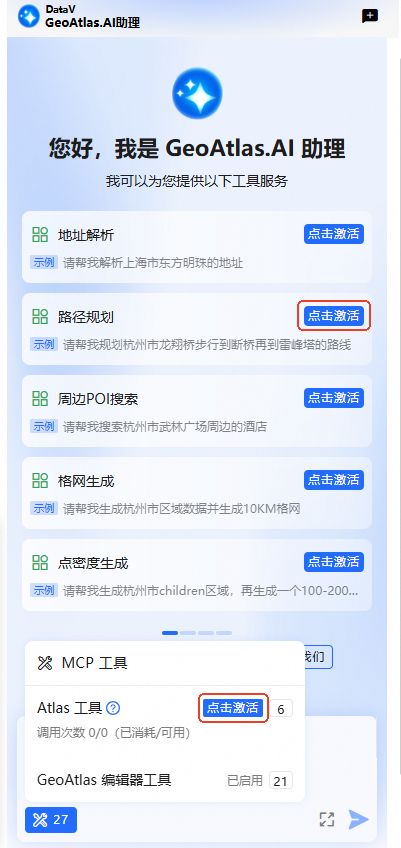
GeoAtlas Copilot is an efficient and intelligent assistant for map tools. It helps you quickly complete map-related tasks, such as finding routes, searching for locations, simulating data, and analyzing data. It is deeply integrated with the Atlas MCP tool and can automatically call functions such as path planning, Point of Interest (POI) search, and data generation. It uses a Large Language Model (LLM) to intelligently understand your requests and use MCP tools, which saves time and improves efficiency.
GeoAtlas Copilot is enabled by default when you open the data editor. You can show or hide the panel using the Copilot switch.
Click Log on to Alibaba Cloud account at the bottom of the page.
Activate the MCP tool. You can click Activate for Free next to an example prompt, or click Activate in the Toolbox in the lower-left corner. This opens the MCP token management page.

On the MCP token management page, click Create Token and Start Using Now. After the token is generated, click Activate.
NoteThe MCP token service is currently available for free to all Alibaba Cloud users.
Refresh the GeoAtlas Geo-Toolkit page. The parsing tool service for Copilot is now active.
Click a tool example or enter text in the dialog box to interact with Copilot.
In the conversation, all invoked tool services, such as address resolution and nearby POI search, are displayed visually. You can click them to view the specific data returned.
NoteIn the MCP Toolbox in the lower-left corner, the GeoAtlas editor tools are enabled by default and cannot be disabled. You can manually enable or disable tools in the Atlas MCP toolbox. Disabled services cannot be called in the conversation.
Click the
icon at the bottom of the results to rerun the last search. Click the icon to expand the input box, which is useful for entering longer text. Click the Start New Conversation button to clear the current conversation.
 icon at the bottom of the results to rerun the last search. Click the