The Level Generator is a tool for creating hierarchical data for custom drill-down areas. This topic describes its features.
Access the Level Generator
Click DataV.GeoAtlas Geo Tools to open the Level Generator page.
Interface overview
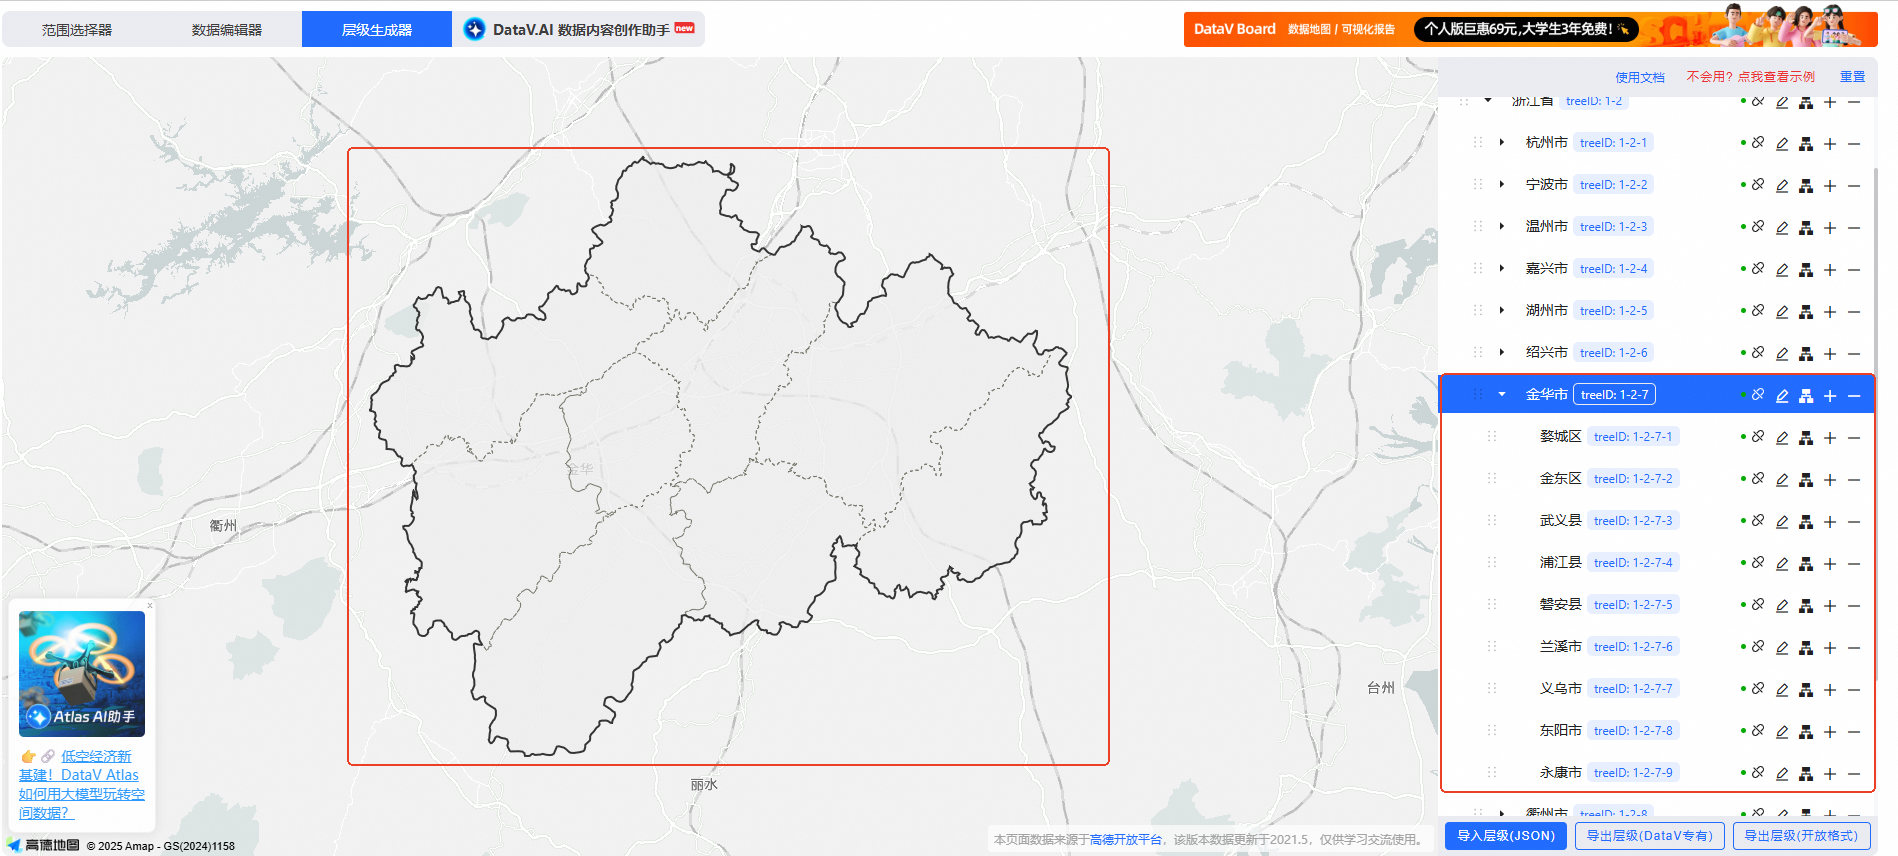
The Level Generator interface has two main panels: the map panel and the level tree panel.
The map panel on the left displays and lets you browse level data. Its interaction logic is the same as that of the range selector.
The level tree panel on the right supports operations such as viewing examples, binding data, and importing and exporting level data.
Quick start
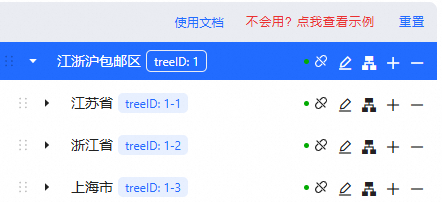
The Level Generator includes a simple example that shows the drill-down hierarchy for the administrative regions of Jiangsu, Zhejiang, and Shanghai.
Example operations:
In the upper-right corner of the level tree panel, click Don't know how? Click to view example to add the Jiangsu-Zhejiang-Shanghai area data to the panel.
Click a node title in the panel to locate the corresponding area in the map panel on the left.
NoteTo the right of each node, you can find operations such as binding or unbinding geographic data and renaming.
In the map panel on the left, click an administrative region to drill down to its sub-regions. Click outside the region to return to the parent view. When you hover over a region, its title and filter interaction style are displayed.
NoteThe map panel in the Level Generator functions similarly to the range selector.
Panel features
Map panel
Feature |
Description |
View level geographic data style |
In the map panel, a selected node is indicated by a thick, black, solid outline. Child nodes within the selected node are indicated by a light-colored dashed line. |
Drill down and drill up |
Click a sub-region to drill down. Click the empty area outside the drilled-down region to return to the parent view. |
Level tree panel
Feature |
Description |
View example |
Click Don't know how? Click to view example in the upper-right corner of the level tree panel to add the Jiangsu-Zhejiang-Shanghai area drill-down example to the panel. The example data contains the administrative region levels for Jiangsu, Zhejiang, and Shanghai, down to the district and county level. Click Reset to restore the default empty node.
Note
The example level data can be exported directly to your local machine. |
Level tree node |
In the level tree panel, each row is a level node. Each node contains five types of node information: title, treeID, geographic data, child nodes, and parent node.
Note
You can customize the title, geographic data, child nodes, and parent node. The treeID cannot be changed manually. It is automatically calculated by the level panel. |
Unbind and bind data |
|
Rename node |
Click the |
Batch import child nodes |
Click the |
Add child node |
Click the |
Delete node |
Click the
Important
When you delete a parent node, its child nodes are also deleted. The root node cannot be deleted. |
Change node level |
Select a node and drag it to adjust its level in the panel. |
Import level |
Click the Import Level (JSON) button at the bottom of the level tree panel and select a local level data file. TopoJSON format is supported. |
Export Level (DataV Proprietary) |
Click the Export Level (DataV Proprietary) button at the bottom of the level tree panel to export a level data file and a level mapping file. The geographic fields in the level data file are compressed and can be used in DataV components, such as the Basic Flat Map component. The level mapping file contains a list of mappings for node IDs, node names, and parent nodes. |
Export Level (Open Format) |
Click the Export Level (Open Format) button at the bottom of the level tree panel to export a level data file and a level mapping file. The data structure is not compressed and can be used directly in external applications. |
 icon, and then click Confirm in the pop-up window to unbind the geographic information from the current node.
 icon. In the pop-up window, select one of two types of geographic data: Administrative Region Dataset or Custom Data.
 icon to the right of the node and enter a custom name for the node.
 icon to the right of the node to batch import child node data in GeoJSON format.
 icon to the right of the node to add a new child node under the current node.
 icon to the right of the node to delete the current node.
Examples
This example shows how to create drill-down data for the Beijing-Tianjin-Hebei region. You will obtain boundary data from the Boundary Generator and combine it in the Data Editor. Then, you will bind the data in the Level Generator to build the hierarchy. Finally, you will export the data in the DataV proprietary format. You can then use this data in the Custom Area Drill-down Layer of the Basic Flat Map 4.0 component.
Generate custom data
Click DataV.GeoAtlas Geo Tools to open the Level Generator page.
In the right-hand level tree panel, click the rename icon to the right of the default Root Area node. Change the title to Beijing-Tianjin-Hebei Area.
Click the icon to add a child node to the right of the Beijing-Tianjin-Hebei Area node. Then, bind the geographic datasets for the three administrative regions: Beijing, Tianjin, and Hebei Province, and add all descendant nodes within these regions to create a tree-like level structure.
In the upper-left corner of the page, click Range Selector to open the range selector page. Separately download the data for the Beijing, Tianjin, and Hebei administrative regions. The downloaded data does not include sub-region data.

Click Data Editor at the top of the page. In the Data Editor, upload and merge the data for the Beijing, Tianjin, and Hebei administrative regions. After the data is merged, click Export GeoJSON on the right side of the map panel to download the data.
At the top of the page, click Level Generator to open its page. For the Beijing-Tianjin-Hebei Area root node, click the
icon. Then, select custom data and upload the downloaded Beijing-Tianjin-Hebei data. Click Confirm to complete the data binding.At the bottom of the level tree panel, click Export Level (DataV Proprietary) to export the level structure data file to your local machine. Upload the two generated files to your server or OSS to generate two new APIs. Alternatively, you can use the sample APIs provided by the system to configure data for the DataV component.
Use the data in a DataV component
You can configure custom drill-down data for the Beijing-Tianjin-Hebei region for a DataV component. This example uses the Basic Flat Map 4.0 component.
Access the DataV console.
On the Workbench page, select any Data Dashboard and click Edit to open the canvas editor.
NoteIf the Workbench page has no data dashboards, you must create a data dashboard first.
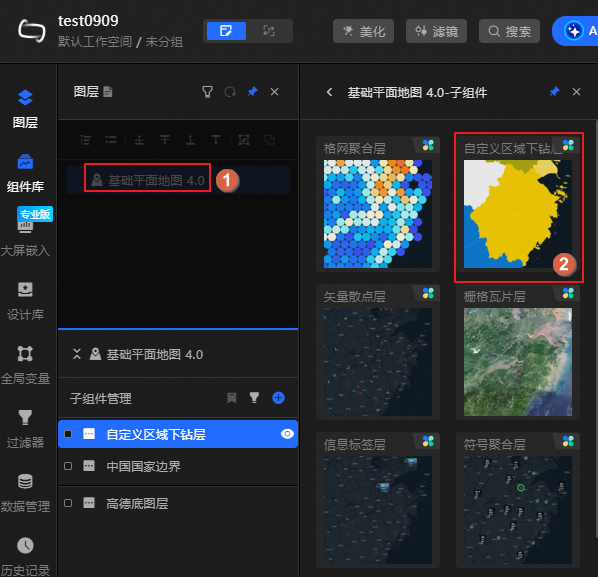
In the left navigation pane, click Component Library. The component management page opens.
Click the
icon to go to the map component list.Click the Basic Flat Map 4.0 component. In the component configuration panel, add a Custom Area Drill-down Layer sub-component.
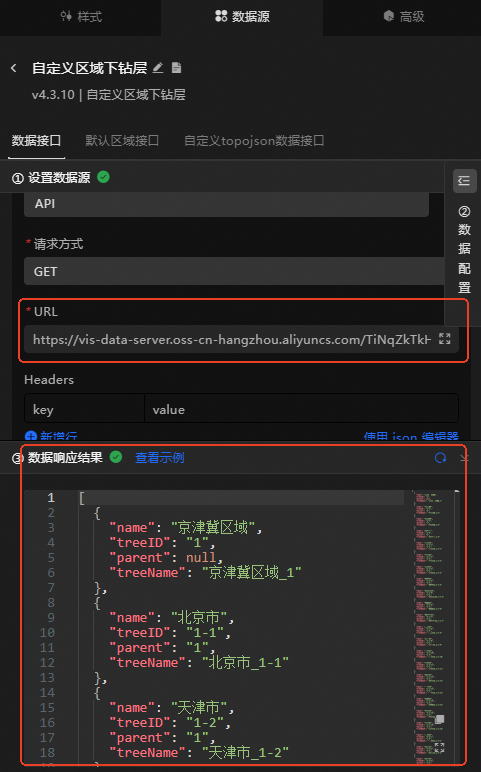
Select the Custom Area Drill-down Layer component. Click the data source panel on the right. Set Data Source Type to API. In the URL editor below, paste the JSON API URL into the data entry box. You can then view the data response.
The following is a sample API link.
https://vis-data-server.oss-cn-hangzhou.aliyuncs.com/TiNqZkTkH1IeUOGTiMC6WgHY6TtG72.jsonSelect Custom TopoJSON Data API, set Data Source Type to API, and paste the fetched JSON API into the URL editor.
The following is a sample API link.
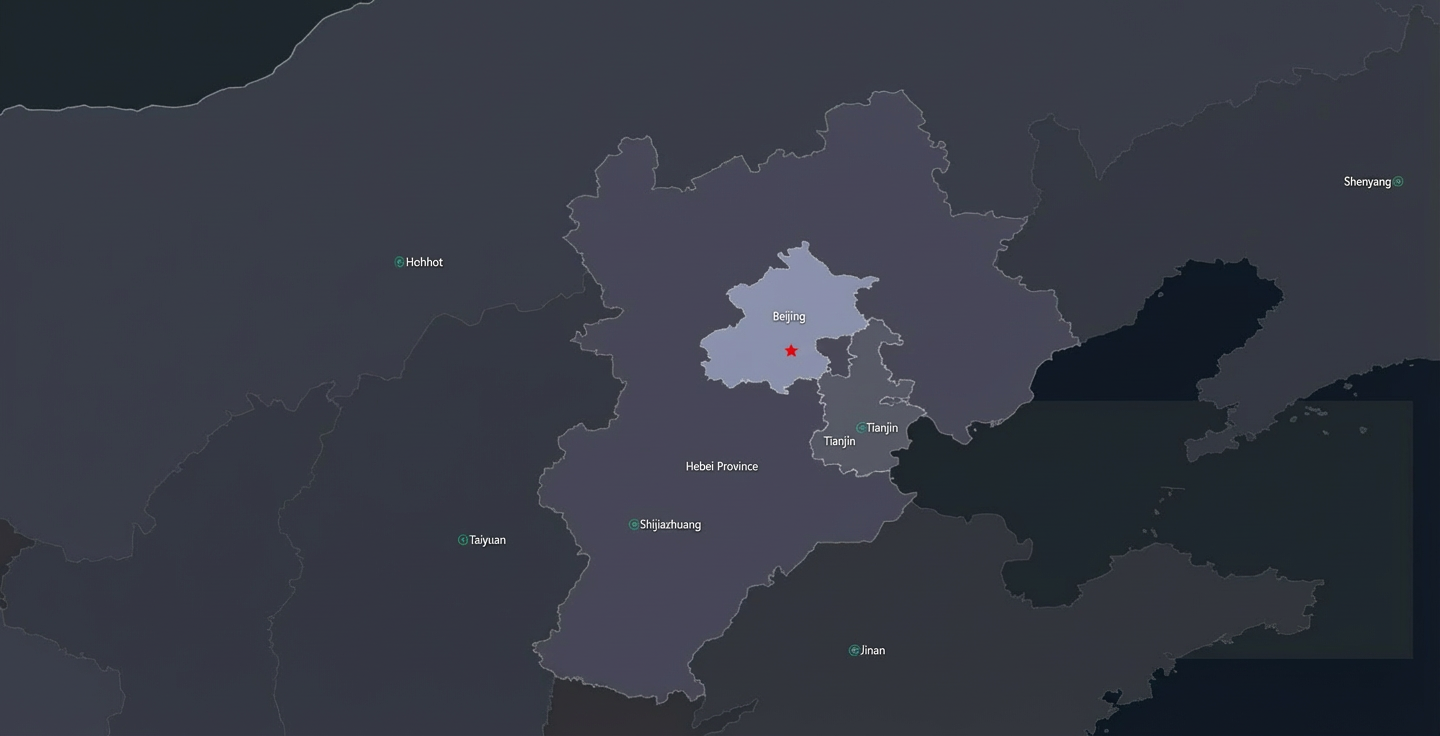
https://vis-data-server.oss-cn-hangzhou.aliyuncs.com/Aj6uSgiyi23D4rMSBEMGRfaIn1W1Jn.jsonAfter you configure the data interface for the Custom Area Drill-down Layer subcomponent, you can view the drill-down levels for the Beijing-Tianjin-Hebei region on the map in the canvas editor. Double-click an administrative region to drill down. The result is shown in the following figure.
Drill-down data structure definition
If you want to use the level data in an external application, refer to the data specification in the following figure for field descriptions.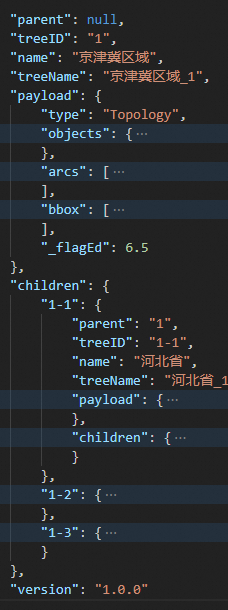
The figure above shows a set of JSON data. The root node contains a version field. The other fields are common to each level node and are described as follows.
Field |
Description |
|
The treeID of the parent node. |
|
The ID of the node. It is displayed in an "x-x-x" structure. For example, "1-2-3" indicates the third child node of the second child node of the root node. |
|
The name of the node. |
|
The name and ID of the node. |
|
The payload field is the geographic data field. For the open format, this is TopoJSON. If you are a developer, you can use topojson-client to convert TopoJSON to GeoJSON. |
|
A collection of child node data. |