Trajectory layer (v4.x)
Configure the trajectory layer to display movement paths as connected trajectory points on a Basic Flat Map 4.0.
Chart style
The trajectory layer is a sub-widget of the Basic Flat Map 4.0 that displays the movement path of a person or object as connected trajectory points. It supports independent style and data configurations.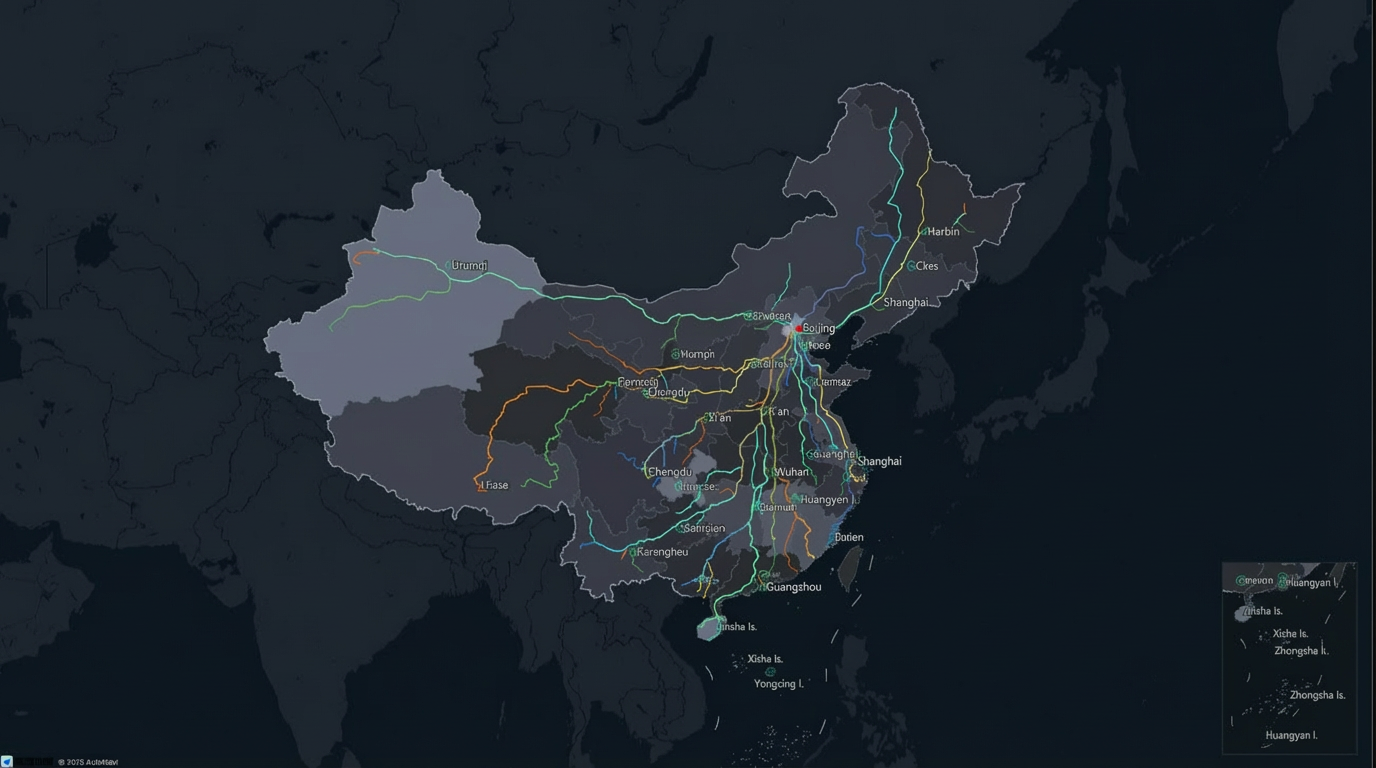
Style panel
When you configure interaction effects, the configurations for click and hover display modes are visible only in preview, publish, or interaction mode.
-
Search Configuration: Click the
 icon in the upper-right corner of the Style panel to search for configuration items by name. Fuzzy matching is supported. Search for a configuration item.
 -
General: General settings for the trajectory layer.
Parameter
Description
Visible Level
The zoom level range at which the layer is visible. Valid values: 0 to 22.
Opacity
The opacity of the trajectory layer. Valid values: 0 to 100%. Higher values make the layer more opaque.
-
Graphic: Graphic style settings for trajectory lines.
Parameter
Description
Trajectory Line Type
Select a trajectory line type from the drop-down list. Four built-in types are available.
Trajectory Thickness
The thickness of the trajectory line. To configure size mapping for different trajectory lines, see Size mapper instructions.
Trajectory Color
The trajectory line color, mapped from the
colorFieldvalue in the data. To configure color mapping for different trajectory lines, see Color mapper instructions. -
Interaction: Interaction settings for the trajectory layer.
Graphic Interaction: Interaction styles take effect when you click or hover over map elements in preview or publish mode. Click the
 icon to the left of Graphic Interaction to enable or disable the Graphic Interaction feature.
Parameter
Description
Click State
Set the focus and graphic style for the click state. Click the
 icon to enable or disable the Graphic Interaction click state.
-
Click to Focus: Click the
 icon on the left to enable or disable the click-to-focus interaction. When enabled, clicking a trajectory line focuses the map on that line's area. The margin range for the focused area is 0 to 300.Note
The map renders the effect only in interactive mode, preview, or publish.
-
Graphic: Set the trajectory line style for the Click State, including Trajectory Line Type, Trajectory Thickness, and Trajectory Color.
Hover State
Set the graphic style for the hover state. Click the
icon to enable or disable the Graphic Interaction hover state.-
Graphic: Set the dynamic trajectory line style for the Hover State, including Trajectory Line Type, Trajectory Thickness, and Trajectory Color.
-
-
Condition: Conditional style settings for the trajectory layer.
Conditional Style: Click the
or icon on the right to add or delete a conditional style. Click the or icon to arrange multiple conditional styles. Click the icon to copy the current conditional style configuration and create a new one with the same settings. For more information about style configurations, see Conditional tree instructions.Graphic: Enable the switch to configure graphic items for this style, or disable it to skip graphic configuration.
Parameter
Description
Trajectory Line Type
Select a trajectory line type from the drop-down list. Four built-in types are available. Click the
icon to control whether this style applies when the condition is met.Trajectory Thickness
The thickness of the trajectory line. Valid values: 0 to 20 px. Click the
icon to control whether this style applies when the condition is met.Trajectory Color
The color of the trajectory line. Click the
icon to control whether this style applies when the condition is met. -
Custom Tooltip Style: Custom tooltip style settings for the trajectory layer.
Parameter
Description
Dialog Switch
Turn on the switch to trigger the tooltip by Click or Hover.
Display Mode
The trigger mode for the tooltip: Click or Hover.
NoteThe map renders the effect only in interactive mode, preview, or publish.
Relative Offset
The horizontal and vertical offset of the tooltip, in pixels. Valid values: -1000 to 1000 px.
Text Style
The text style for the tooltip, including font, size, color, and weight.
Show Null Values
Turn on the switch to display "No data" in a tooltip for objects with no
infofield or an emptyinfofield. When the switch is off, no tooltip appears for data without aninfofield.Tooltip Style
-
Padding: Set the padding values for the top, bottom, left, and right sides of the tooltip text.
-
Border Style: Set the border radius, line width, and color for the tooltip.
-
Background Color: Set the background color of the tooltip.
-
Shadow Style: Set the blur color, blur radius, X offset, and Y offset for the tooltip shadow.
-
Close Button: Turn on the switch to display a Close button on the tooltip and set the button's color.
-
Pointer Arrow: Turn on the switch to display a pointer arrow on the tooltip.
-
 or
or  icon on the right to add or delete a conditional style. Click the
  or
or  icon to arrange multiple conditional styles. Click the
  icon to copy the current conditional style configuration and create a new one with the same settings. For more information about style configurations, see
 Data Source panel

|
Field |
Description |
|
|
Required. The planar spatial data for the trajectory line. |
|
|
Optional. The field for mapping the line width of the trajectory. |
|
|
Optional. The field for mapping the color of the trajectory. |
|
|
Optional. The field for custom tooltip content. HTML snippets are supported. |
|
|
Optional. The tooltip type. This requires the custom development feature. |
|
Data Item Configuration |
Description |
|
Data Source |
The component's data source displays the data fields contained within the component using code editing or visual editor. You can also modify the data type to flexibly configure the component's data. |
|
Data Mapping |
When you need to customize chart field configurations, you can set different field mappings in the Data Mapping module to map these fields to the corresponding fields of the component. This allows for real-time data matching without altering the data source fields. Additionally, click the |
|
Filter |
Open the Filter to select an existing data filter or create a new one, and configure the data filter script to achieve data filtering capabilities. For more information, see manage data filters. |
|
Data Response Result |
This feature displays the component's data in real-time. When the component's data source changes, the data response result will display the latest data accordingly. In case of a delayed system response, you can click the |
|
Disable Loading State |
Check the check box to hide the loading content during component updates and data dashboard previews. Unchecking will display the loading content. The default setting is unchecked. |
|
Controlled Mode |
Check the check box to prevent data requests upon the component's initialization. Data requests will only be initiated through global variables or methods configured in the blueprint editor. Unchecking allows for automatic update requests. The default setting is unchecked. |
|
Automatic Update Request |
Check the check box to manually set the polling frequency for dynamic polling. Clearing this option disables automatic updates, requiring manual page refreshes or data request triggers through the blueprint editor and global variable events for updates. |
 icon to configure field styles individually.
 icon on the right to check the current data response result, or click the
  icon on the right to obtain the most recent data for the component. You can also click to view examples to see sample response results for the current component.
Advanced panel

Configure interaction events or associate global variables for filter interactions between widgets. Configure widget interactions.
Blueprint interaction
-
Click the
icon in the upper-left corner of the page to open the Blueprint page. -
On the Layer Node tab, add the current widget to the main canvas.
-
View the blueprint configuration parameters.
-
Events
Event
Description
When Data Is Updated
Triggers an event and outputs data when the data response changes.
When Request Status Changes
Triggers an event and outputs data when the data request status changes (such as success or failure).
When a Point Is Clicked
Triggers an event and outputs data when a point in the layer is clicked.
When an Area Outside the Layer Is Clicked
Triggers an event and outputs data when an area outside the layer is clicked.
When Mouse Enters an Element
Triggers an event and outputs data when the mouse enters an area of the layer.
When Mouse Leaves an Element
Triggers an event and outputs data when the mouse leaves an area of the layer.
When Mouse Moves over an Element
Triggers an event and outputs data when the mouse moves over an area of the layer.
Component Loaded
This event is triggered after the data API request is returned and processed by the filter. The processed data is also output in JSON format. For a data example, see the Data Response area on the Data Source tab in the widget's configuration panel in the canvas editor.
-
Actions
Action
Description
Import Data
Processes data according to the widget's drawing format and then imports it to redraw the widget. This does not require a new request to the server-side. For a data example, see the Data Response for the trajectory line on the Data Source tab in the widget's configuration panel.
Request Data
Requests data from the server-side again. Data output from an input data processing node or a layer node is used as a parameter. For example, if the trajectory layer is configured with an API data source of
https://api.testand the data passed to the Request Data action is{ id: '1'}, the final request URL will behttps://api.test?id=1.Toggle Visibility
The Toggle Visibility, Show, and Hide actions do not require parameters by default. You can add animation configurations as needed. See the data example.
{
  // Animation type. Optional values: appear|fade|slideToUp. The default is fade. If left blank, there is no animation.
  "animationType": "fade",
  // Animation duration. The default is 1000 ms.
  "animationDuration": 1000,
  // Animation curve. Optional values: linear|easeInOutQuad|easeInOutExpo. The default is linear.
  "animationEasing": "linear"
}
Show
Hide
Update Widget Configuration
Dynamically updates the widget's style configuration. First, in the widget's Style panel, click Copy Configuration to Clipboard to get the widget configuration data. Then, change the field values for the corresponding styles in the data processing node on the blueprint editor page as needed.
-
 icon in the upper-left corner of the page to open the Blueprint page.