Visual mapping of data
Visual mapping of data maps raw data to visual properties of visualization elements (such as color, shape, and size) through specific rules, enabling visual representation of data features.
Example effect
The following figure shows the Graph configuration panel of the Vector Scatter Layer subcomponent in Basic Flat Map 3.0 and its visualization effect.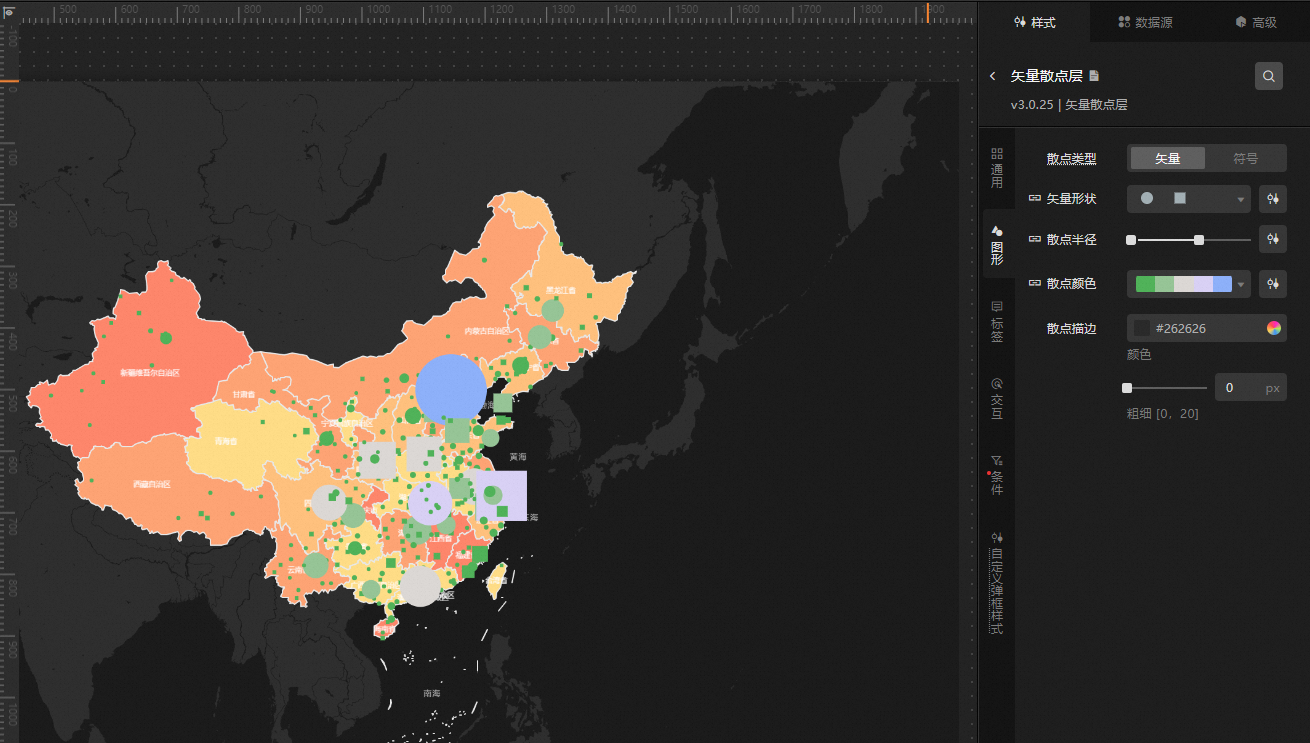
Limits
The visual mapping function is currently compatible with two types of components:
-
All components of version 5.x and above.
-
Subcomponents in Basic Flat Map and 3D Flat Map.
Function introduction
DataV integrates style configuration and data mapping, providing visual mapping functions including color mapper, shape mapper, size mapper, and condition tree. After you enable visual mapping for a component, you can intuitively associate styles with data and flexibly customize the visual presentation.
|
Feature |
Description |
|
Color mapper |
Color mapper configures the mapping between colors and data values in the component. |
|
Shape mapper |
Shape mapper maps data values to graphics in the component, similar to color mapper. Supported graphic types are vector and icon. |
|
Size mapper |
Size mapper adjusts the size of graphic elements. You use range sliders to define the size range and customize the mapping between data values and sizes. |
|
Condition tree |
Condition tree is used to specify logical judgments for conditional style modifications or filter style settings. |