Use CloudMonitor to track resource usage on your dedicated host and get notified when metrics exceed your defined thresholds. Because a dedicated host shares its physical resources across all ECS instances running on it, monitoring at the host level lets you catch contention early — before it affects individual instances.
Prerequisites
Before you begin, ensure that you have:
-
A dedicated host in the ECS console
-
An alert contact or alert contact group (required before creating alert rules). See Create an alert contact or alert contact group
View resource usage
CloudMonitor tracks up to 30 days of monitoring data across three resource categories on each dedicated host: computing, networking, and storage.
Log on to the ECS console.
-
Log on to the ECS console.
-
In the left-side navigation pane, choose Instances & Images >
 > Dedicated Hosts.
 -
In the top navigation bar, select the region and resource group.

-
On the Host tab, find your host and click the
 icon to open the CloudMonitor console.
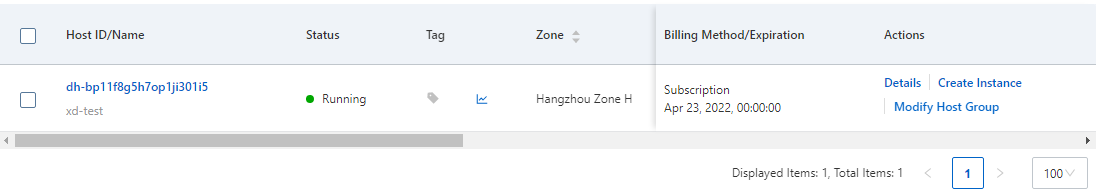
-
Review the metrics for your dedicated host.
The following table describes the available metrics. For the full metric reference, see Dedicated host metrics.
| Resource | Metric | Unit | Description |
|---|---|---|---|
| Computing | UserCpuUtilization | % | Average CPU utilization across all ECS instances on the host |
| Network | UserNetworkRxPPS | pps | Total inbound packets per second across all ECS instances |
| UserNetworkTxPPS | pps | Total outbound packets per second across all ECS instances | |
| UserNetworkRxBandwidth | bit/s | Total inbound bandwidth per second across all ECS instances | |
| UserNetworkTxBandwidth | bit/s | Total outbound bandwidth per second across all ECS instances | |
| Storage | UserDiskReadIOPS | IOPS | Total disk read requests per second across all ECS instances |
| UserDiskWriteIOPS | IOPS | Total disk write requests per second across all ECS instances | |
| UserDiskReadBPS | Byte/s | Total bytes read from disks per second across all ECS instances | |
| UserDiskWriteBPS | Byte/s | Total bytes written to disks per second across all ECS instances |
Create an alert rule
Alert rules notify you when a metric crosses a threshold, so you can respond before resource contention affects the instances running on your host.
-
In the CloudMonitor console, hover over the metric you want to monitor, then click
 .
. -
In the Configure Rule Description panel, set the alert rule parameters and click OK.
Parameter Description Example Alert rule A name that identifies this rule ddhxxx-cpu Metric type The alert evaluation method. Select Single Metric, Multiple Metrics, or Dynamic Threshold. For dynamic thresholds, see Overview and Create dynamic threshold-triggered alert rules. Single Metric Metric The metric to monitor UserCpuUtilization Threshold and alert level The severity level and the value that triggers the alert Critical; Value >= 80% -
In the Create Alert Rule panel, configure the scope and notification settings.
Parameter Description Example Associated resources The host you were viewing is selected by default. To add other hosts, expand the drop-down arrow, select a region, then select additional hosts. Keep the default settings Mute for How long CloudMonitor waits before sending a follow-up notification if the alert condition persists (default: 30 minutes) Keep the default settings Effective period A time window during which alerts fire (for example, 19:00–20:59 only) Keep the default settings Alert contact group The contact group that receives alert notifications test -
Click Confirm.
For more configuration options, see Create an alert rule.
What's next
-
To monitor other Alibaba Cloud services, see Cloud service monitoring.
-
To modify, disable, enable, or delete an alert rule, see Manage alert rules.