The Real-time monitoring page shows overall statistics for your application services. These statistics include response time, error rate, and request volume.
Real-time monitoring overview
Top 5 application services
Top 5 application services by request volume: Lists the five applications with the most requests and their request counts within the default time window.
Top 5 application services by response time: Lists the five applications with the longest response times and their corresponding response times within the default time window.
Top 5 application services by error rate: Lists the five applications with the highest request error rates and their corresponding error rates within the default time window.
Application service list
This list displays all applications running in the current environment and an overview of their monitoring data.
Application service: The name of the application service.
Number of replicas: The total number of replicas.
Inbound traffic: The amount of inbound traffic for the application service, measured in bytes.
Outbound traffic: The amount of outbound traffic for the application service, measured in bytes.
Request volume: The number of requests that the application service receives per minute.
Response time: The average response time of the application service, in ms.
Error rate: The percentage of requests that result in an error.
Application service real-time monitoring details
On the Real-time monitoring page, click an application service name to open its monitoring details page. On this page, you can view the service's monitoring metrics, which helps you detect abnormal pod conditions or service traffic overloads and resolve issues promptly.
On the Real-time monitoring page, click the name of the target application service.
In the filter area at the top of the page, specify the following information:
Application version: Select an application version.
Pod: Select a pod.
Time period: Select a start and end time for the time window. The default is the last 5 minutes.
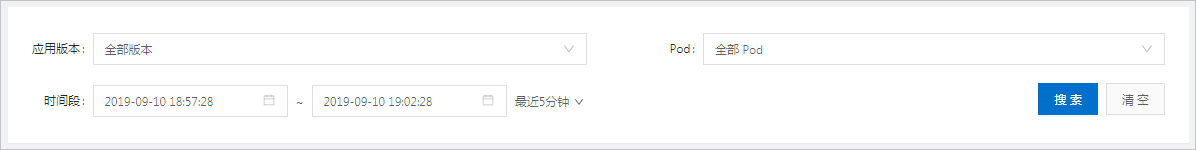
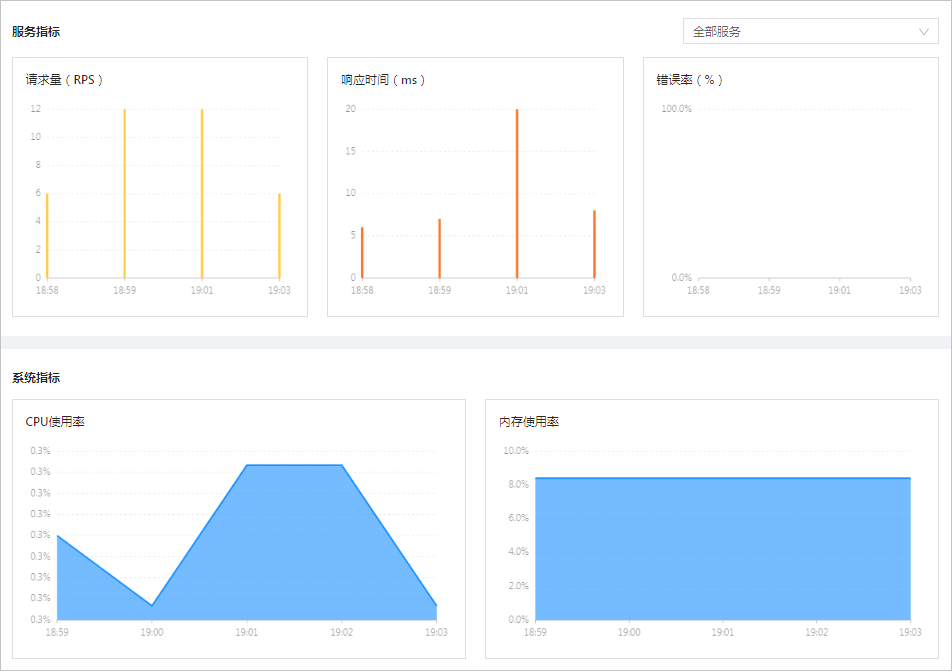
Click Search. The page displays the monitoring information for the application based on your specified conditions. This information consists of two parts.
Service metrics: By default, this section displays trends for the request volume, response time, and error rate for all services within the application. You can also choose to view the performance of a specific service.
System metrics: Displays trends for the application's CPU usage, memory usage, inbound traffic, and outbound traffic within the specified time period.
If an application service is abnormal, you can perform service administration by adding throttling or routing rules. For more information, see Service routing and Service throttling.