Add a chart
After you create a dashboard, you can add charts to it. You can customize the chart types and metrics to display data about issues. This topic describes how to add and configure charts.
Procedure
Log on to the EMAS console, find your project, and click the project to open the EMAS Real-time Overview page.
In the top navigation bar, select R&D Tools.
In the navigation pane on the left, choose Application Monitoring > Multi-dimensional Analysis.
On the Multi-dimensional Analysis page, select a dashboard and click Enter Edit Mode.
On the dashboard page, click + Add Chart in the upper-right corner to configure custom chart types and metrics for the dashboard.
NoteYou can add multiple charts.
You can manage charts. For more information, see Manage charts.
Trend Graph Configuration
Parameter |
Description |
|
Chart name |
Enter a custom name for the chart. |
|
Select chart type |
Trend chart. |
|
Decimal places |
Specify the number of decimal places. The default value is 2. |
|
Y-axis threshold |
Set the maximum and minimum threshold range for the y-axis. |
|
Legend field |
A table appears below the chart. It shows information based on the filter conditions.
|
|
Chart metrics |
Metric type |
Customize chart metrics. Filter by metric type, metric, aggregation method, and statistical dimension.
Note
|
Metric |
Select the metrics to query. You can add multiple metrics. For more information, see Metric description. |
|
Aggregation method |
For some metrics, the statistical types are COUNT and COUNTDISTINCT. For time-consuming metrics, you can configure the statistical value type to AVG, PCT50, and so on. Statistical methods and descriptions:
|
|
Statistical dimension |
Configure statistical dimensions for the metric. You can add multiple dimensions. After you select dimensions, the trend chart is grouped and displayed based on the selected dimensions. |
|
Filter conditions |
Filter dimension |
Add filter conditions based on custom metrics. You can filter by dimension, inclusion or exclusion, and categories within the dimension.
Note
|
Filter condition |
Configure filter conditions for the metric. The filter methods are: Contains, Does not contain. |
|
Mark |
Add marks. You can add mark lines or mark areas to the trend chart and name them. You can add multiple marks. |
|
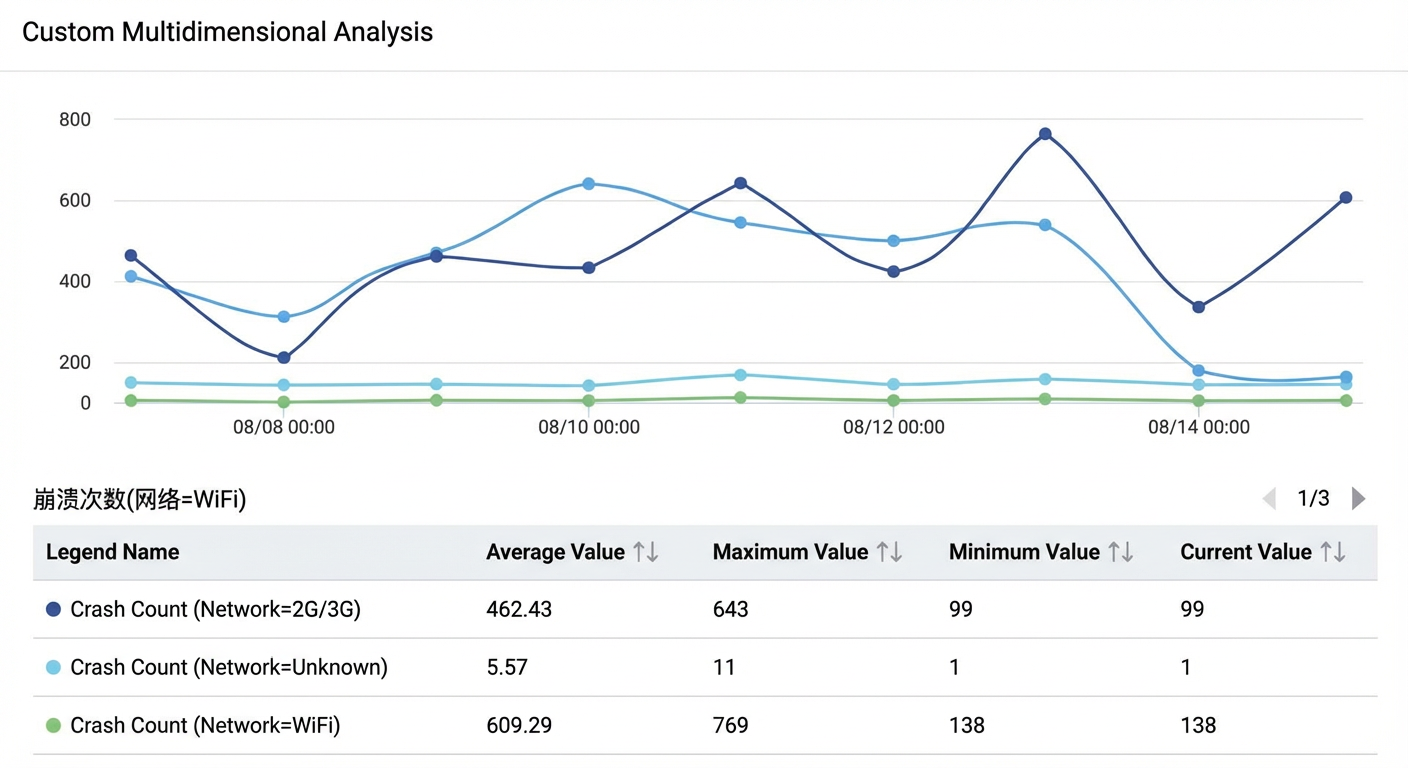
 icon to control which metric is displayed.
Configure a data card
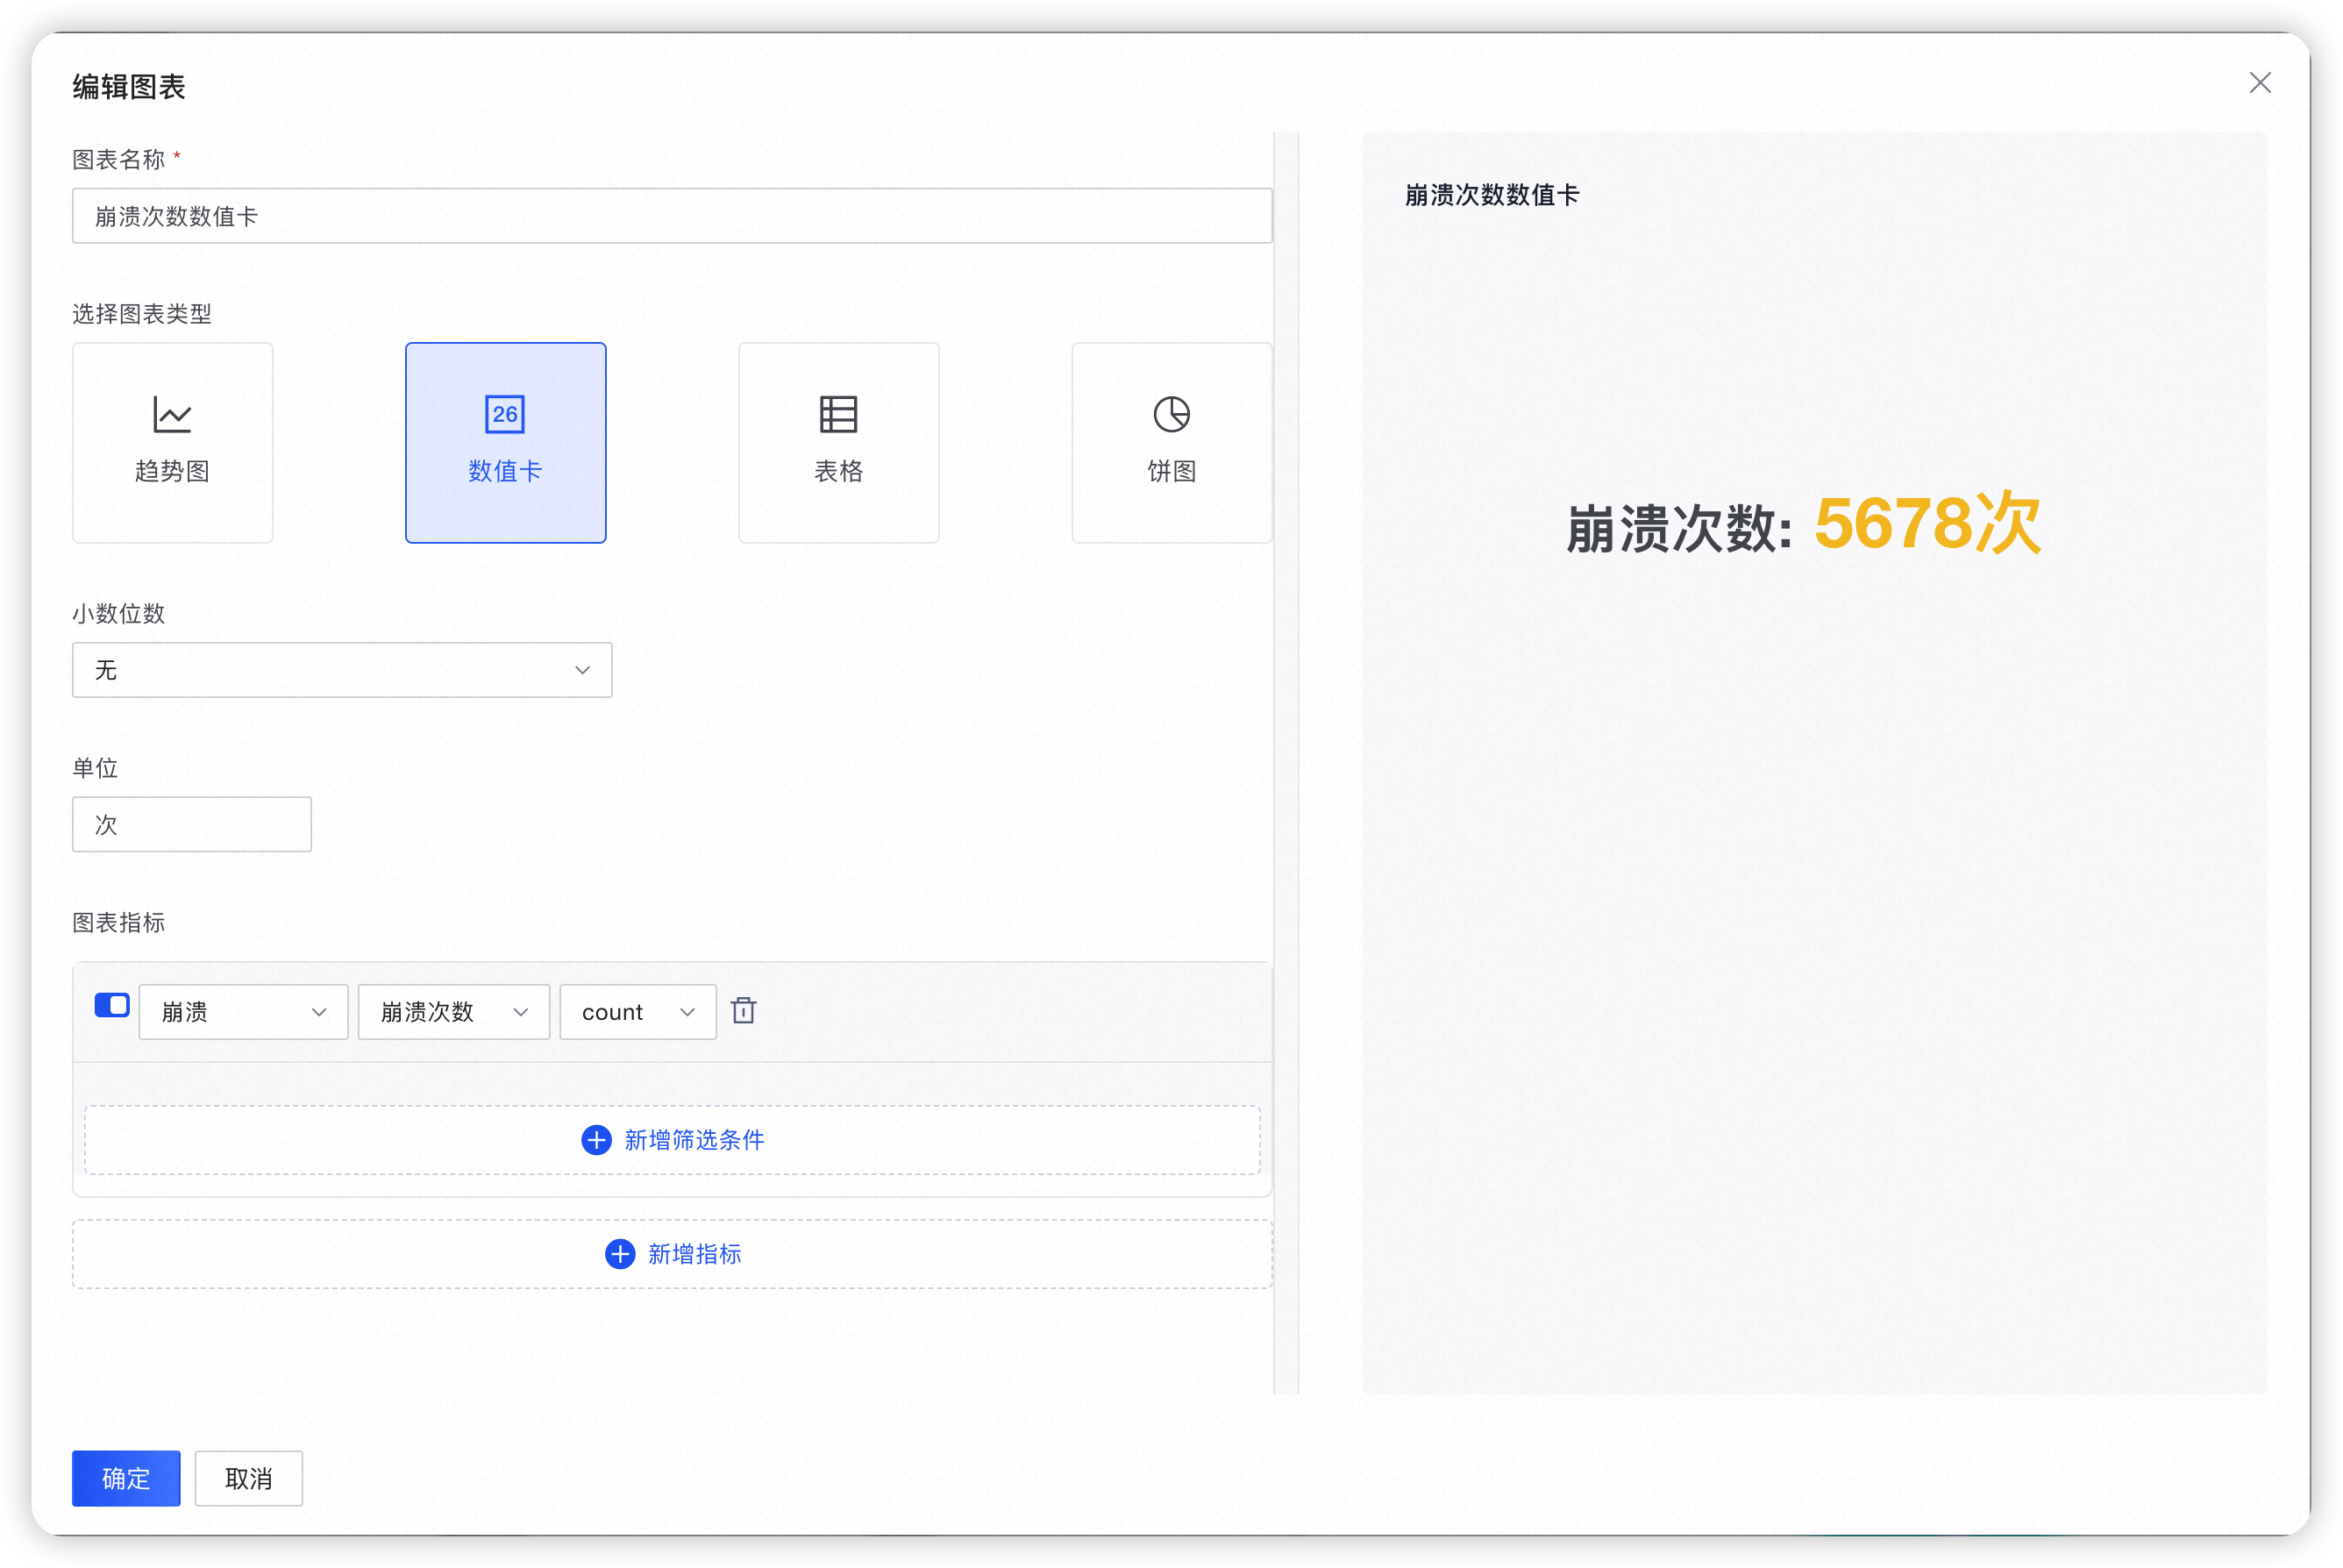
Parameter |
Description |
|
Chart name |
Enter a custom name for the chart. |
|
Chart type |
Data card. |
|
Decimal places |
Specify the number of decimal places. The default value is 2. |
|
Unit |
Configure the unit for the final displayed value. For example, configure the unit for FPS as s (seconds). |
|
Chart metrics |
Metric type |
Customize chart metrics. Filter by metric type, metric, aggregation method, and statistical dimension.
Note
|
Metric |
Select the metrics to query. You can add multiple metrics. For more information, see Metric description. |
|
Aggregation method |
For some metrics, the statistical types are COUNT and COUNTDISTINCT. For time-consuming metrics, you can configure the statistical value type to AVG, PCT50, and so on. Statistical methods and descriptions:
|
|
Filter conditions |
Filter dimension |
Add filter conditions based on custom metrics. You can filter by dimension, inclusion or exclusion, and categories within the dimension.
Note
If you add multiple filter conditions, you must confirm the AND/OR logic for the conditions. |
Filter condition |
Configure filter conditions for the metric. The filter methods are: Contains, Does not contain. |
|
Configuration Table
Parameter |
Description |
|
Chart name |
Enter a custom name for the chart. |
|
Chart type |
Table |
|
Chart metrics |
Metric type |
Customize chart metrics. Filter by metric type, metric, aggregation method, and statistical dimension.
Note
|
Metric |
Select the metrics to query. You can add multiple metrics. For more information, see Metric description. |
|
Aggregation method |
For some metrics, the statistical types are COUNT and COUNTDISTINCT. For time-consuming metrics, you can configure the statistical value type to AVG, PCT50, and so on. Statistical methods and descriptions:
|
|
Filter conditions |
Filter dimension |
Add filter conditions based on custom metrics. You can filter by dimension, inclusion or exclusion, and categories within the dimension.
Note
If you add multiple filter conditions, you must confirm the AND/OR logic for the conditions. |
Filter condition |
Configure filter conditions for the metric. The filter methods are: Contains, Does not contain. |
|
Sorting |
Select a metric type, sort in ascending or descending order, and display the top data. The default is top 10. |
|
Group |
Add groups for the metric. After you select a dimension, the table chart is grouped and displayed based on that dimension. |
|
Configure a pie chart
Parameter |
Description |
|
Chart name |
Enter a custom name for the chart. |
|
Chart type |
Pie chart |
|
Decimal places |
Specify the number of decimal places. The default value is 2. |
|
Chart metrics |
Metric type |
Customize chart metrics. Filter by metric type, metric, and aggregation method.
Note
|
Metric |
Select the metrics to query. You can add multiple metrics. For more information, see Metric description. |
|
Aggregation method |
For some metrics, the statistical types are COUNT and COUNTDISTINCT. For time-consuming metrics, you can configure the statistical value type to AVG, PCT50, and so on. Statistical methods and descriptions:
|
|
Filter conditions |
Filter dimension |
Add filter conditions based on custom metrics. You can filter by dimension, inclusion or exclusion, and categories within the dimension.
Note
If you add multiple filter conditions, you must confirm the AND/OR logic for the conditions. |
Filter condition |
Configure filter conditions for the metric. The filter methods are: Contains, Does not contain. |
|
Group |
Add groups for the metric. After you select a dimension, the pie chart is grouped and displayed based on that dimension. |
|
Metric description
Metric categorization |
Metric |
Android metrics |
|
iOS metrics |
|
You can customize chart metrics by filtering by metric type, metric, aggregation method, and statistical dimension. You can add multiple metrics by clicking Add Metric. Although multiple metrics can be added, only one is displayed at a time. You can use the icon to control which metric is displayed.