The Abnormal Diagnosis feature lets you query overview data, factor distribution, and details for abnormal calls under a specific AppID. This topic describes how to query abnormal calls.
Prerequisites
To use the Abnormal Diagnosis feature, submit a ticket to enable it. When you create the ticket, specify that you want to enable the Abnormal Diagnosis feature and include your UID.
Procedure
Log on to the Real-Time Communication (RTC) console.
In the navigation pane on the left, choose to open the Abnormal Diagnosis interface.
Select the AppID and time range to query.
NoteYou can also drag the timeline to select a time range. If you drag the end of the timeline, the Real-time Update feature is disabled.
Optional: Click the Abnormal Overview tab to view the overview data for abnormal calls.
The abnormal overview includes metrics such as slow channel entry instances, users with audio stuttering, users with video stuttering, users with video blur, users with high call latency, and slow first-frame reception instances, as shown in the following table:
Metric
Description
Slow channel entry instances
A slow channel entry is recorded if a user takes more than 5 seconds to successfully join a channel. Multiple slow entries by the same user are counted cumulatively.
Users with audio stuttering
The number of users who experience audio stuttering during a call.
Users with video stuttering
The number of users who experience video stuttering during a call.
Users with video blur
The number of users who experience video blur during a call.
Users with high call latency
The number of users who experience high latency during a call.
Slow first frame reception instances
A slow first frame reception is recorded each time a user subscribes to a stream and experiences a delay in receiving the first frame. Multiple slow receptions by the same user are counted cumulatively.
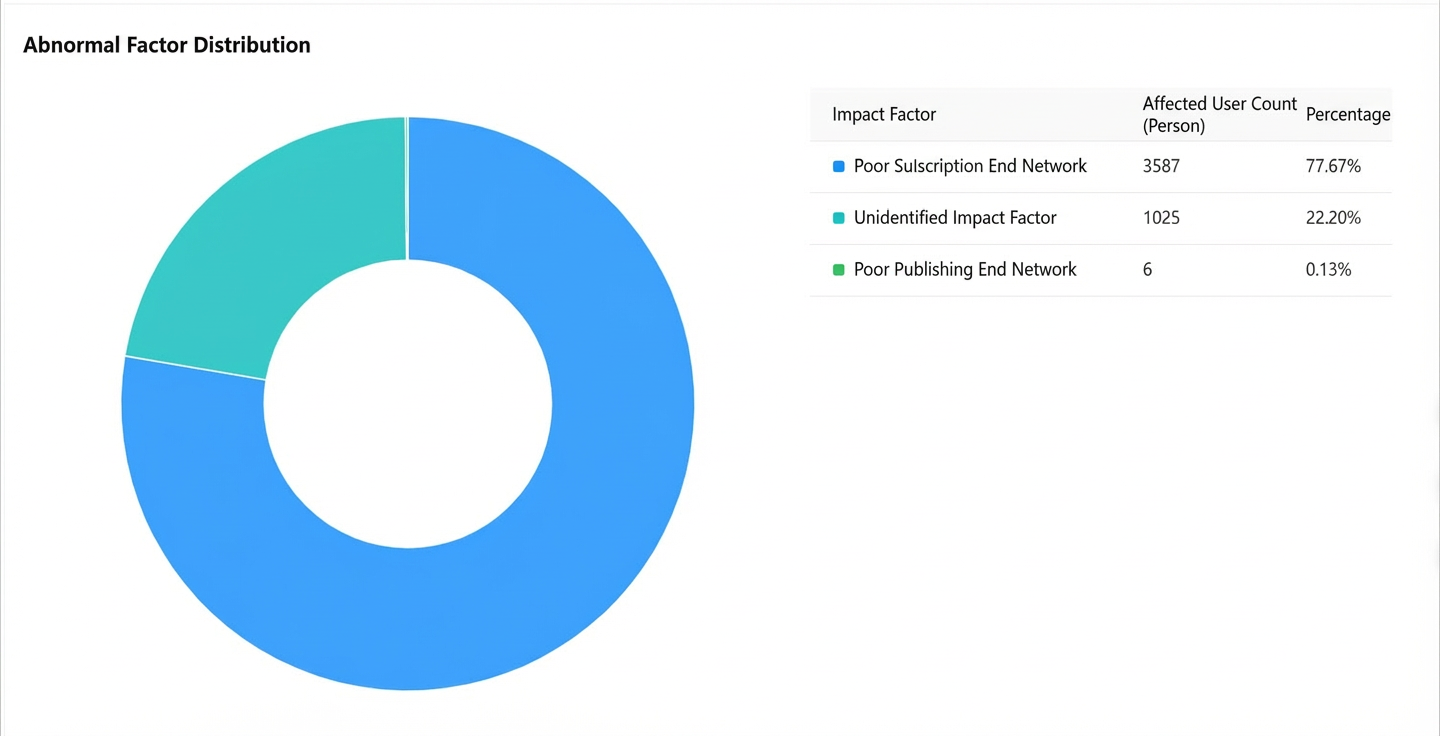
Optional: Click the Abnormal Factor Distribution tab to view the distribution of factors that cause abnormalities.
The abnormal factor distribution consists of influencing factors, the number of affected users, and their percentage, as shown in the following figure:
 Note
NoteInfluencing factors include but are not limited to the following:
Poor network on the publisher side
Poor network on the subscriber side
Poor device performance on the publisher side
Publisher's camera is turned off
Publisher's app is running in the background
Optional: Click the Abnormal Call Details tab, enter a ChannelID or UserID, and then click the
 search icon to view the details of abnormal calls.
In the Actions column, you can click Diagnose to diagnose an abnormal call.
The diagnosis includes basic information and diagnostic results for the call. You can click End-to-end Data to view the end-to-end data from communication monitoring. For more information, see End-to-end data.