Debug a workflow
As workflows grow more complex, errors become more likely during execution. CloudFlow Studio provides a built-in online debugger to help you quickly identify and resolve issues. Use it to troubleshoot contextual errors, correct state node parameters, and debug the workflow online. This reduces system downtime and improves efficiency.
Procedure
On the canvas, you can customize a workflow by dragging and dropping nodes. The online debugger lets you debug the workflow as you edit, so you can create an executable workflow directly.
The debugger does not currently support the distributed mode for a Map state.
Log on to the CloudFlow console. In the top navigation bar, select a region.
On the Workflows page, click Create Workflow.
In the Create Workflow dialog box, select Use Blank Canvas, choose a workflow mode, set the workflow name and description, and then click Create.
On the CloudFlow Studio page, select a state node (API) or a flow node from the state browser and drag it to the canvas on the right.
Configure the parameters for the node.
After configuring the node, click the
 icon on the right, enter the debug input, and then click OK.

After debugging, click the
 icon to view the debug result.
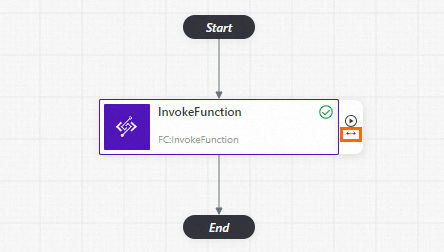
Example
This example shows how to use input and output to troubleshoot an issue where a state fails to process its input parameters.
The following error message indicates that the value must be an array of objects.
The error field for this step is CONSTRUCT_FAILED, and the cause field is value must be array of object.
In the input constructor for this state, define a variable and assign it the value $Input.
- Type: Map
  Name: Map1
  Processor:
      StartAt: Pass1
      States:
          - Type: Pass
            Name: Pass1
            End: true
  ProcessorConfig:
      ExecutionMode: Express
  OutputConstructor:
      $: $Output
  InputConstructor:
      Field.$: $Input
  End: true
When you run the debugger, view the current state's input to pinpoint and correct the problem.