1. Overview
Aggregates error log with the same error summary and displays their details. This helps you quickly locate and resolve issues. On the Crash Analysis, ANR Analysis, OOM Exception, Lag Analysis, and Crash Analysis page, click the error list and enter the corresponding error details to enter this function. The style content of each module in the error details is slightly different.
2. Error summary
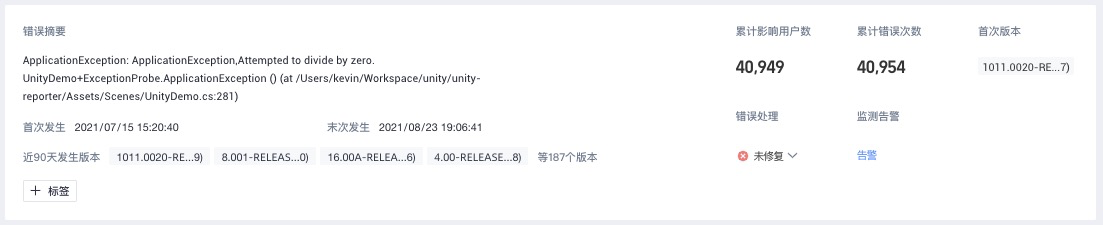
According to certain aggregation rules will be error log aggregated summary information
Cumulative Errors: the number of logs received since the error occurred
Cumulative Affected Users: the number of devices to which logs that have been received since the error occurred
First version: the version of the first error log that is reported to QT.
First occurrence: reported to the QT system of the first error log corresponding to the server-side receive time
Last occurrence: reported to the QT system of the last error log corresponding to the server-side receive time
Version in Last 90 Days
Error handling: the handling status of the error. You can set the status to Not Fixed, Processing, Ignored, and Fixed.
Monitoring and alerting: You can configure an alert for a single error. You can modify and configure the alert in the monitoring alert section.
Label: You can add labels to error summaries.
3. Error details
The log details are displayed in descending order of the error log receiving time.
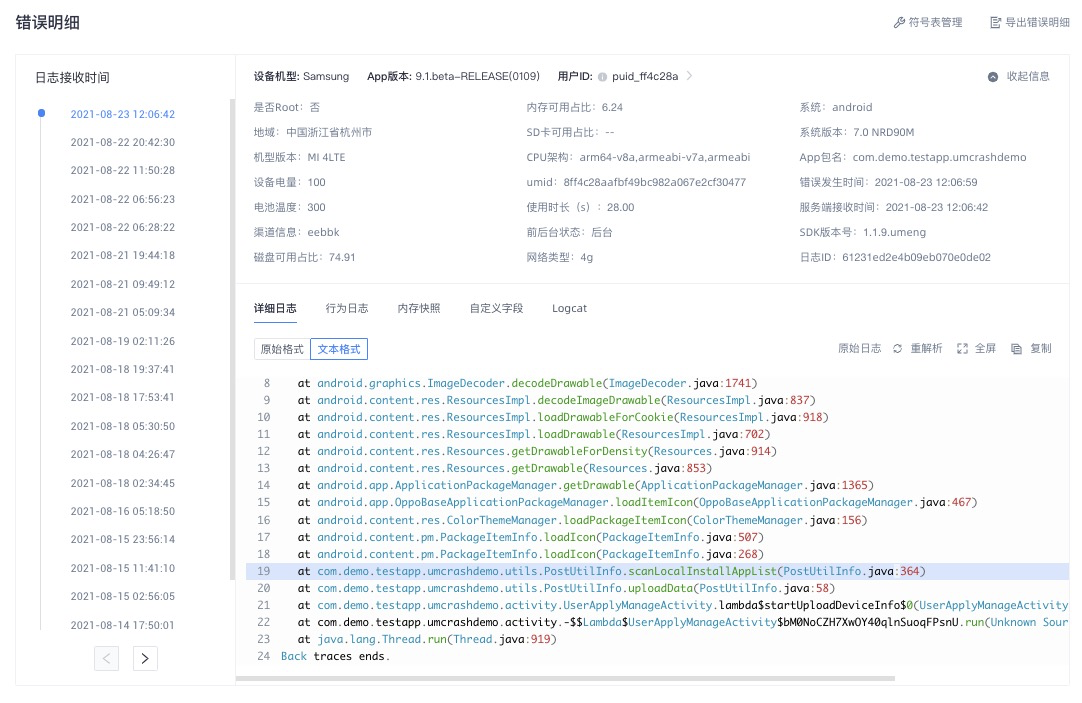
3.1 basic information
Error related to the device system info and device information
User ID: The unique ID that identifies the device. You can upload the user account. If not, we will default to the device id generated by APM.
System: supports the identification of HarmonyOS operating system
3.2 Detailed logs
Error Stack Information
Raw logs: You can view and export raw logs of the last seven days.
Symbol table:
- Mapping file: When Android applications are released, Java source code may be obfuscated, so the exception stack in the error log collected by SDK is the result of obfuscation and is poorly readable. To view the exception stack information on the error log details page, you can upload the mapping file generated during application obfuscation on the Symbol Table Management page. -Symbol table file: The native class library that Android applications depend on, or the exception stack generated by iOS applications is binary and unreadable. To view the exception stack information on the error log details page, upload the so file corresponding to the Android Native class library or the dSYM file corresponding to the iOS application through the symbol table management page.
3.3 Behavior logs
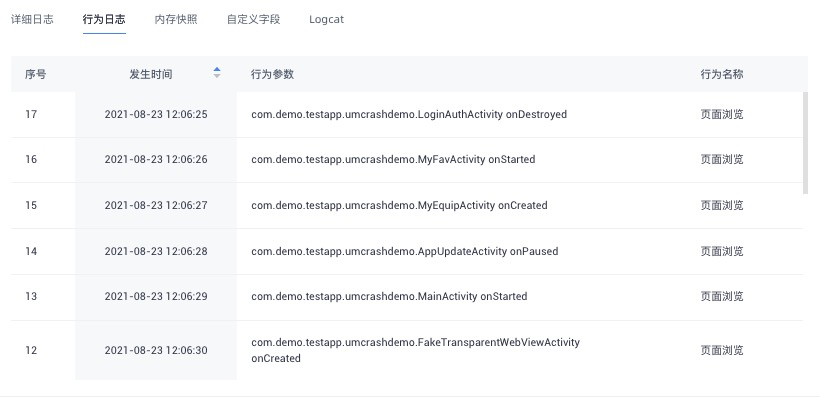
Android
The sequence and time points of lifecycle invocations in the first 20 actions where an error occurred. Supports forward and reverse order. By default, the order is in reverse order.
The cycle type of the parameter: onCreate(), onStart(), onResume(), onPause(), onStop(), and onDestroy()
iOS
10 activities before the error occurs
3.4 Memory Snapshot
Device memory usage (only supported by Android) 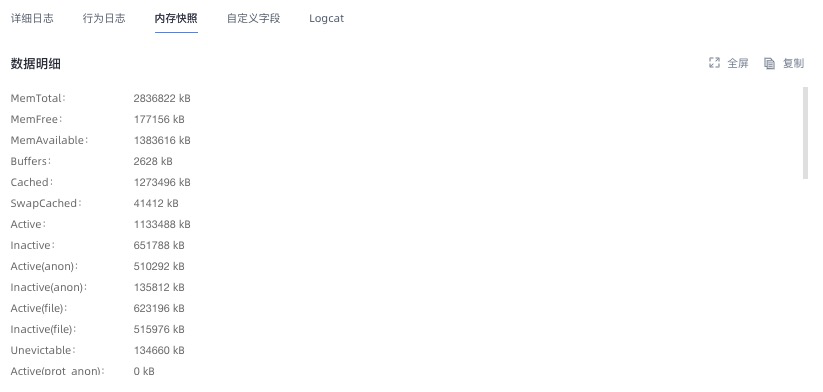
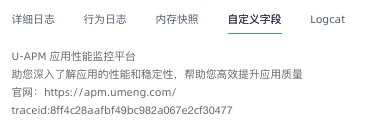
3.5 Custom Fields
When a crash occurs, you can use this callback method to return the custom business data of the string type. The data is written to the crash file and uploaded to the server for display. For more information about the calling method, see the integration documentation.
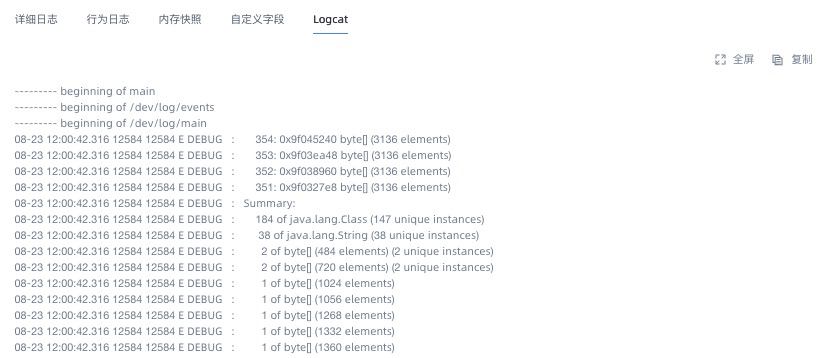
3.4 Logcat
Provide logcat log file information
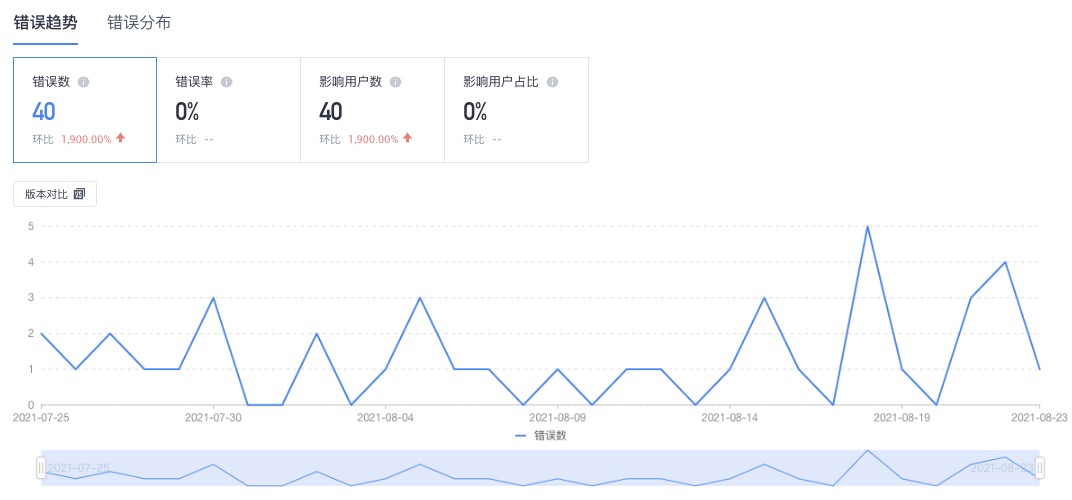
3.4 Error trend
Within a specific filter condition and time range, the error summary shows the trends of the number of errors, error rate, number of affected users, and proportion of affected users. You can select application versions for comparison.
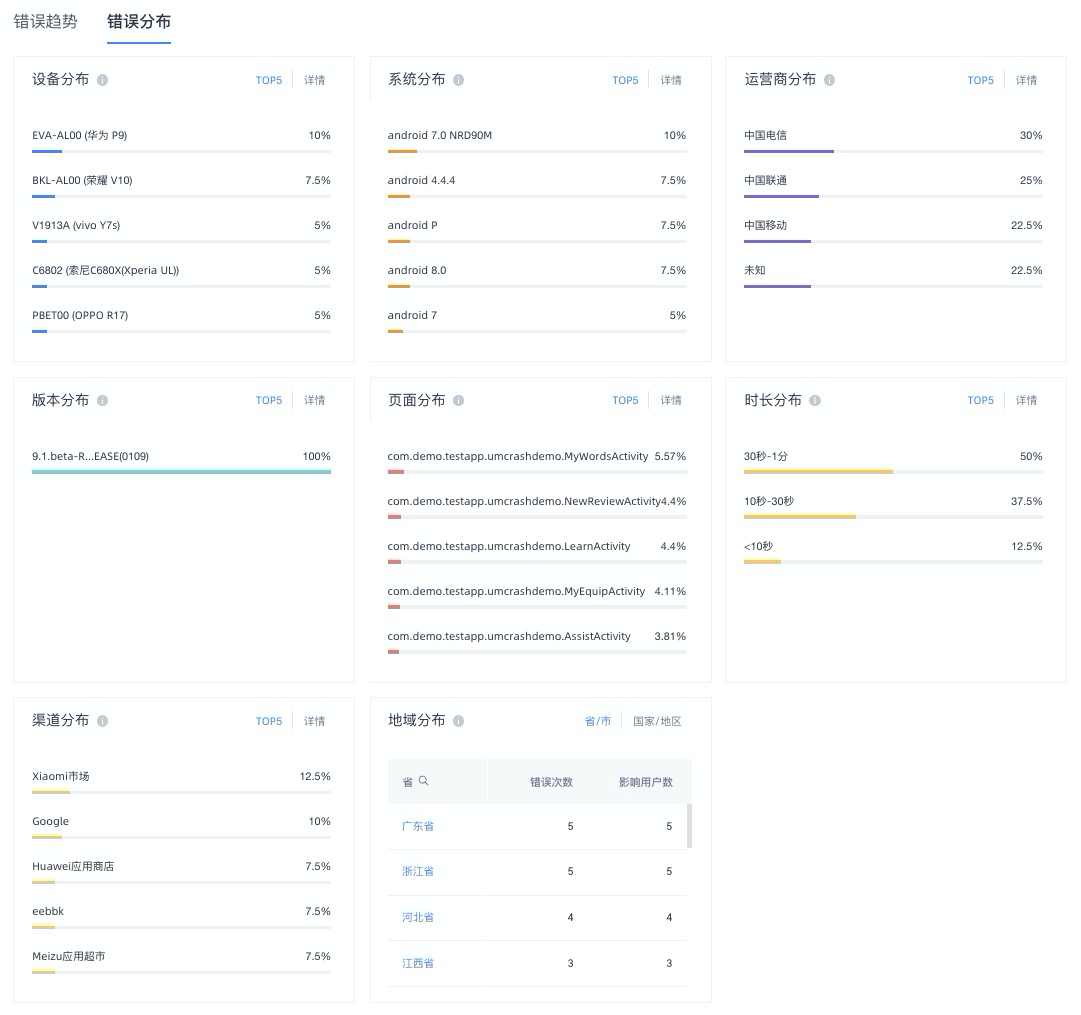
3.5 Error distribution
Within a certain filter condition and time range, the error summary error log in each dimension distribution. For more information, see the dimensions of each analysis module.