1. Overview
The program captures and handles exceptions. To better understand and monitor these exceptions, developers must report these exceptions to Performance Experience Platform. For more information about how to report exceptions, see the integration documentation.
2. Noun Interpretation
Errors: the number of times that this type of error occurs within a certain time range, that is, the number of logs reported by the SDK
Error rate: Error rate=Number of errors /Number of application startup times
Affected users: In a certain time range, all error log with this type of error are recounted by device dimension.
Percentage of affected users: Percentage of affected users=Number of affected users /Number of active users
3. Function introduction
3.1 Error trend
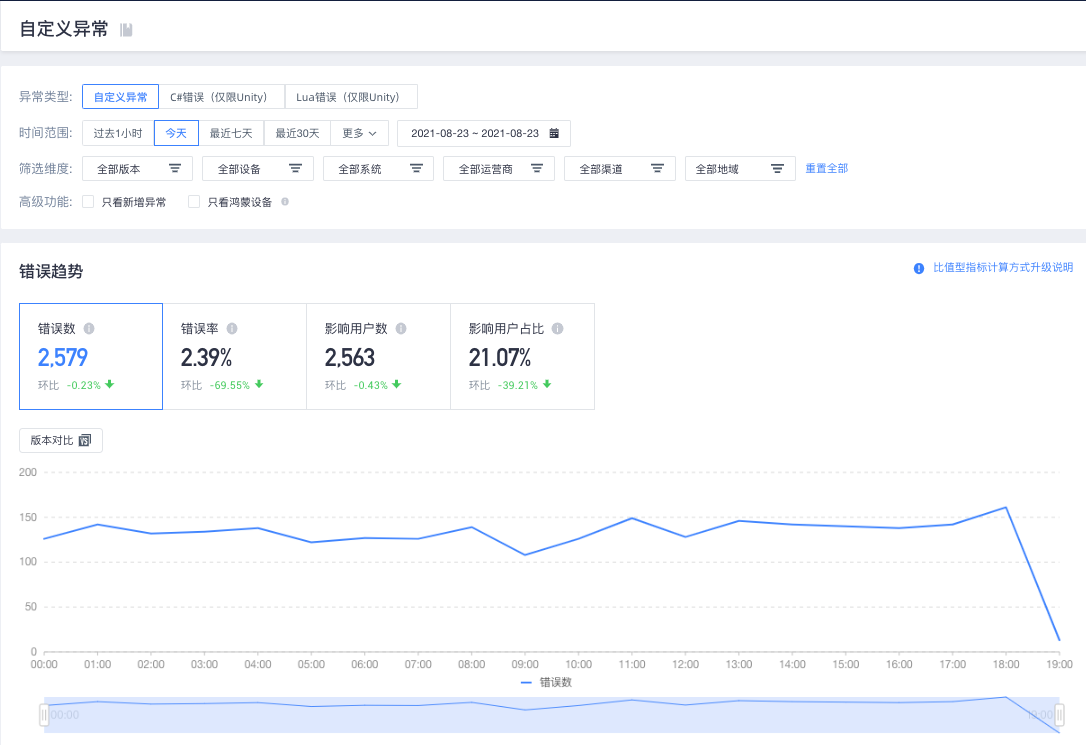
In the chart that shows the trends of the number of errors, error rate, number of affected users, and proportion of affected users within a specific filter condition and time range, you can select application versions for comparison.
1. Exception type
Supports custom exceptions, C# errors (Unity), and Lua errors (Unity)
2. Time Range
Query data in the last 90 days
3. Dimension filtering
Filter by application version, device model, operating system, carrier, channel, and region
4. Advanced features
Exception: The error ID is uniquely identified by the error summary.
Only the Hongmeng device: The device that has an error or exception is HarmonyOS but does not support HarmonyOS system-level errors.
3.2 Error distribution
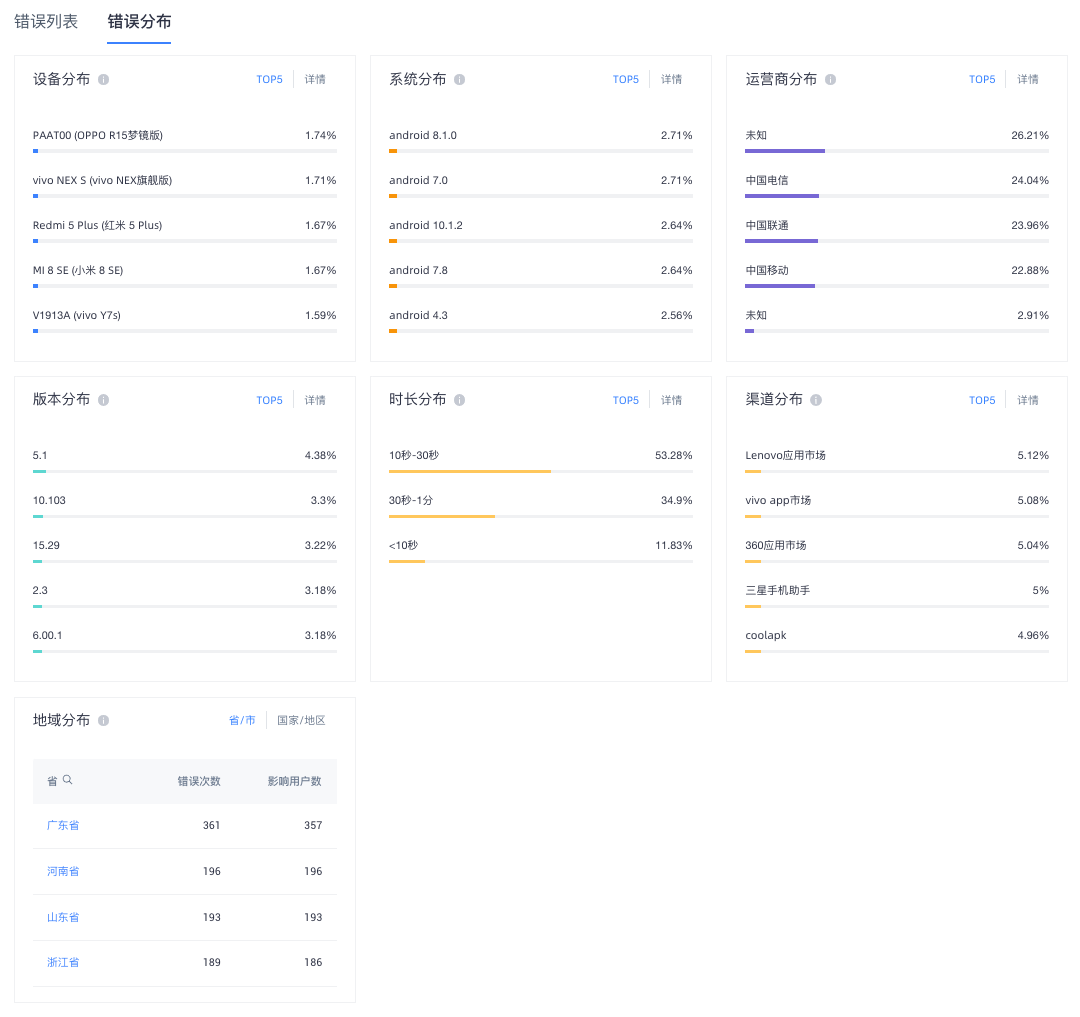
In the time range and filter dimension conditions, the distribution map is based on the application version, device model, operating system, carrier, channel, region, and run time length.
Top 5: Top 5 error times
Error Distribution Details: indicates the number of errors and the number of affected users for each attribute value. You can filter specific attributes in the table header.
3.3 Error List
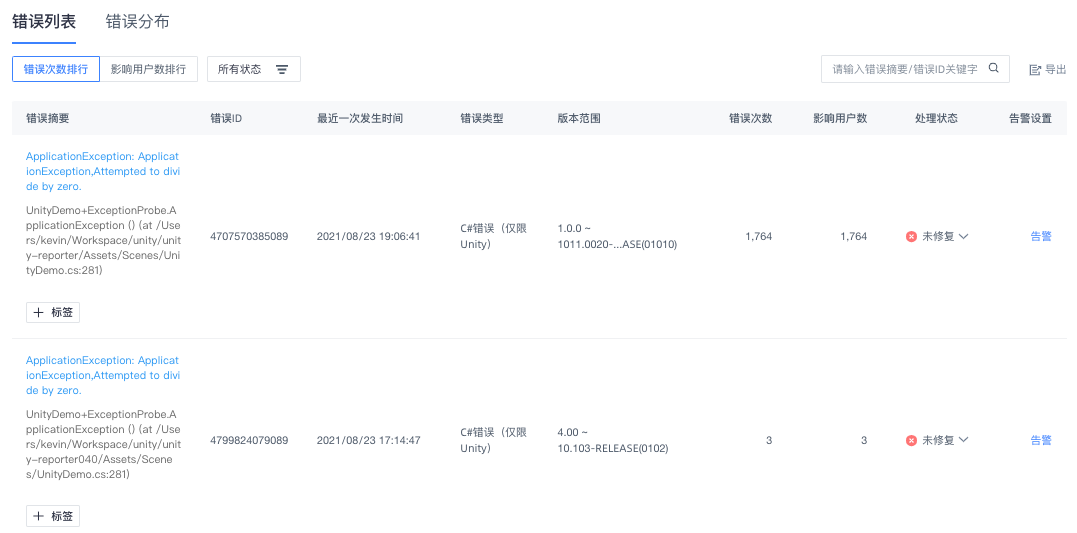
In the time range and filter dimension conditions, all error log are aggregated by crash summary.
Error ranking: By default, errors are displayed in descending order. This helps you quickly find the errors that have the most errors and have the most serious impact. You can also choose to rank by the number of affected people to find the error with the largest area of impact.
Error ID: is the unique identifier of the error summary.
Version Range: The version range in which the crash occurred under the current filter conditions.
Processing Status: The processing status of the error. You can set the processing status to Not Fixed, Processing, Ignored, and Fixed.
Alert settings: You can set alerts for a single error. You can modify and set the alerts that are added in this location.
Label: You can add labels to error summaries.
Export: You can export a maximum of 1000 errors at a time.
3.4 Error details
The error summary of the same error log together, display its details, help you quickly locate the problem, solve the problem.