Provides monitoring and analysis of Flutter Dart exceptions, which requires you to bridge and report data interfaces. For the reporting method, see the Flutter access document of Android/iOS. If you need training, please contact us at any time.
Module location: The function is located on the Performance Monitoring-Flutter Analysis-Dart Exception page
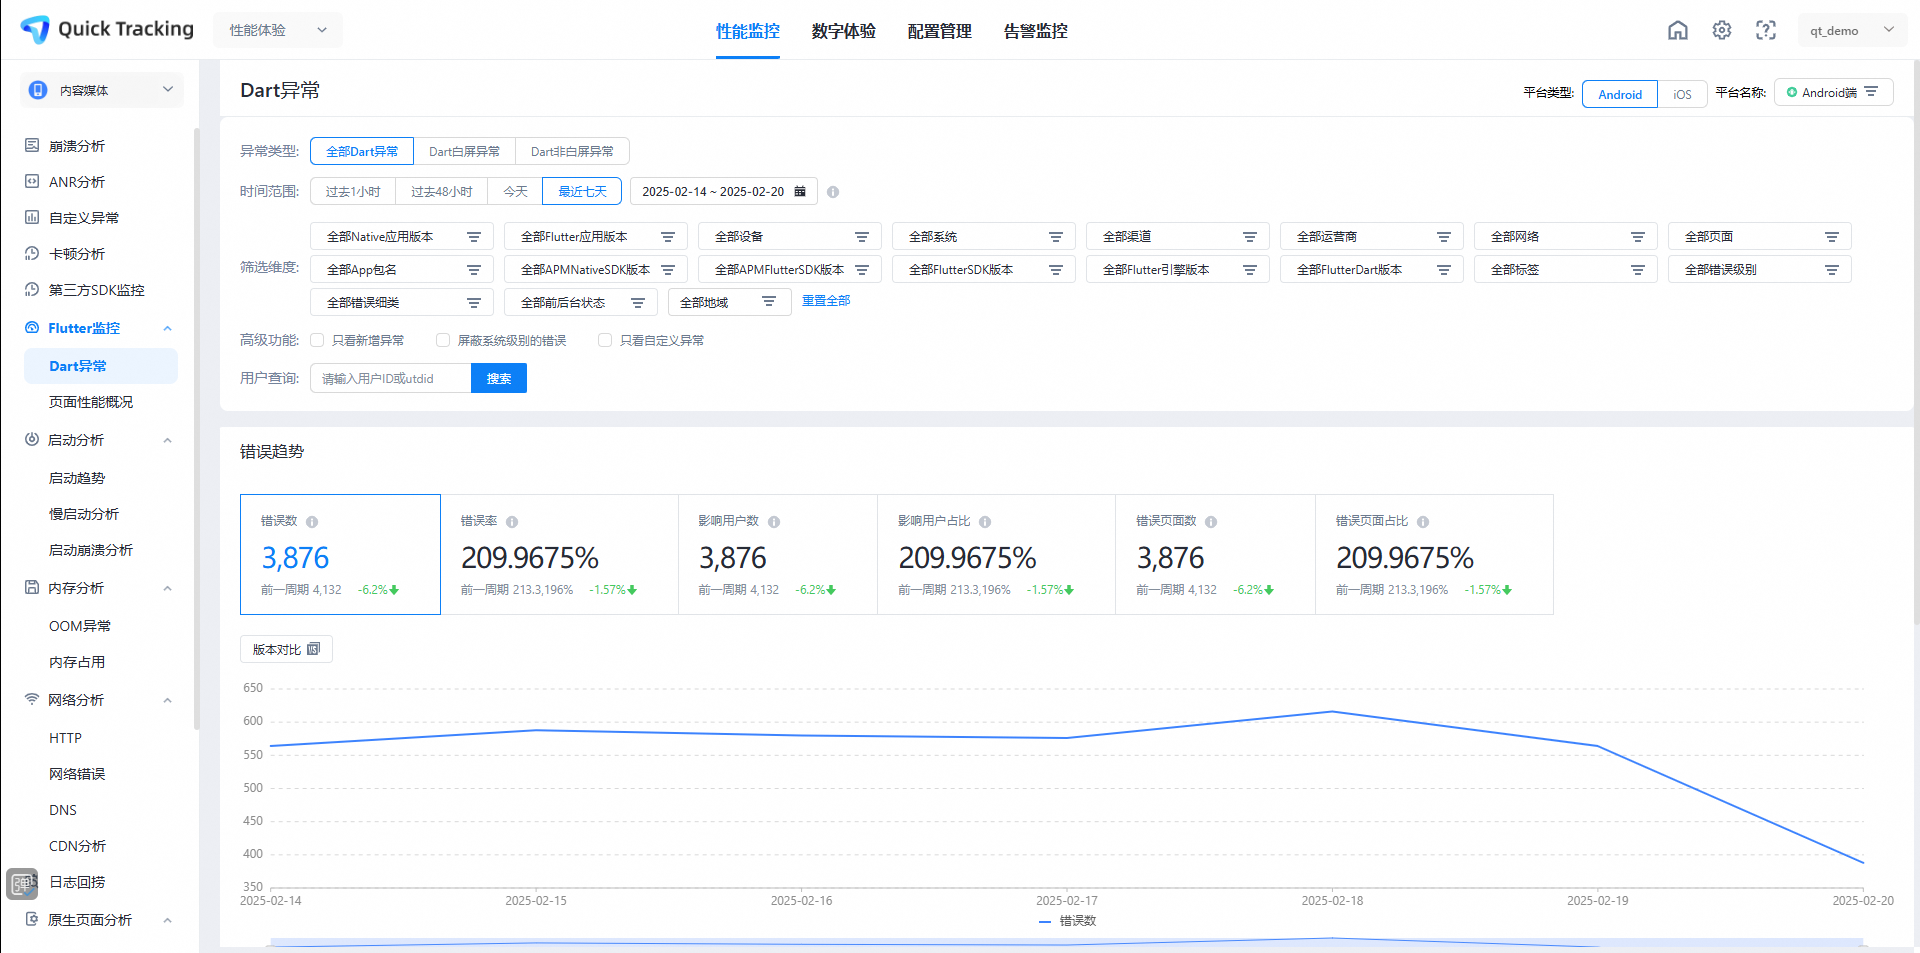
Filter box: You can flexibly filter time ranges, dimensions, or other advanced features.

Error Trend: displays the number of errors, error rate, number of affected users, proportion of affected users, number of error pages, and proportion of error pages for Dart exceptions
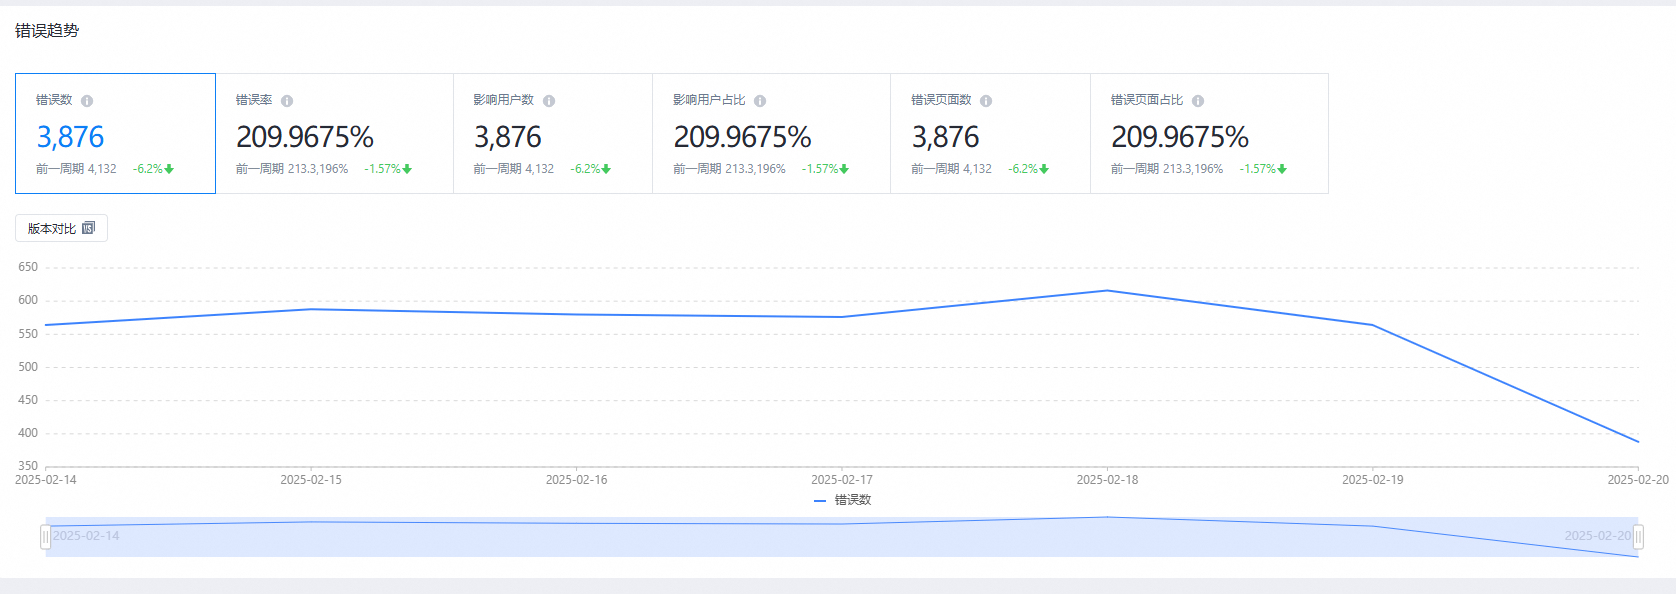
* You can set whether ignored errors are counted in the configuration management-switch and sampling configuration. If the configuration is not counted, the large card data here will not include ignored errors *
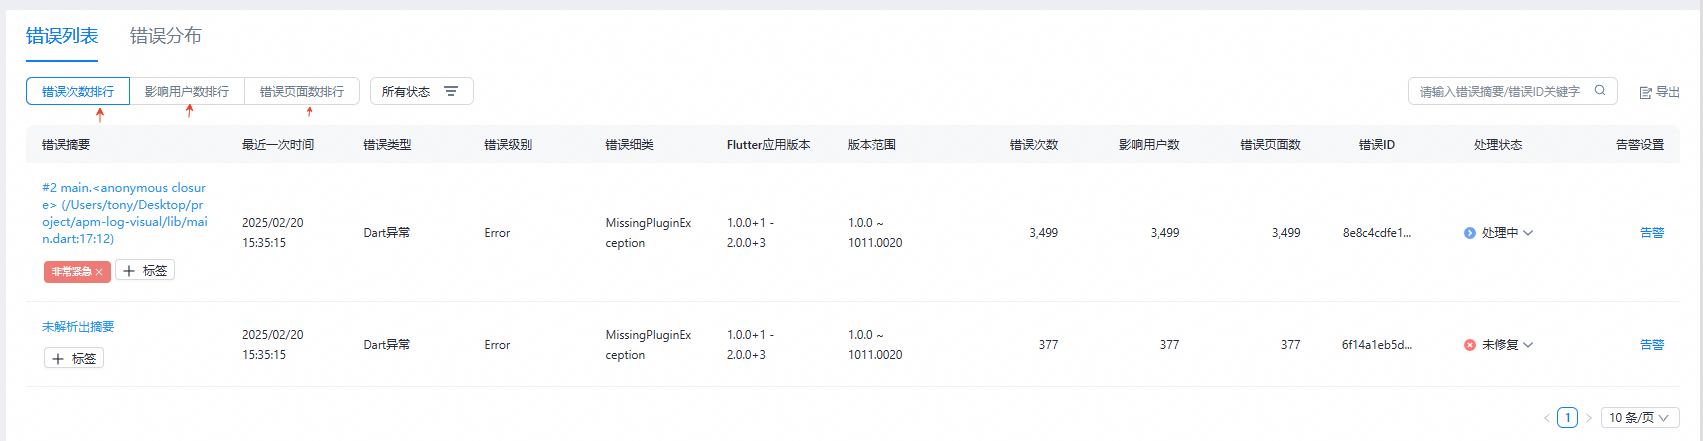
The error list can be viewed in three dimensions: the ranking of the number of errors, the ranking of the number of affected users, and the ranking of the number of error pages.
The list displays the error summary, last time, error type, error level...
Error distribution supports multiple dimensions such as Native application version distribution, Flutter application version distribution, device distribution, and system distribution. You can view the top 5 dimensions or click Details to view all rankings. 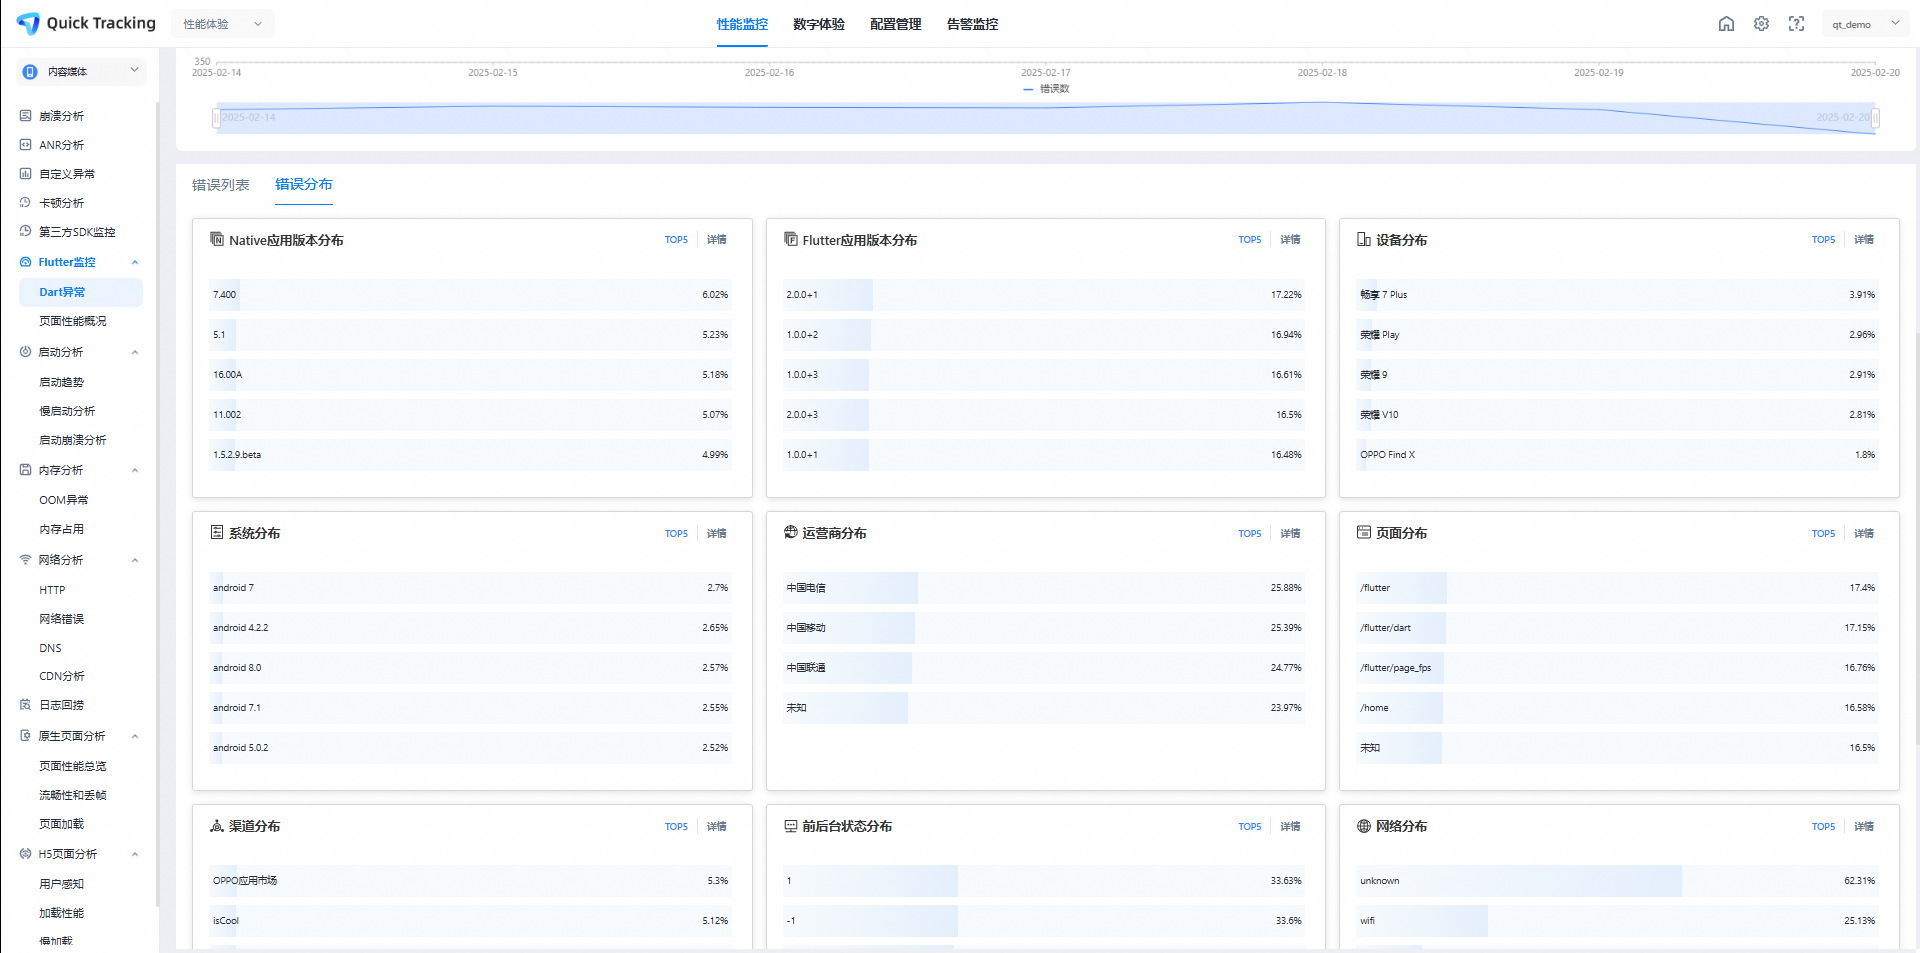
The details of the error log are displayed in the error details. Errors aggregated in one sheet are displayed in one page
The large-letter card shows the wrong basic information.
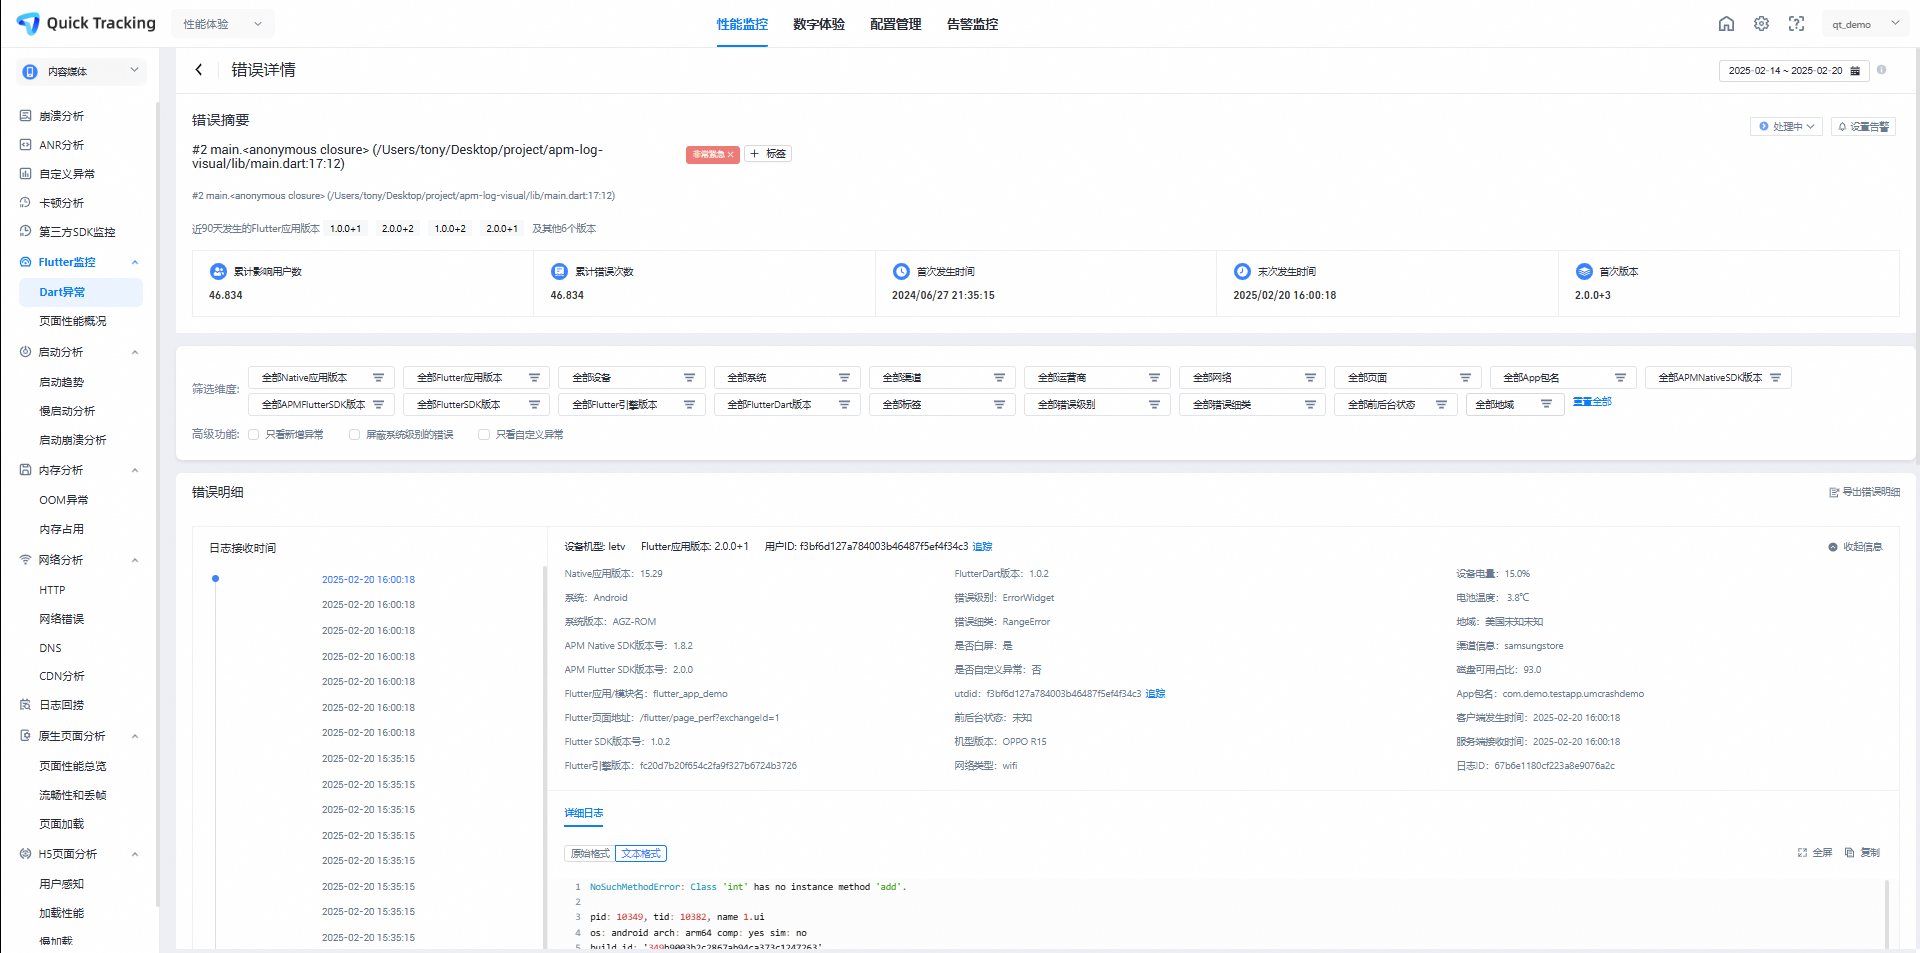
Show detailed logs in error details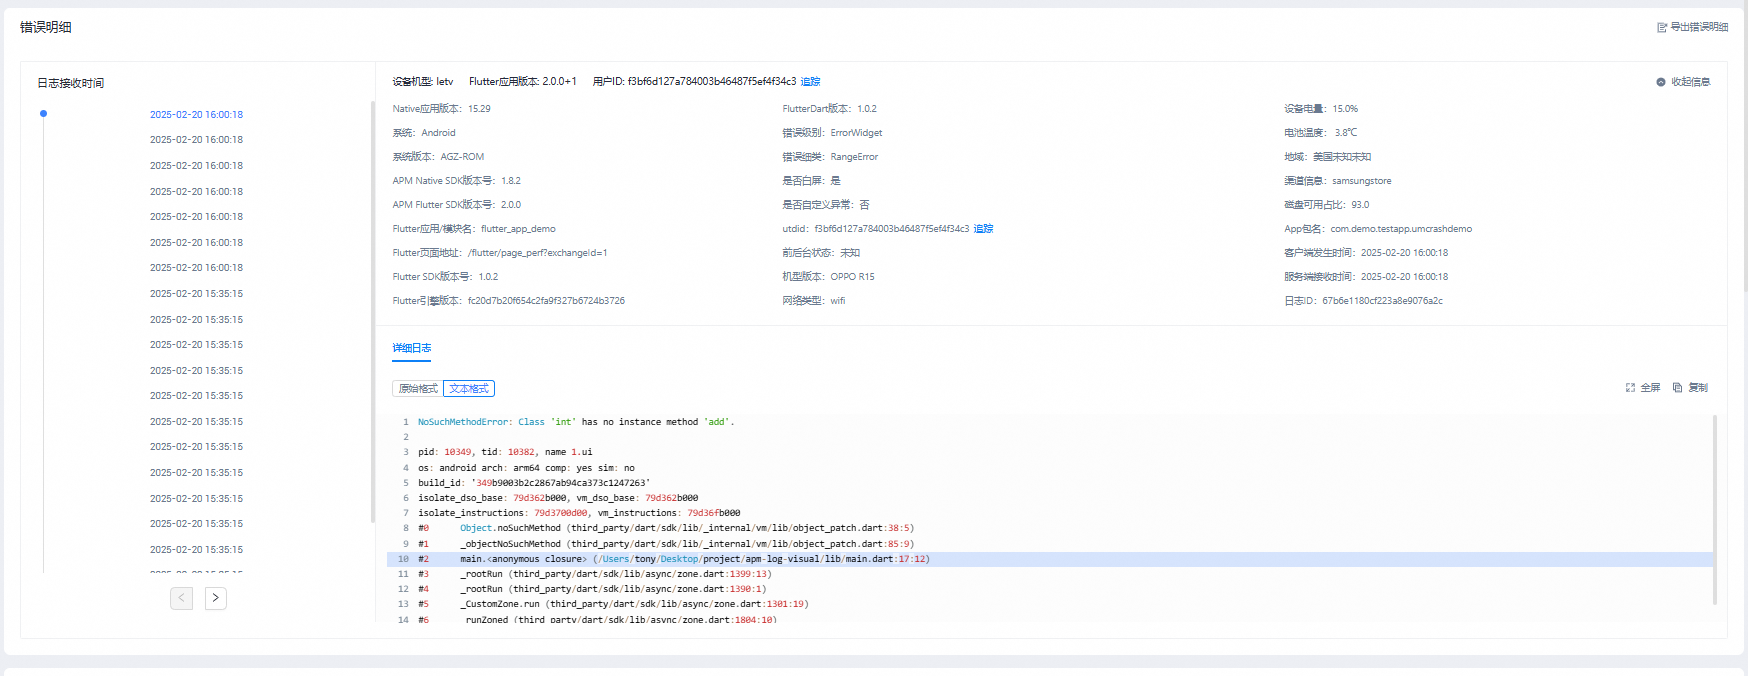
The lower part of the page displays the trend of errors, as well as error comments and change records.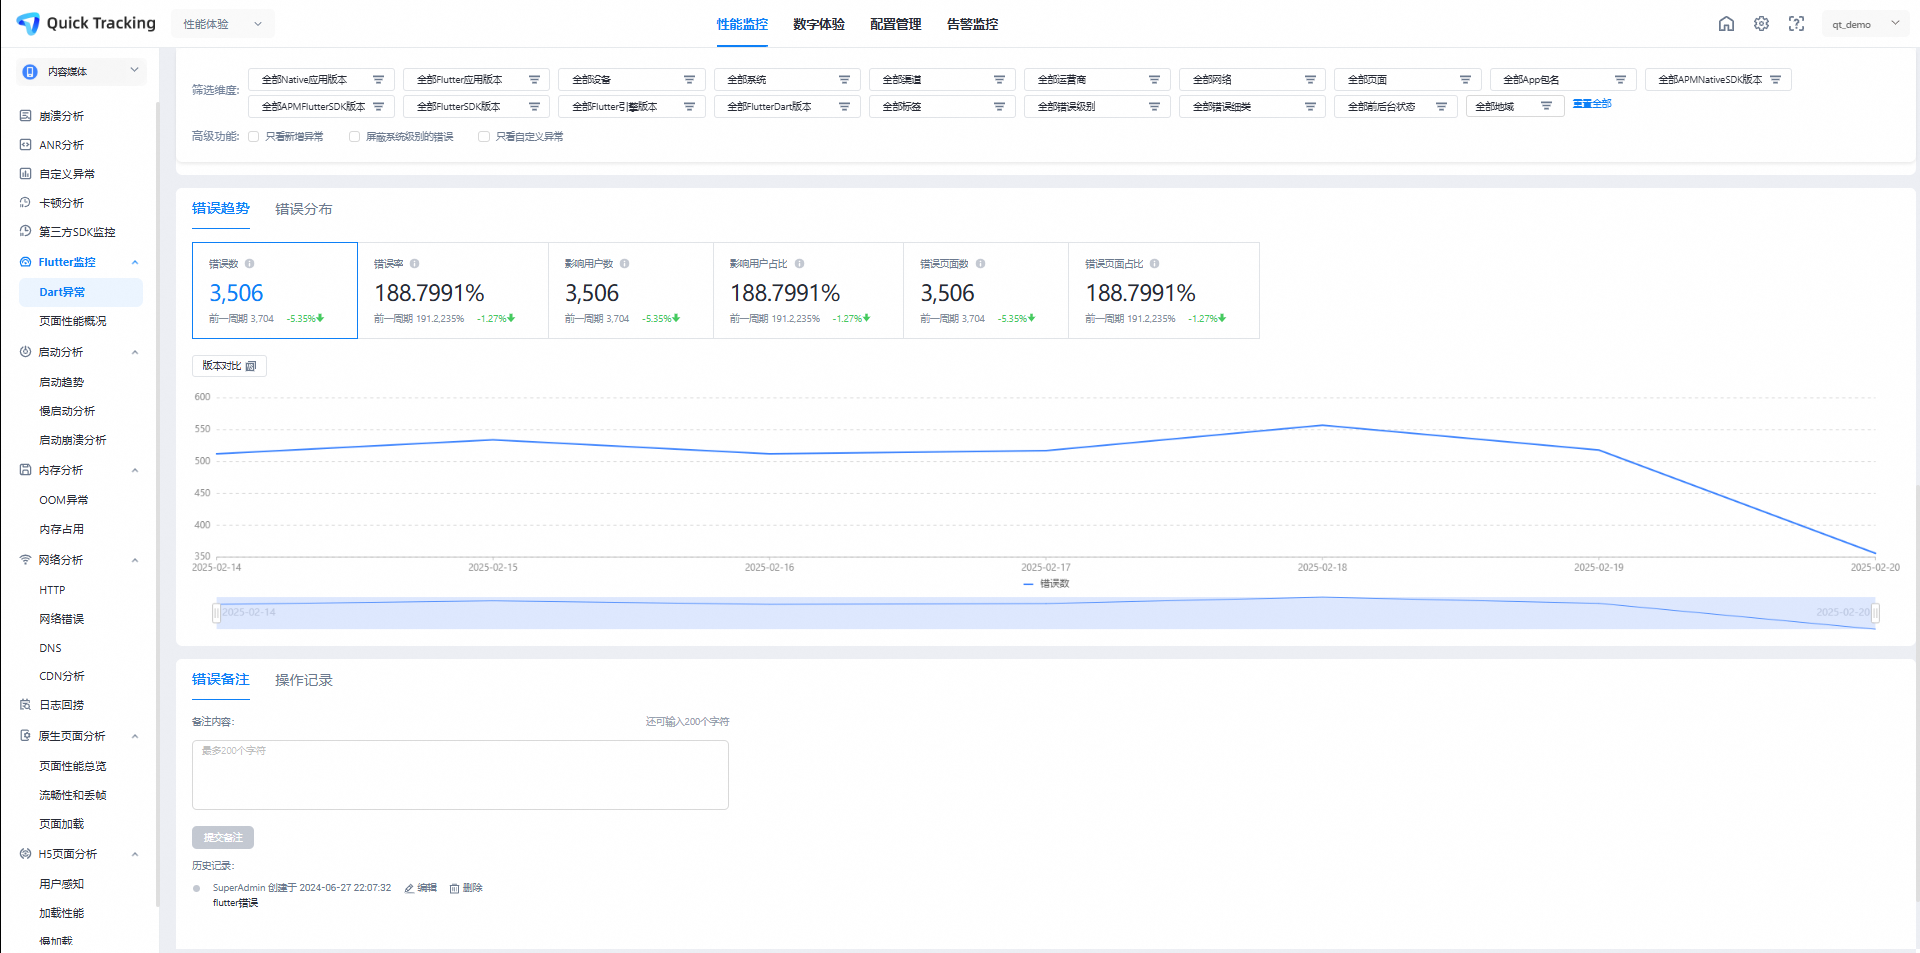
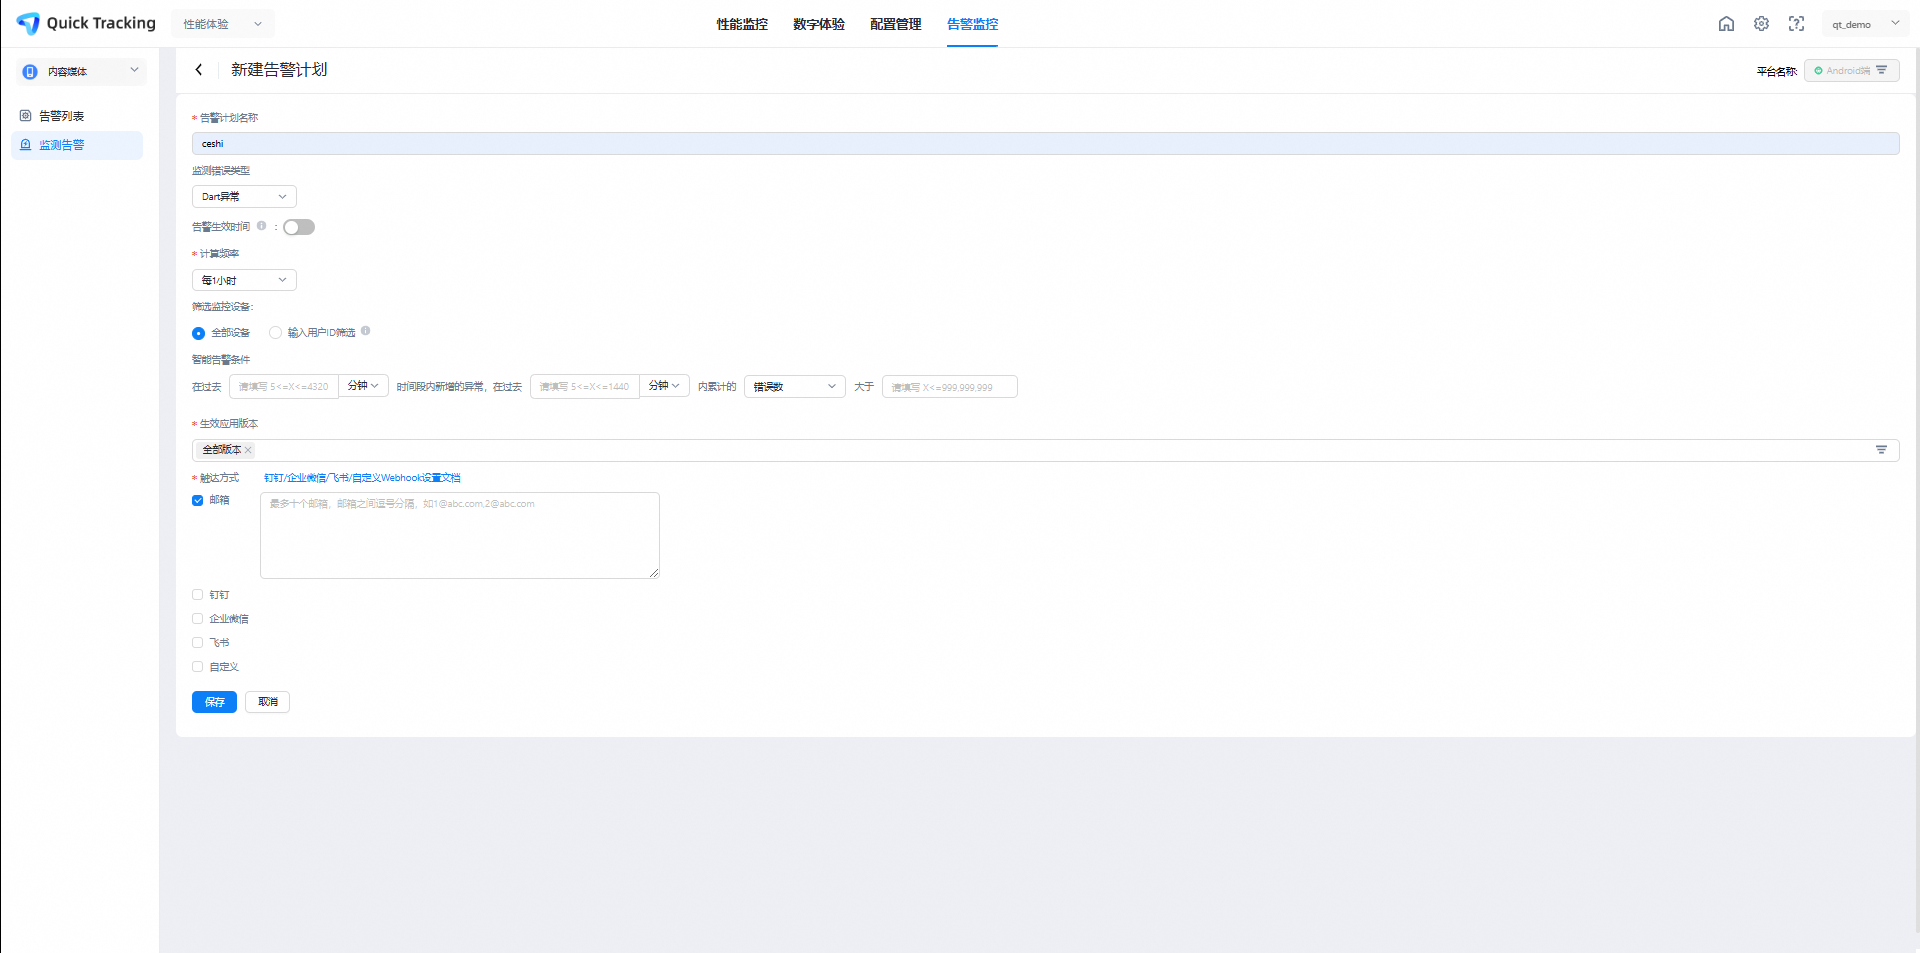
You can create an alert schedule in Alert Monitoring-Monitoring Alerts and select Dart Exceptions. Alternatively, you can select a single Dart exception from the error list to generate alerts.