The system provides monitoring and analysis of the performance overview of Flutter pages, and views the statistical data and trend charts of indicators such as page first drawing time FP, page first valid content drawing time FCP, and page interactive time TTI.
Module location: The function is located in Performance Monitoring-Flutter Monitoring-Page Performance Overview
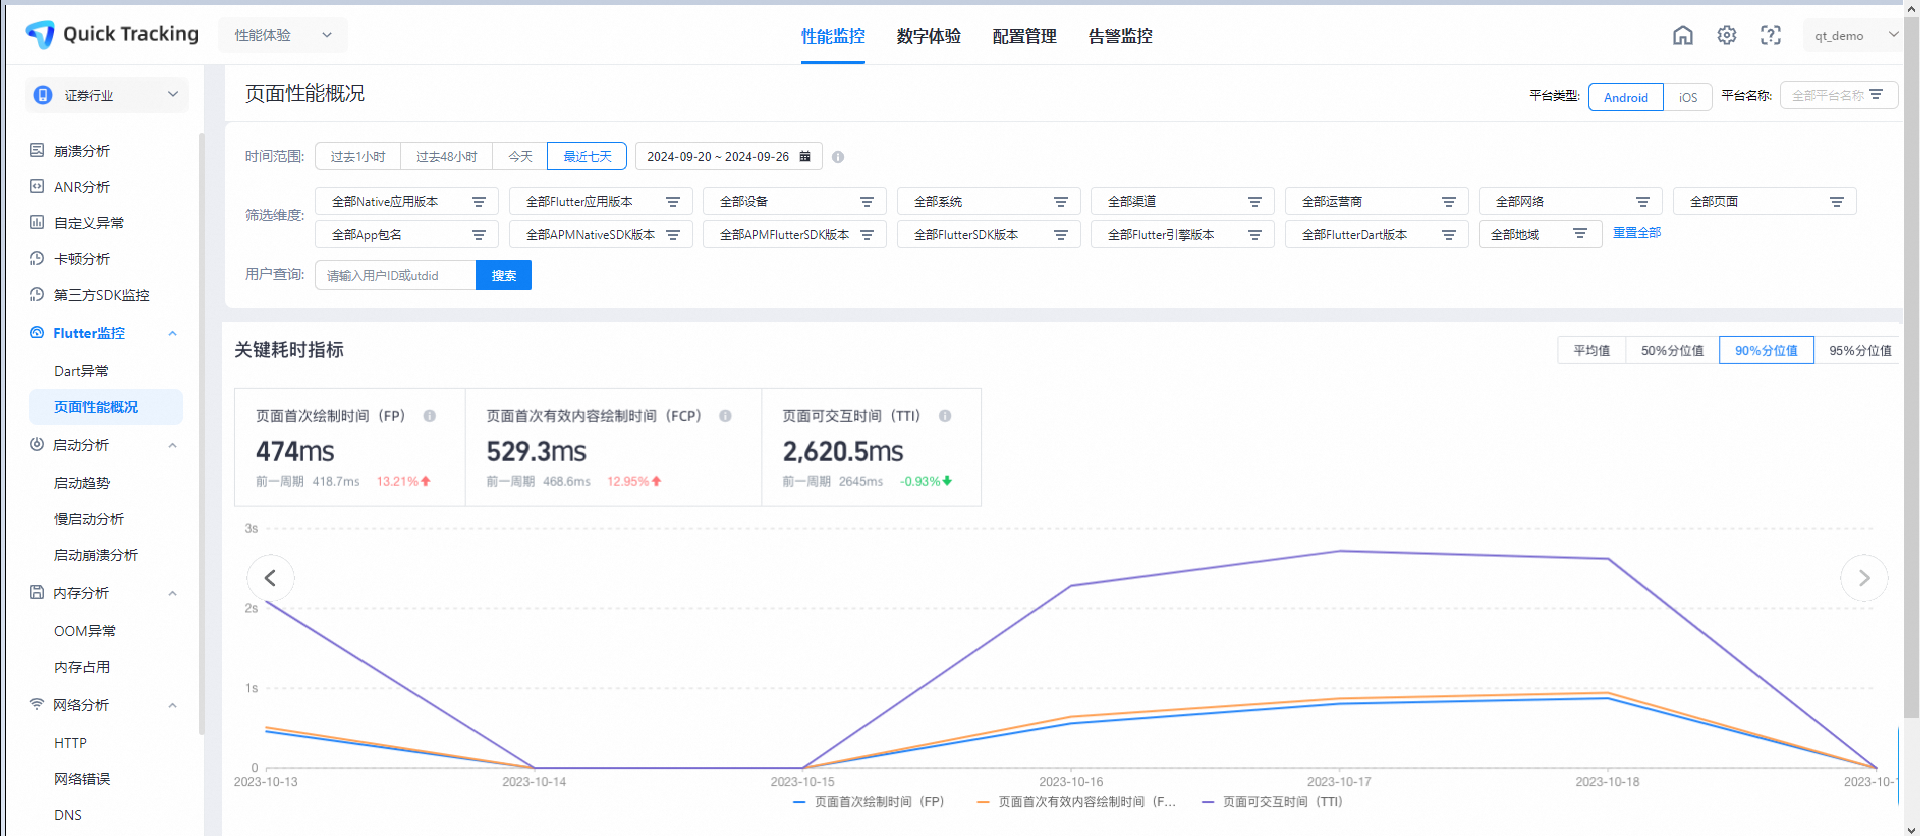
Filters
Filter box: You can flexibly filter time ranges, dimensions, or other advanced features.

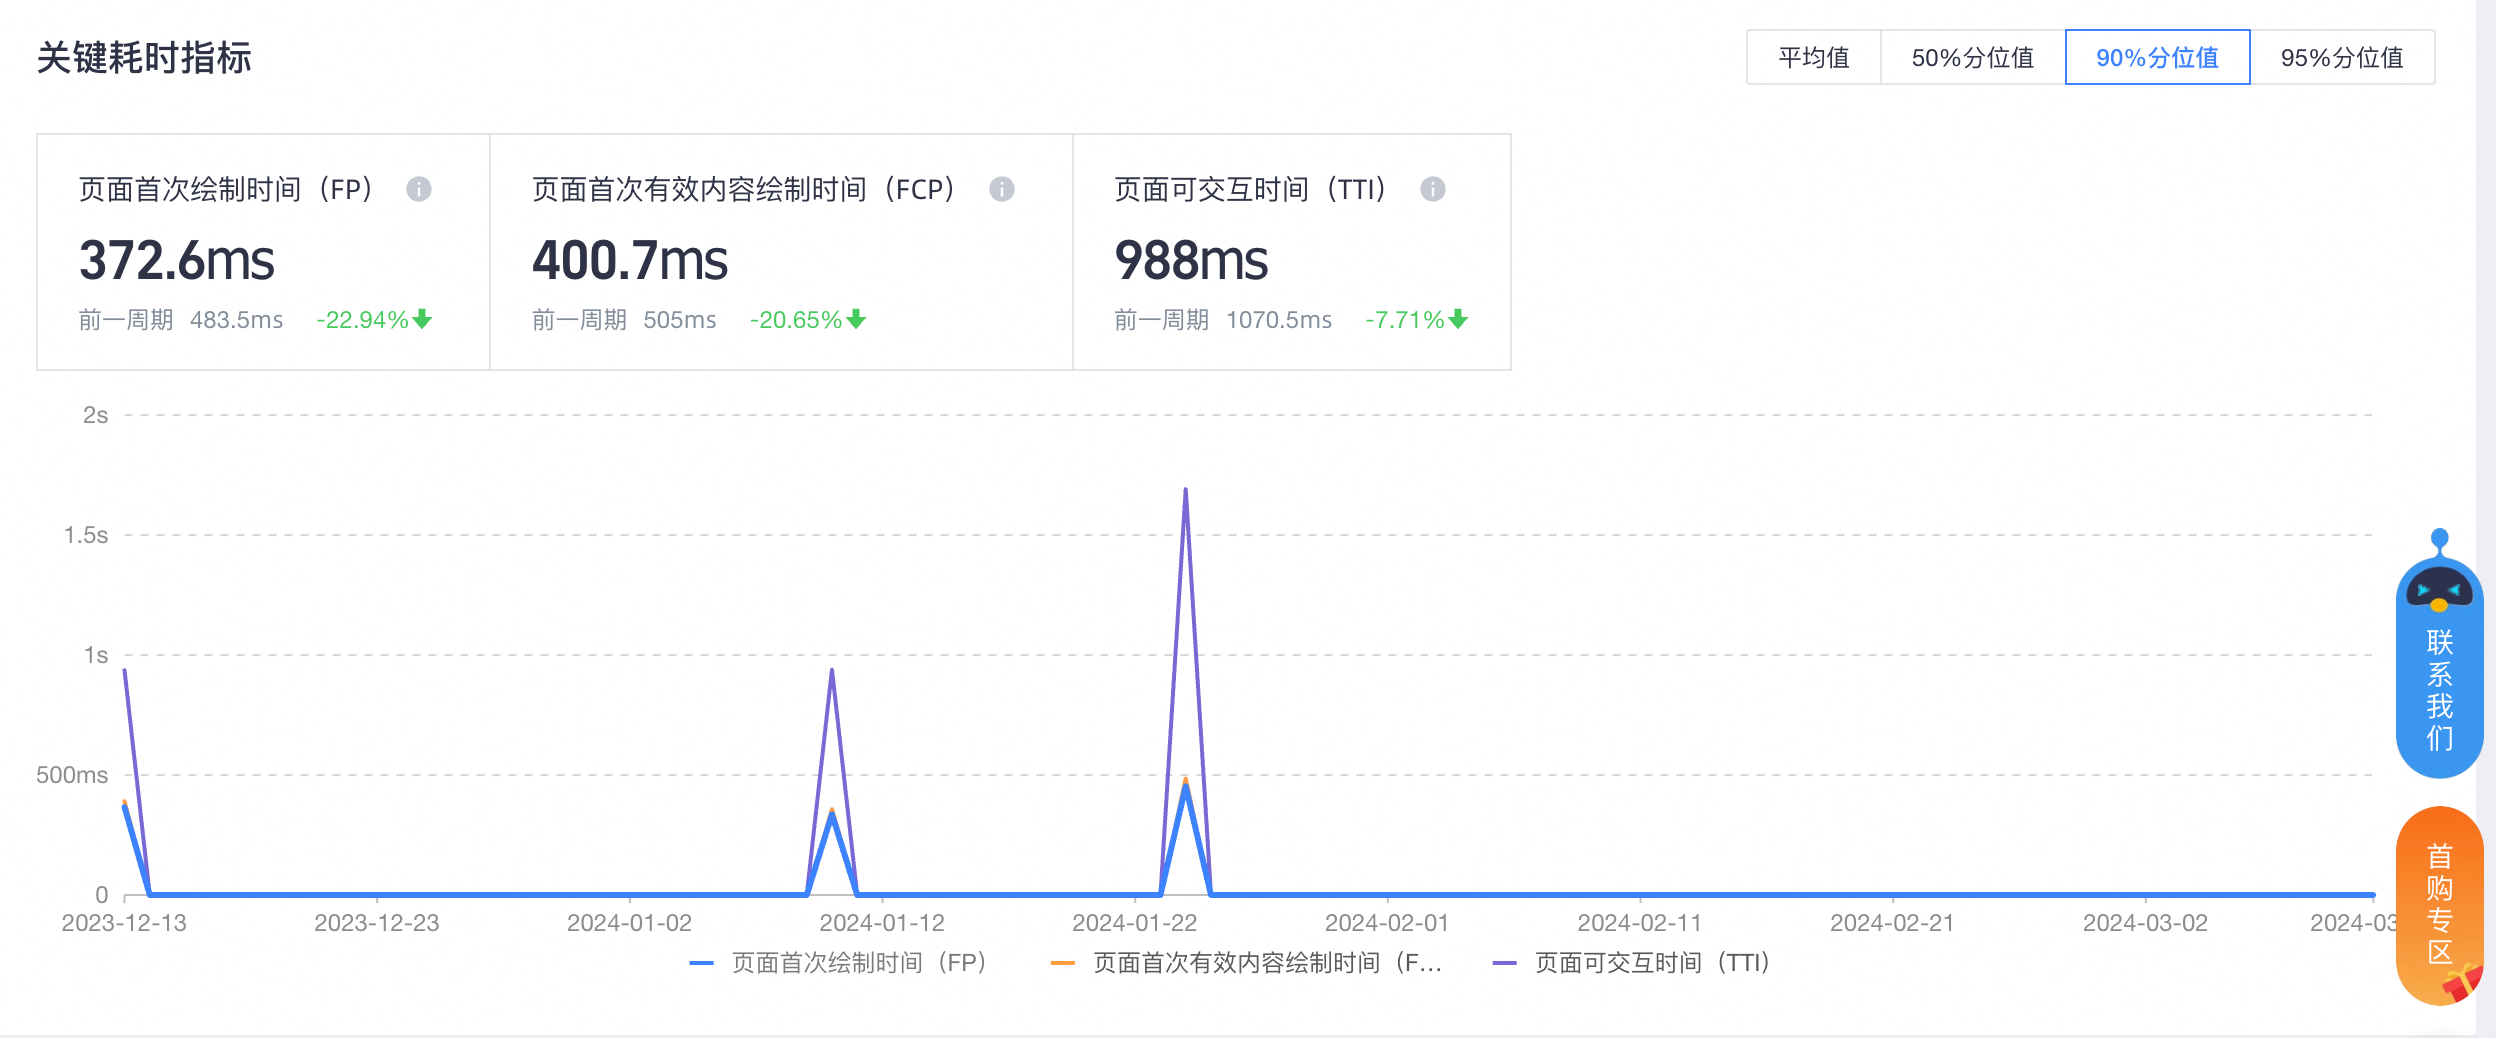
Key Time-consuming Metrics
The change of key time can be counted in four different ways: average, 50%-digit value, 90%-digit value and 95%-digit value.
The three indicator cards in the interface are:
Time for First Drawing (FP): The time taken to draw the first frame from the route
The first valid content drawing time (FCP) of the page: the time taken to draw the first frame of the content from the route jump
TTI: The amount of time that the page can interact with each other.
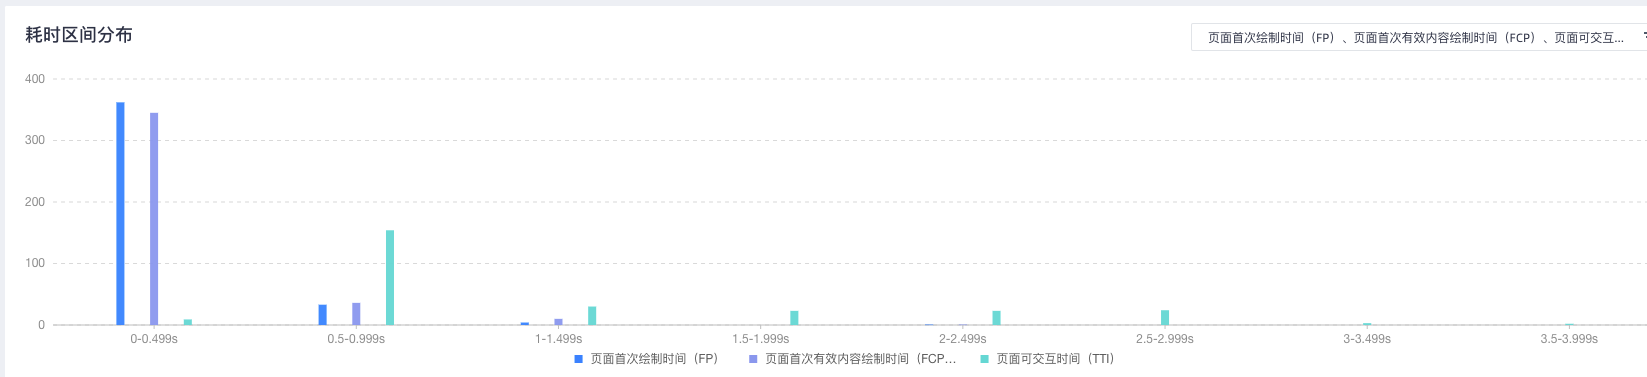
Time interval distribution
In this module, you can view the detailed distribution of FP, FCP, and TTI in different duration intervals. The metrics are switched in the upper right corner to support multiple selection.
Skip Rate Trend
In this module, you can view the Overview, Ring-over-Ring, and Trend charts of the FP Hop Rate, FCP Hop Rate, and TTI Hop Rate.
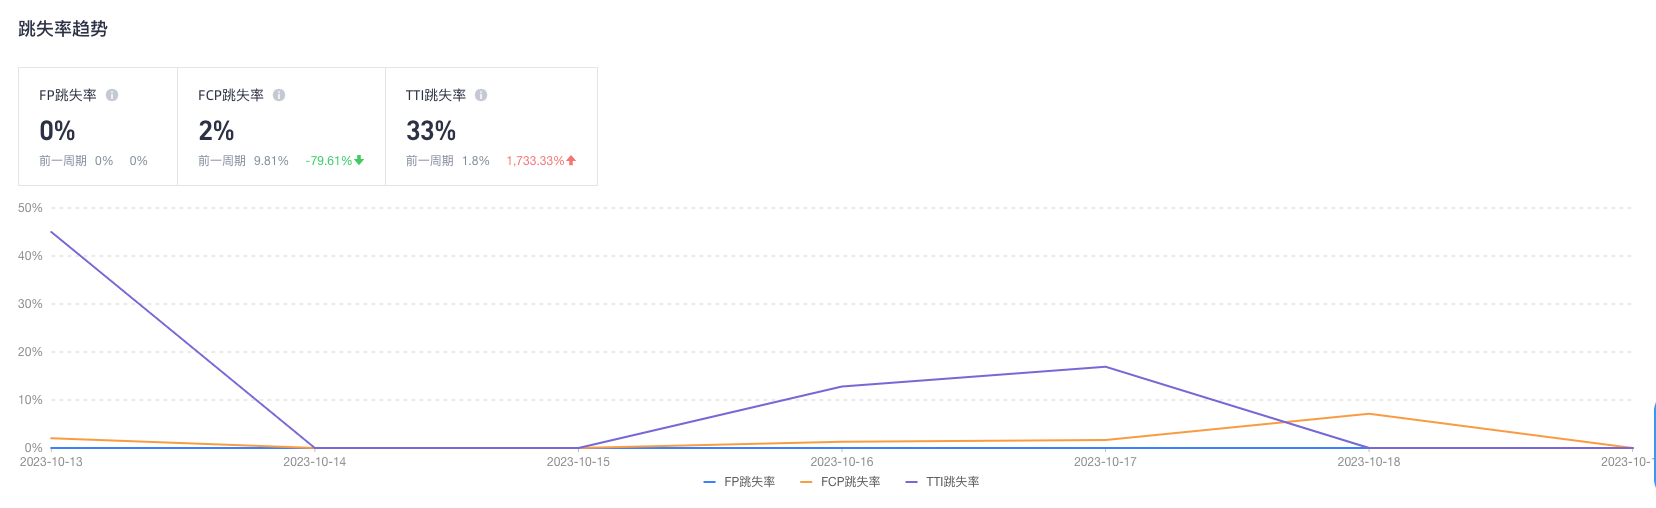
FP Hop Rate: Number of sessions that jump out of pages before FP reports /Total number of sessions
FCP Hop Rate: the number of sessions that jumped out of the page before the FCP report /the total number of sessions
TTI Hop Rate: Number of sessions that jump out of the page before TTI reporting /Total number of sessions
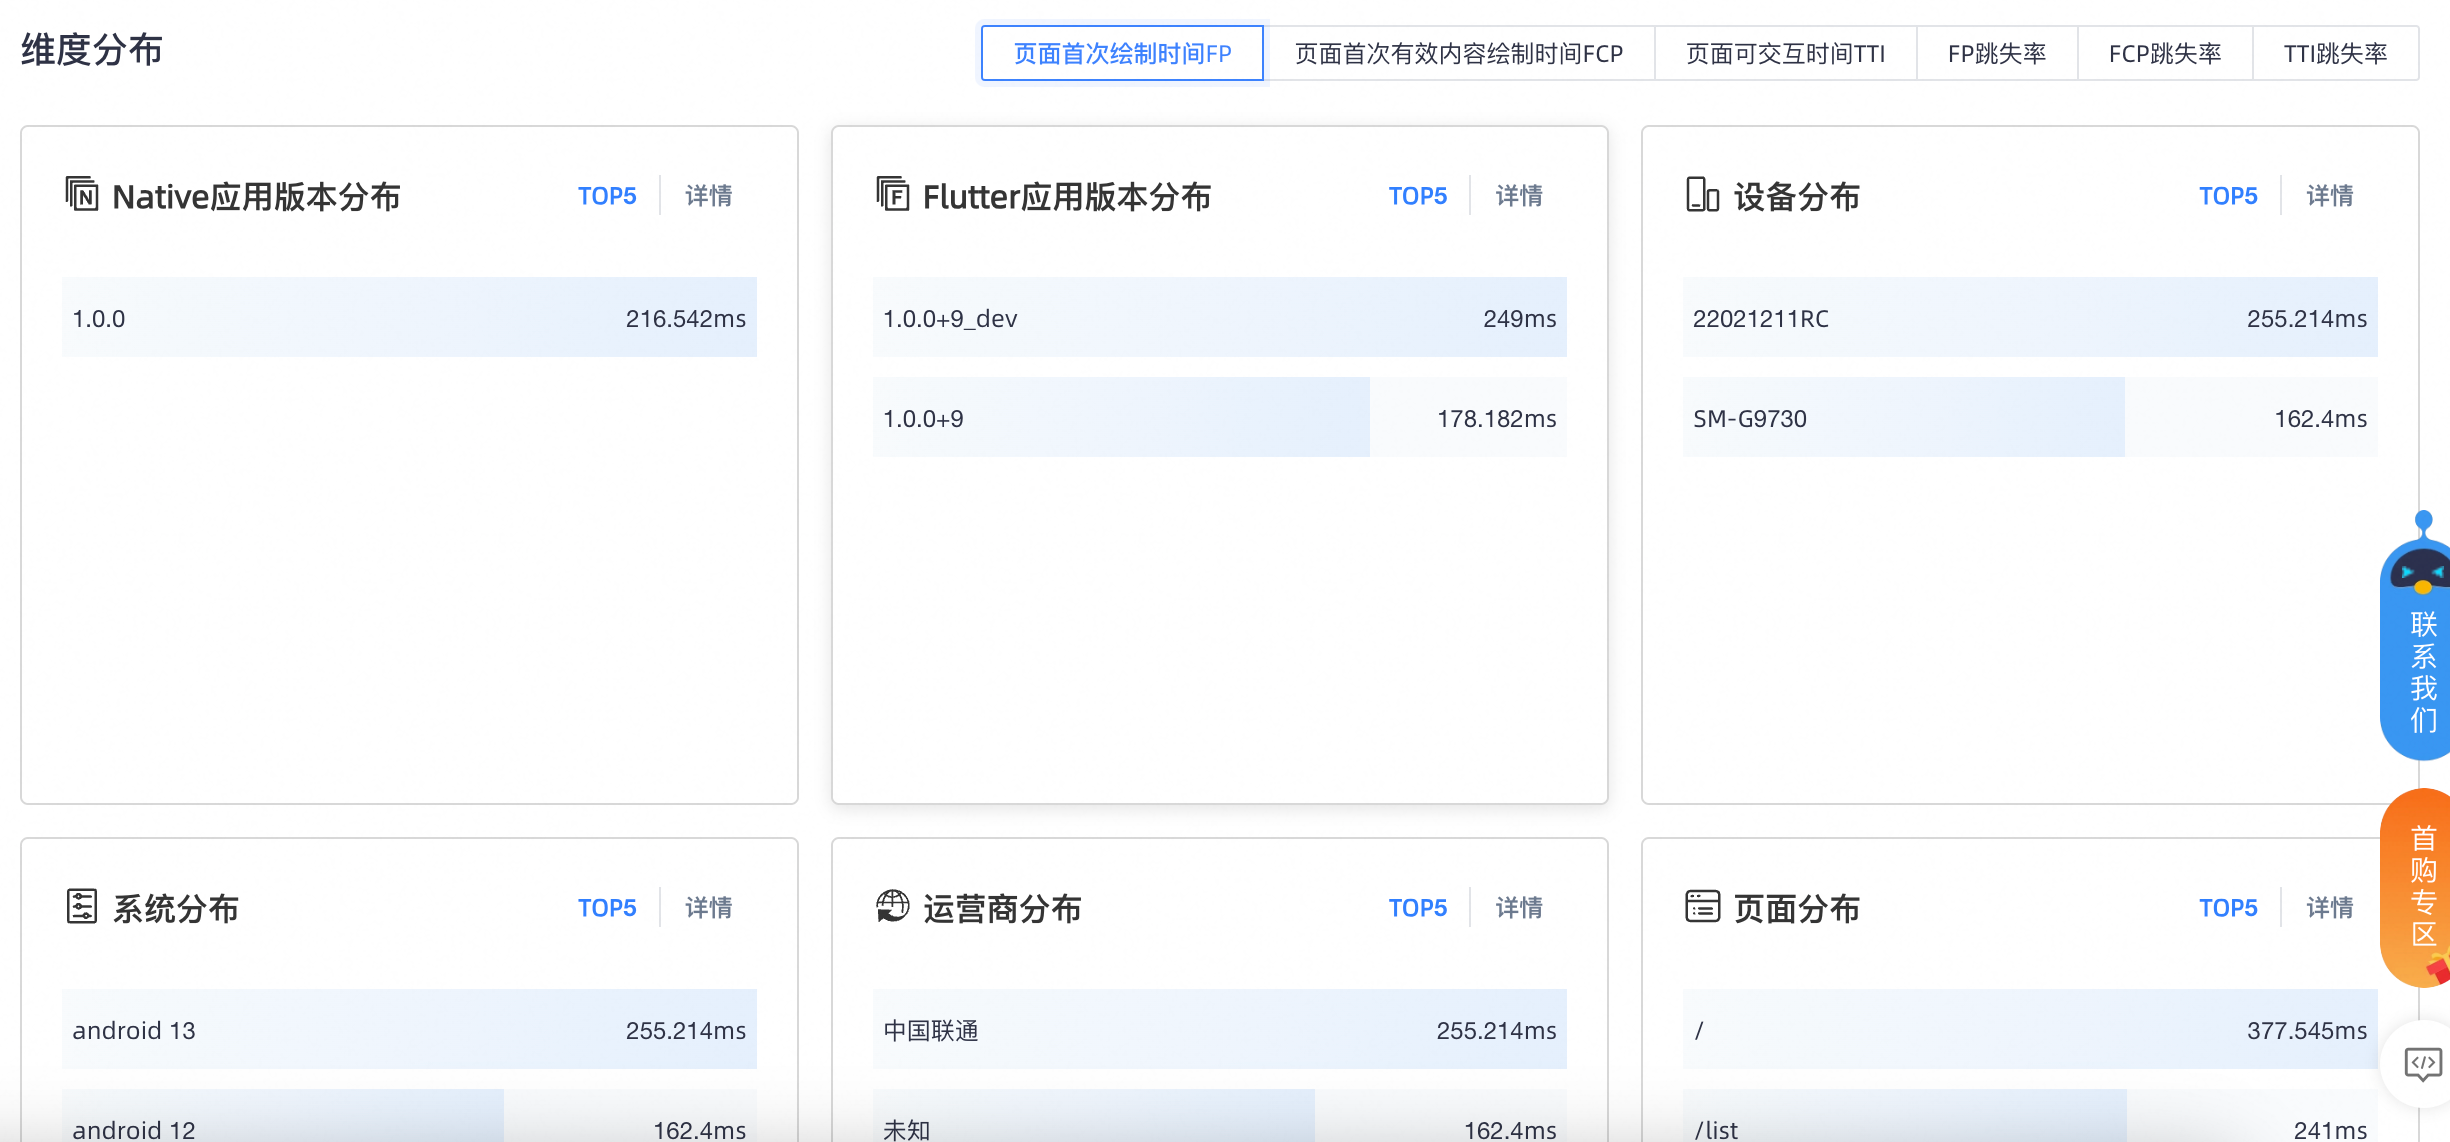
Dimensional Distribution
You can view the distribution of different metrics in multiple dimensions. In the upper right corner, you can switch metrics, including FP, FCP, TTI, FP hop rate, FCP hop rate, and TTI hop rate.
You can view the top 5 data in each dimension, including Native application version distribution, Flutter application version distribution, device distribution, system distribution, carrier distribution, page distribution, channel distribution, network distribution, and region distribution.