Network traffic analysis
This topic describes how to view resolution data in the HTTPDNS console.
Overview
After you integrate HTTPDNS, the Network Traffic Analysis page displays statistics for all domain name resolution requests by default. You can view statistics by dimensions such as domain name, date, and operating system.
Statistical data is updated approximately every hour.
Procedure
Log on to the EMAS console.
In the navigation pane on the left, choose Resolution Management > Network Traffic Analysis.
Click Valid Resolutions or Invalid Resolutions to view the details.
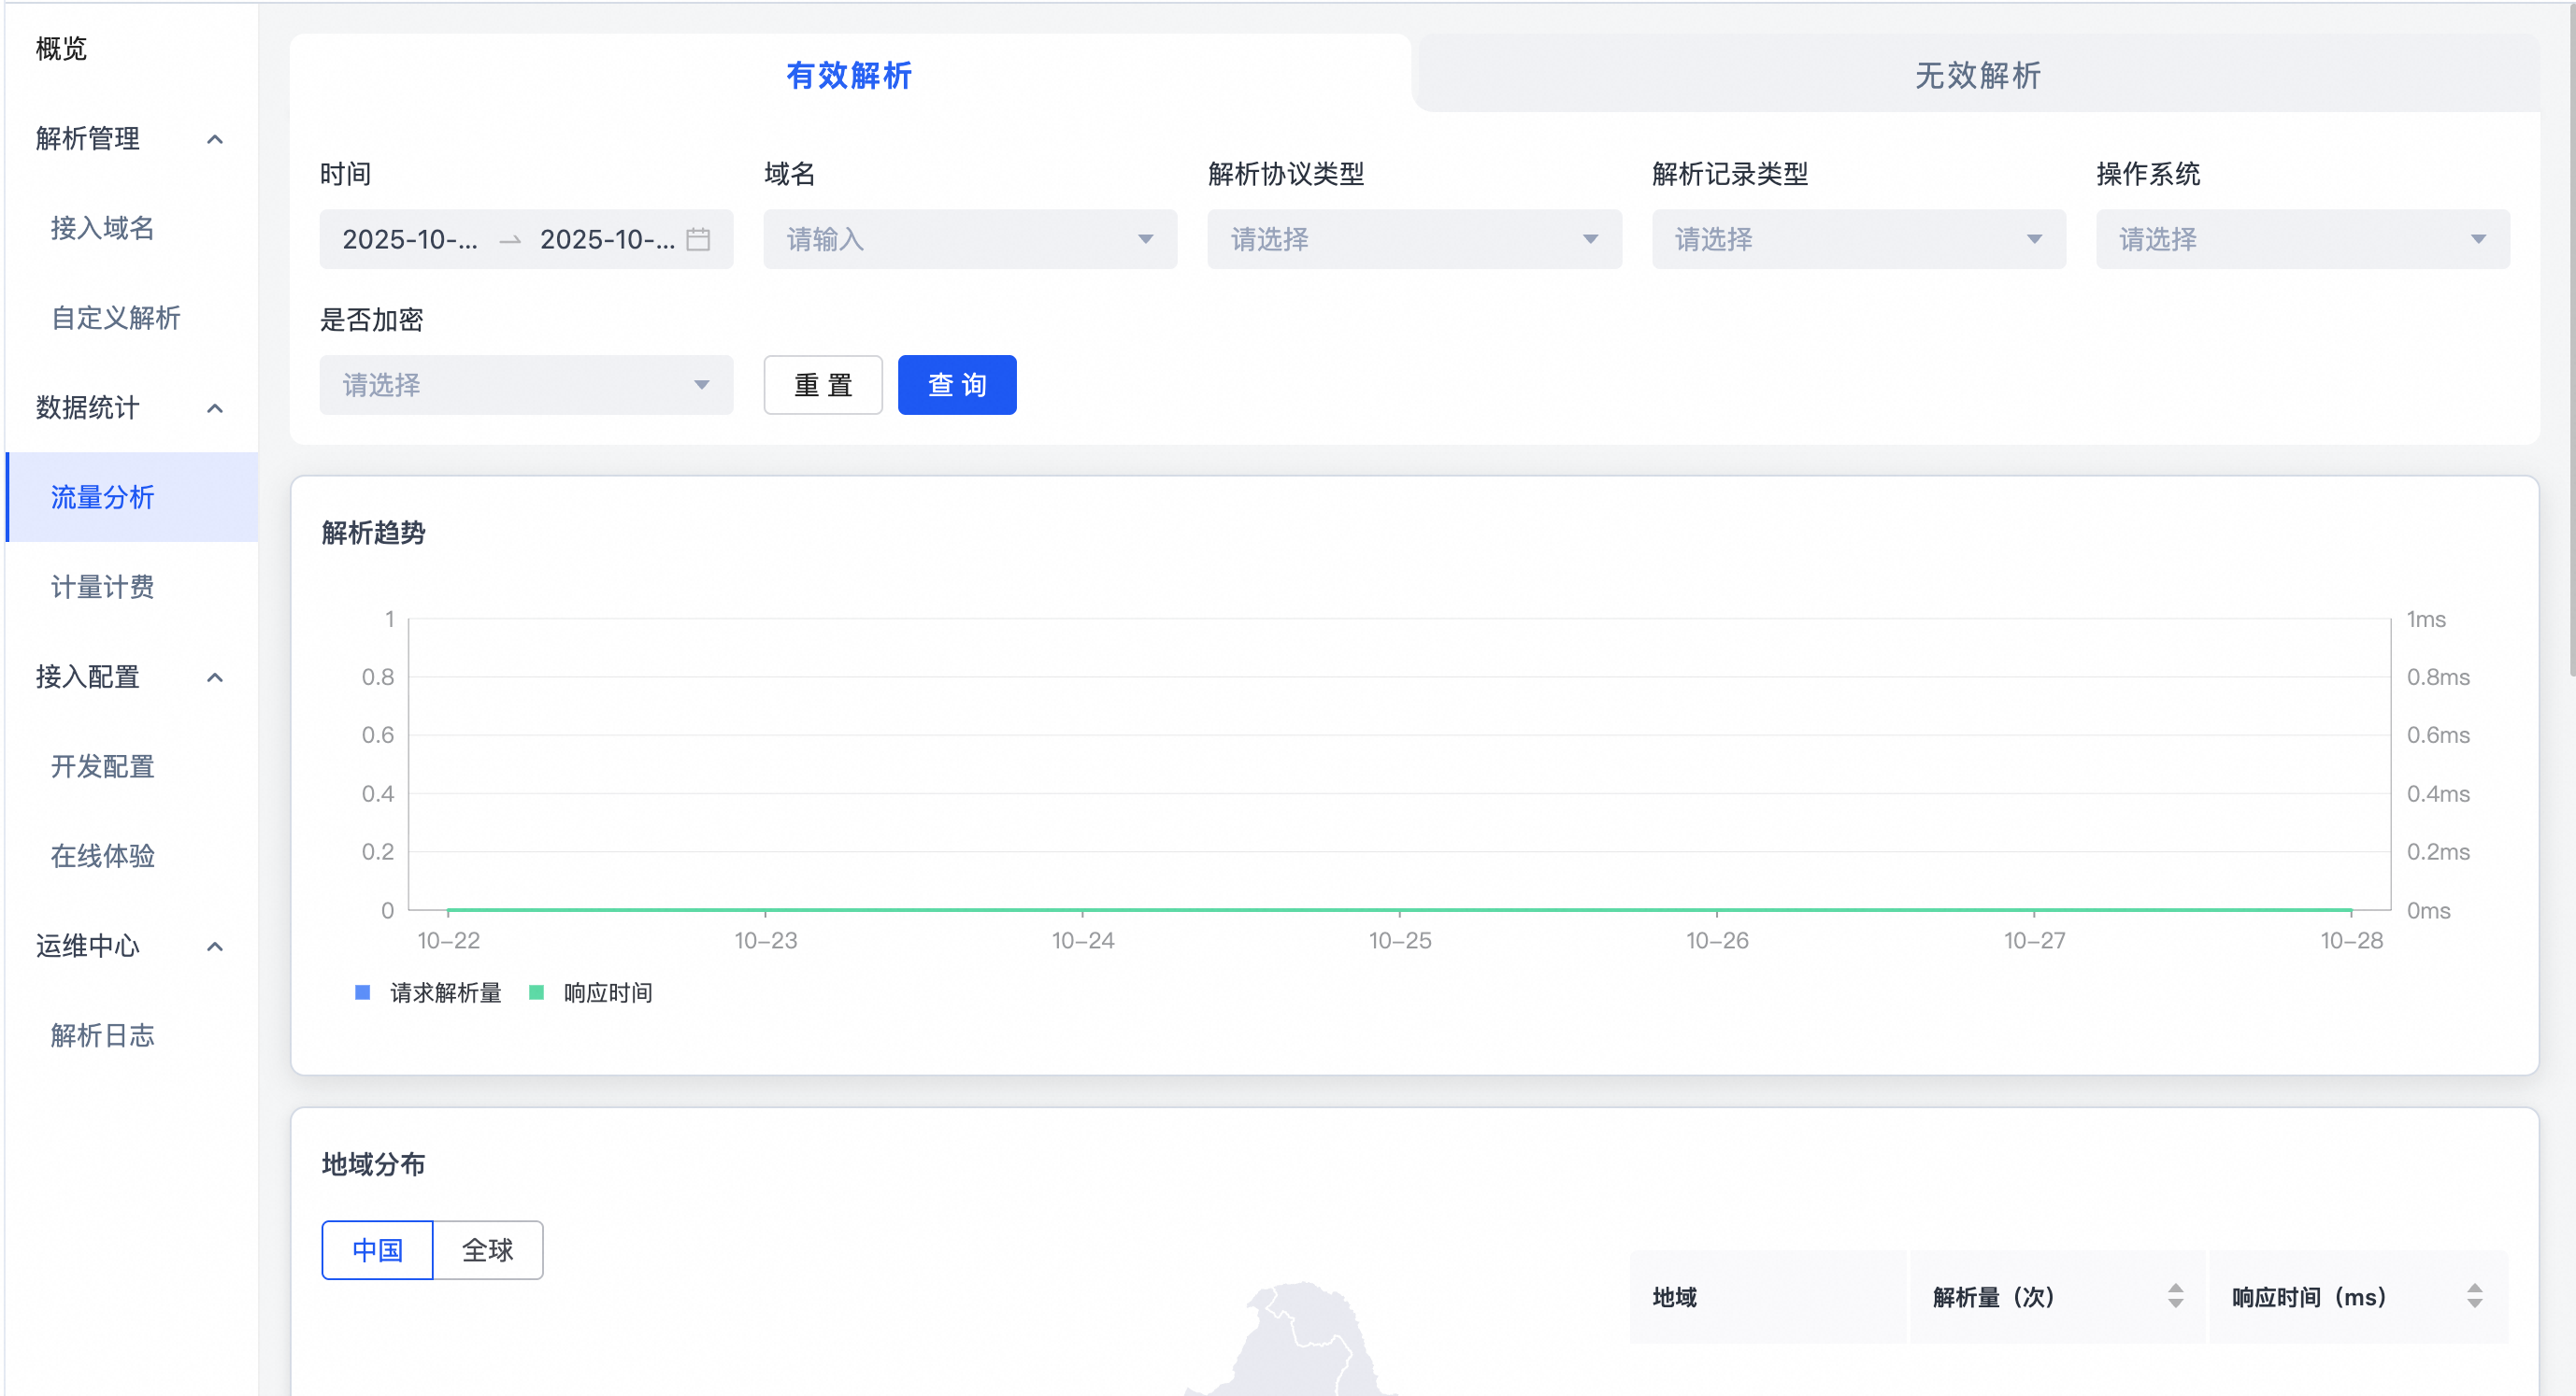
Successful parsing
This section displays statistics for the resolution of domain names that are in your domain name list and have DNS records, based on your filter criteria.
Data Metric | Description |
Response time | The time from when a domain name resolution request is accepted to when a response is returned. The unit is ms. |
Region distribution | Shows the resolution volume and response time for domain names in each region. You can drill down to the city level for regions in mainland China. For global regions, you can only drill down to the country level. |
Domain name resolution details | Shows domain name resolution details based on the filter criteria. You can download the current filtered dataset. |
Invalid parsing
This section displays data for invalid resolutions based on your filter criteria.
Data Metric | Description |
Invalid resolution reason distribution | Displays the percentage distribution of reasons for invalid resolutions.
|
Top 10 domain names not in the domain name list | Displays the 10 domain names that are not in your domain name list and have the highest number of resolution requests. |
Top 10 domain names with no DNS records | Displays the 10 domain names that have no DNS records and the highest number of resolution requests. |
Top 10 invalid domain names | Displays the 10 invalid domain names with the highest number of resolution requests. |