Expert system analysis reports
1. Expert system
The Expert System is an intelligent analysis system in Asight Systems that helps identify common performance issues. It analyzes events in a report and provides suggestions for more effective performance optimization.
1.1 Use the expert system in the GUI
In the GUI, switch to the Expert System page using the tab bar at the bottom:
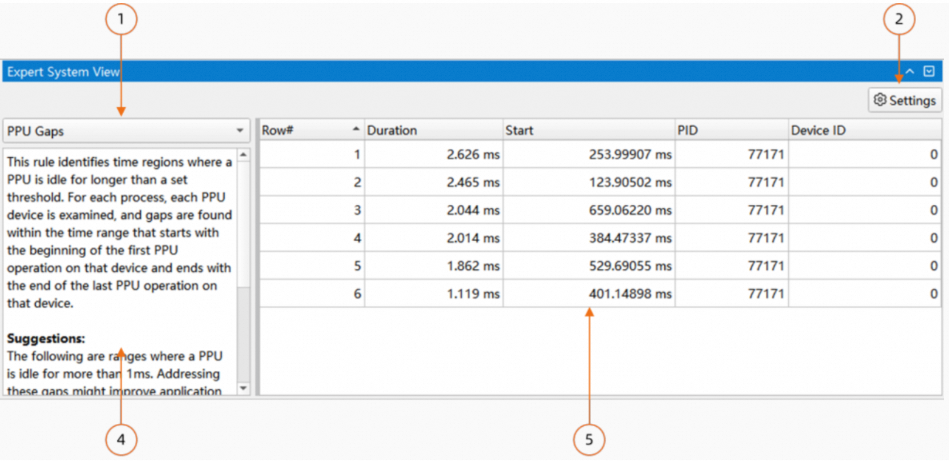
The rule list, for selecting analysis rules.
The rule parameter configuration dialog, for changing the current rule's configuration.
A description of the current rule and its optimization suggestions.
Export the analysis results for the current rule from the context menu.
1.1.1 Set the analysis time range
Set a time range to limit the Expert System's analysis to events within that period. You can do this in one of two ways:
Specify a time range using the filter feature in the Timeline View.
Use the NVTX parameter in the rule parameter configuration dialog to set the time range using the start and end points of an NVTX range, as shown below:
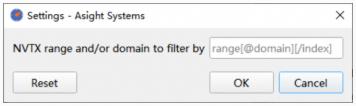
The format for specifying an NVTX is
range[@domain][/index], where:rangeis the name of the NVTX.domainspecifies the domain to which the NVTX belongs.indexspecifies which NVTX to select if multiple NVTXs have the same name.
1.1.2 Navigate to the timeline view
For some rules, you can navigate to the Timeline View from the context menu.
1.2 Use the expert system from the CLI
You can run the asys analyze subcommand to use the Expert System to analyze an .asysrep file and generate a series of analysis reports. The asys analyze subcommand has the following syntax:asys analyze [option] <file.asysrep>
1.2.1 Specify an analysis rule
The asys analyze subcommand supports multiple analysis rules. To view a detailed description of all analysis rules, run asys analyze --help-rules ALL. Use the --rule option to specify the analysis rule. You can use this option multiple times or specify multiple rules in a comma-separated list. If you do not specify an analysis rule, the system uses the default rule to generate the report. For example, to generate a report using the ppu_gaps and ppu_time_util analysis rules:
asys analyze --rule ppu_gaps,ppu_time_util report.asysrep1.2.2 Specify the report output format
Use the --format option to specify the output format for the statistical report. To view the supported formats and related help information, run asys analyze --help-formats ALL.
column: The default format for terminal output. This format prints the report as a list and is easy to read.csv: The default format for file output. This format prints the report in CSV format, which can be easily processed by other applications.
1.2.3 Specify the report output destination
Use the --output option to specify the output destination. Three output destinations are supported: print to the console, output to a file, or pipe to a command. By default, the report prints to the console. Specify --output % to print to the console. For example:
asys analyze --output % --rule ppu_gaps report.asysrep
When you specify --output ., the report is saved to the same directory as the source .asysrep file. asys generates a filename based on the report name, analysis rule, and output format. The filename format is <report_name>_<rule_name>.<format>. For example, the following command uses the --output . option to generate a ppu_gaps analysis report from report.asysrep in the same directory. The output filename is report_ppu_gaps.csv.
asys analyze --output . --rule ppu_gaps report.asysrepTo post-process the output with another command, specify --output @post_command. This pipes the analysis report's content to the specified command. For example, the following command uses grep to find results containing the keyword 1142417:
asys analyze --output "@grep 1142417" --rule ppu_gaps report.asysrep1.2.4 Specify the analysis time range
Use the --filter-time option to specify the time range for the analysis. The format is start_time/end_time, where the unit is nanoseconds. The time is an offset from the start of data collection. You can omit either the start time or the end time. For example, the following command analyzes trace data from the 10-second mark to the 20-second mark:
asys analyze --filter-time 10000000000/20000000000 --rule ppu_gaps report.asysrepYou can also use the --filter-hgtx option to set the analysis time range based on an HGTX annotation. If you specify the --filter-hgtx option, the system ignores the --filter-time option.
Use the --filter-hgtx option to specify the name, domain, and index of the HGTX range to match. The format is range_name@domain/index. If the matched HGTX range does not have a domain, you can omit @domain. Otherwise, you must specify @domain.
By default, asys uses the first matched HGTX range as the analysis time range. In this case, you can omit /index. To specify a range by index, use /index. The index is 0-based.
For example, the following command uses the first matched HGTX range named self_attention (which has no domain) to specify the analysis time range:
asys analyze --filter-hgtx self_attention --rule ppu_gaps report.asysrep
For example, the following command uses the ninth matched HGTX range (index 8) named pcclGroupEnd in the NCCL domain to specify the analysis time range:
asys analyze --filter-hgtx "pcclGroupEnd@NCCL/8" --rule ppu_gaps report.asysrep
Tips:
The timestamp information in the
asys analyzeoutput may vary depending on the--ruleoption. To standardize the timestamps, specify the--ts-normalize trueoption to convert timestamps to UTC time.The
asys analyzesubcommand supports the--ts-shiftoption to manually adjust the timestamp offset. You can use this option with the--ts-normalizeoption.
1.3 Expert system rules
1.3.1 PPU long idle period analysis
Description
Analyzes and summarizes long PPU idle periods (cpu bubbles) in an .asysrep report. Results are sorted in descending order by idle duration.
Required asys collection option: --trace hggc
Command-line usage:
asys analyze --rule ppu_gaps report.asysrep
When you select ppu_gaps with the --rule option, you can specify analysis parameters by appending colon-separated parameters. To view detailed help information, run asys analyze --help-rules ppu_gaps. Supported options include:
rows=<limit>: Limits the number of PPU idle period results in the output.gap=<threshold>: Sets the time threshold for a long idle period, in milliseconds.
For example, the following command analyzes long PPU idle periods with an idle time threshold of 20 ms and outputs the top 10 longest idle periods:
asys analyze --rule ppu_gaps:rows=10:gap=20 report.asysrep
The following is an example of a report:
Row#,Duration,Start,PID,Device ID,
1,1232895501,126020393150,1142419,6,
2,1219910832,126016153086,1142417,4,
3,1219804936,126017799911,1142416,3,
...
The following describes the columns in the ppu_gaps table:
Row# : Row number of the PPU gap
Duration [ns] : Duration of the PPU gap
Start [ns] : Start time of the PPU gap
PID : Process ID
Device ID : PPU device ID
Analysis Logic
A PPU is idle if it is not performing any of the following activities:
Executing a kernel
Executing a
memcpyormemsetoperationPerforming video encoding/decoding
The analysis calculates PPU idle periods on a per-process and per-PPU basis. If an idle period exceeds the threshold set by the gap parameter, it is added to the results. Results are sorted in descending order by idle duration.
1.3.2 PPU time utilization analysis
Description
Analyzes and summarizes the time-based utilization of PPUs in an .asysrep report. Results are sorted in ascending order by utilization.
Required asys collection option: --trace hggc
Command-line usage:
asys analyze --rule ppu_time_util report.asysrep
When you select ppu_time_util with the --rule option, you can specify analysis parameters by appending colon-separated parameters. To view detailed help information, run asys analyze --help-rules ppu_time_util. Supported options include:
rows=<limit>: Limits the number of low PPU utilization period results in the output.threshold=<percent>: Sets the percentage threshold for PPU busy time.chunks=<number>: Specifies the number of chunks to divide the total PPU active time into.
For example, the following command analyzes PPU time utilization with a utilization threshold of 60%, divides the active time into 80 chunks, and outputs the 20 results with the lowest utilization:
asys analyze --rule ppu_time_util:rows=20:threshold=60:chunks=80 report.asysrep
The following is an example of a report:
Row#,In-Use,Duration,Start,PID,Device ID,
1,0.000000,12411,124667294244,1142418,5,
2,0.000000,7648,124667369358,1142419,6,
3,0.000000,7648,124667378918,1142419,6,
4,2.425268,7092,124667285970,1142418,5,
5,4.258319,7092,124667278287,1142418,5,
...
The following describes the columns in the ppu_time_util table:
Row# : Row number of the chunk
In-Use [%] : Percentage of time the PPU is in use
Duration [ns] : Duration of the chunk
Start [ns] : Start time of the chunk
PID : Process ID
Device ID : PPU device ID
Analysis Logic
A PPU is busy if it is performing any of the following activities:
Executing a kernel
Executing a
memcpyormemsetoperationPerforming video encoding/decoding
On a per-process and per-PPU basis, the analysis calculates the total active time of a PPU, from the start of its first activity to the end of its last. It then divides this active time into equal-length chunks based on the chunks parameter. For each chunk, the analysis calculates PPU utilization as busy time / chunk duration. Chunks with a utilization below the threshold parameter are added to the results. If multiple consecutive chunks have utilization rates below the threshold, the analysis merges them into a single entry with a combined utilization rate. Results are sorted in ascending order by utilization.
Tip: The analysis does not count overlapping time twice for activities such as kernels and memcpy operations. The utilization for any chunk will not exceed 100%.
2. Statistics system
The statistics system, a key feature of Asight Systems, aggregates data from your reports to provide a comprehensive overview of your application's performance.
2.1 GUI statistics
Similar to Function View, you can switch to the statistics system page using the tab at the bottom, as shown below:
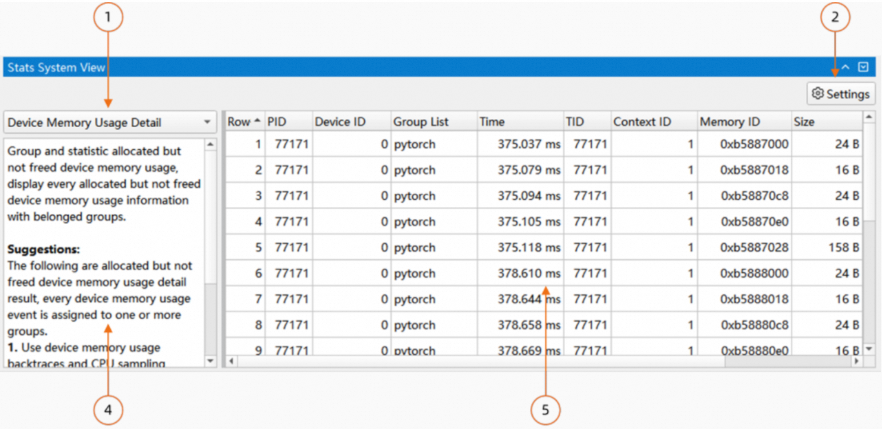
The rule list, where you can select statistics rules.
The rule parameter configuration dialog, where you can configure the parameters for the current statistics rule.
An introduction to the current rule and its optimization suggestions.
The statistics results table, which displays the analysis results for the current rule. You can export these results from the context menu.
2.1.1 Time range
You can set a time range to restrict statistics collection to events within that range. You can configure this in two ways:
Use the filter in the timeline view to set a time range.
Use the NVTX parameters in the rule parameter configuration dialog box to set the time range from the start to the end of an NVTX range, as shown below:
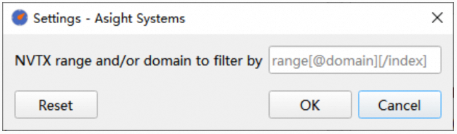
The format for specifying an NVTX is: range[@domain][/index], where:
range specifies the name of the NVTX.
domain specifies the domain of the NVTX.
index specifies which NVTX to select in case of duplicate names.
2.1.2 Timeline view
For some rules, you can open the Timeline View from the context menu.
2.2 Using the statistics system from the CLI
In the command-line client, use the asys stats command to run statistical analysis on a specified report and export its traces. You can output the results to the console, a file, or a command pipeline for viewing and post-processing. Some of these features are also available in the Asight Systems GUI. The stats subcommand uses the following syntax: asys stats [option] <file.asysrep>
2.2.1 Statistical report type
The asys stats command supports multiple statistical report types. To view a detailed description of each type, run asys stats --help-reports ALL.
Use the --report option to specify the statistical report type. You can specify this option multiple times or provide a comma-separated list to specify multiple types. If you do not specify a statistical report type, the default is used.
For example, to generate a report using the statistical report types hggc_ppu_kern_sum and device_memory_usage_summary:
asys stats --report hggc_ppu_kern_sum,device_memory_usage_summary report.asysrep
2.2.2 Statistical report format
The asys stats command uses the --format option to specify the output format for statistics reports. Run asys stats --help-formats ALL to view the supported output formats and help information.
column: The default format for terminal output, presenting data in an easy-to-read list.csv: The default format for file output, which is ideal for data export and processing.
2.2.3 Statistical report output type
Use the --output option to specify the report's output type. You can output to the console, a file, or a command. If this option is omitted, the report defaults to the console.
Use --output % to specify the output type, where % sends the output to the console. For example:
asys stats --output % --report hgtx_sum report.asysrep
If you specify --output . to save the report in the same directory as the source .asysrep file, asys generates the output filename based on the source filename, statistical report type, and output format. The filename follows this pattern: <file_name>_<report_name>.<format>. For example, using the --output option to generate a hggc_api_sum statistical report from report.asysrep in its source directory will create the file report_hggc_api_sum.csv.
asys stats --output . --report hggc_api_sum report.asysrep
Use --output @post_command to pipe the statistics report to a command for post-processing. For example, use grep 1142417 to find results that match the keyword "1142417":
asys stats --output "@grep 1142417" --report device_memory_usage_summary report.asysrep
2.2.4 Time range
Use the --filter-time option to specify the time range for statistics. The time format is start_time/end_time. The time is specified in nanoseconds as an offset from the start of collection. You can omit either the start time or the end time. For example, to analyze trace data from the 10th to the 20th second:
asys stats --filter-time 10000000000/20000000000 --report device_memory_usage_summary report.asysrep
Use the --filter-hgtx option to specify the time range using an HGTX annotation. The --filter-hgtx option overrides the --filter-time option. The value for the --filter-hgtx option specifies the name, domain, and matching index of an HGTX range using the format range_name@domain/index. If the target HGTX range has no domain, you can omit @domain; otherwise, you must specify it. By default, the tool uses the time range from the first matched HGTX range. The /index part is an optional, zero-based value that selects a specific range when there are multiple matches. If omitted, it defaults to 0 (the first matched range). For example, if you specify an HGTX range named self_attention with no domain, the tool uses the time range from the first matched range with that name.
asys stats --filter-hgtx self_attention --report device_memory_usage_summary report.asysrep
For example, for the NCCL domain, set the statistics time range of the pcclGroupEnd HGTX range to that of the 9th matching HGTX range (index 8).
asys stats --filter-hgtx "pcclGroupEnd@NCCL/8" --report device_memory_usage_summary report.asysrep
Tips:
Timestamps in the asys stats output may vary depending on the
--reportoption. To standardize the timestamps, use the--ts-normalize trueoption to convert timestamps to UTC time.Use the
--ts-shiftoption to manually adjust the timestamp offset. You can use this option with--ts-normalize.
2.3 Statistics system rules
2.3.1 Device memory usage by group
Description
Analyzes and summarizes unreleased PPU device memory allocations from an asysrep report, aggregates memory usage by group (such as operator library and framework), and outputs a summary and a detailed breakdown for each group.
Required asys collection option: --hggc-memory-usage true
Command line: Use --callstack-group-config to add a grouping rule and --report to specify a grouped statistics report. For example:
asys stats -r device_memory_usage_summary --callstack-group-config "acompute=(libacblas|libacdnn)" --callstack-group-config "launch_kernel=libtorch/LaunchKernel" report.asysrep
-r device_memory_usage_summary: Generates the device memory usage summary report.--callstack-group-config "acompute=(libacblas|libacdnn)":Creates a group named
acompute.The regular expression
(libacblas|libacdnn)matches memory usage when the call stack contains eitherlibacblasorlibacdnn.
--callstack-group-config "launch_kernel=libtorch/LaunchKernel":Creates a group named
launch_kernel.The regular expression
libtorch/LaunchKernelmatches memory usage in a call stack hierarchy where the parent function's frame containslibtorchand the child function's frame containsLaunchKernel.Intermediate, non-matching call stack frames can appear between the parent and child function frames.
This example shows the output of grouped statistics in CSV format. Use --output to save the output to a CSV file.
PID,device ID,group list,memory usage,
1873,0,launch_kernel,213174,
1873,0,others,48674898730,
1873,0,acompute,1610624066,
The report summarizes allocated but unreleased memory for the acompute and launch_kernel groups, measured in bytes.
Memory usage not belonging to any user-defined group is aggregated into the default others group.
The device_memory_usage_summary table has the following columns:
Row# : The row number.
PID : Process identifier.
Device ID : PPU identifier.
Group List : Groups for memory usage, separated by '/'.
Memory Usage [bytes] : Device memory usage.
The group statistics feature for device memory usage provides the following two report types, one or more of which you can specify using the --report option:
device_memory_usage_summary: Summarizes allocated but not yet freed memory by process, device, and group.device_memory_usage_detail: Lists each allocated but not yet freed allocation record and its group.
To view information about the device memory usage grouping statistics feature, including a description of its functionality and output format, use the --help-reports option. For example, running asys stats --help-report device_memory_usage_summary returns the following output:
root@eb4c64fd3401:~# asys stats --help-report device_memory_usage_summary
device_memory_usage_summary -- Device Memory Usage Summary

Options:
--filter-time / --filter-hgtx: Specifies a report time range.
--callstack-group-config: Creates a report group configuration.
Run 'asys stats --help' for more information.

Output:
Row# : Row number for the entry
PID : Process identifier
Device ID : PPU device identifier
Group List : The groups associated with the memory usage, separated by '/'.
Memory Usage [bytes] : Device memory usage

Summarizes allocated but unreleased device memory usage, grouped by process, PPU device, and group.
If a memory usage record matches multiple groups, the report lists all of them in the group field, separated by a forward slash (/). For example:
acompute/launch_kernel
The memory usage is attributed to both the acompute and launch_kernel groups.
The order of the groups is determined by the creation order specified by the
--callstack-group-configcommand-line option.
Use the --callstack-group-config option to create a group and specify its matching rule using regular expressions. The format is group_name=frame_filters, where frame_filters is a sequence of regular expressions that match frames, such as frame_regex/frame_regex... You must separate the expressions with a forward slash (/) and order them from the parent function to the child function. The matching rules are as follows:
A frame matches if the regular expression partially matches the library name or function signature in the call stack.
A group matches if the hierarchy of matched frames in the call stack matches the one specified in
frame_filters.
In this example, the --callstack-group-config option is used multiple times to create multiple groups, where each group defines a rule to match multiple frames:
--callstack-group-config "torch=libtorch" --callstack-group-config "acompute=(libacblas|libacdnn)" --callstack-group-config "buffer_init=_to_copy/empty_strided"Tips:
If you do not specify a grouping rule with the
--callstack-group-configoption, the default built-in grouping rules apply.If you use multiple
--callstack-group-configoptions for the same group name, a memory usage record is assigned to that group if it matches any of the associated grouping rules.
Statistical rules
For each process and PPU, the system aggregates PPU device memory usage records for outstanding allocations. The system then matches each record against grouping rules based on its call stack at allocation, such as the order of frames and keyword matches within each frame. If a record matches multiple groups, the output lists all matching groups, separated by a forward slash (/). Finally, the system aggregates the memory usage for each unique group combination and sorts the results in descending order by total memory usage.
2.3.2 PCCL transfer stages
Description
Analyzes and summarizes the duration of each PCCL transmission stage from an asysrep report, and outputs the results in descending order.
Required asys collection option: --trace pccl
Using the command line
asys stats --report pccl_stage_sum report.asysrep
Run asys stats --help-report pccl_stage_sum for detailed help.
Example report results:
Row#,PID,device ID,TID,channel ID,channel type,name,total time,instances,Avg,Med,Min,Max,Stdev,
1,631660,0,631712,1,RX,receive wait,305528068,24,12730336,13761981,9669723,18509164,2407844,
2,631660,1,631711,1,TX,GPU wait,299988851,24,12499535,12786840,9625474,16580086,2217489,
3,631660,0,631712,1,TX,GPU wait,297674072,24,12403086,12579239,9570100,17151019,2208876,
...
The pccl_stage_sum table contains the following columns:
Row# : Row number of the stage summary
PID : Process identifier
device ID : PPU device identifier
TID : Thread identifier
channel ID : PCCL channel identifier
channel type : PCCL channel type
name : stage name
total time [ns] : Total stage duration
instances : Number of stage occurrences
Avg [ns] : Average stage duration
Med [ns] : Median stage duration
Min [ns] : Minimum stage duration
Max [ns] : Maximum stage duration
Stdev [ns] : Standard deviation of stage duration
Statistics rules
Collects metrics—such as duration (average, maximum, and minimum) and count—by thread, channel, direction, and transmission stage, and outputs the results in descending order by total transmission stage duration.
2.3.3 OSRT API
Description
Aggregates OS runtime API call durations from an asysrep report, sorting the output in descending order by each API's total duration.
Required asys collection option: --trace osrt
Command line:
asys stats -r osrt_sum report.asysrep
For detailed help information, run asys stats --help-report osrt_sum.
Example report:
Row#,Time (%),Total Time (ns),Num Calls,Avg (ns),Med (ns),Min (ns),Max (ns),StdDev (ns),Name,
1,85.6,8901500720,255,34907845,4994783,1095,348667026,63811239,"pthread_cond_wait",
2,6.9,721563692,1105,652998,1055069,52083,1072141,485233,"nanosleep",
3,6.7,700892565,7,100127509,100123388,100121020,100143853,8411,"poll",
...
The osrt_sum table contains the following columns:
Row# : The row number in the operating system runtime summary.
Time [%] : The percentage of total execution time consumed by this function.
Total Time [ns] : The cumulative execution time for all calls to this function.
Num Calls : The total number of calls to the function.
Avg [ns] : The average execution time of the function.
Med [ns] : The median execution time of the function.
Min [ns] : The minimum execution time for a single function call.
Max [ns] : The maximum execution time for a single function call.
StdDev [ns] : The standard deviation of the function's execution time.
Name : The name of the function.
Statistical rule
Aggregates OSRT API durations by name and sorts the results in descending order by total duration.
2.3.4 HGGC API
Features
Aggregates HGGC API latency from an asysrep report and sorts the results by total latency in descending order.
Required asys collection option:--trace hggc
Command line usage:
asys stats -r hggc_api_sum report.asysrep
Run asys stats --help-report hggc_api_sum for detailed help.
Here are some examples of report results:
Row#,Time (%),Total Time (ns),Num Calls,Avg (ns),Med (ns),Min (ns),Max (ns),StdDev (ns),Name,
1,84.9,393100090,342,1149415,98746,3981,11001565,2011747,"hgMemcpyHtoDAsync_v2",
2,4.3,19851112,1297,15305,5351,2893,3860175,147778,"hgLaunchKernel",
3,2.9,13492044,1486,9079,2861,613,3707197,108998,"hgEventQuery",
4.2.9,13487638,1495,9021,6027,3191,222379,14733,"hggcLaunchKernel",
...
The hggc_api_sum table contains the following columns:
Row# : The row number in the HGGC API summary.
Time [%] : The percentage of total execution time consumed by the function.
Total Time [ns] : The cumulative execution time across all calls to the function.
Num Calls : The total number of calls to the function.
Avg [ns] : The average execution time per call to the function.
Med [ns] : The median execution time of all calls to the function.
Min [ns] : The minimum execution time among all calls to the function.
Max [ns] : The maximum execution time among all calls to the function.
StdDev [ns] : The standard deviation of execution times for all calls to the function.
Name : The name of the function.
Statistical Rules
Aggregates latency by HGGC API name and displays the results in descending order of total latency.
2.3.5 HGGC API trace
Exports HGGC API trace data from an asysrep report, sorted by API execution time in ascending order.
Required asys collection option: --trace hggc
Command-line usage:
asys stats -r hggc_api_trace report.asysrep
For detailed help, run asys stats --help-report hggc_api_trace.
The following example shows the report results:
Row#,Start (ns),Duration (ns),Name,CorrID,Pid,Tid,Thread Name,
1,41550,12737,"cudaProfilerStart",0,104699,104699,"python",
2,938476,28340,"cudaLaunchKernel",130170,104699,104699,"python",
3,999414,9382,"cudaLaunchKernel",130171,104699,104699,"python",
...
Columns in the hggc_api_trace table:
Row# : Row number of the HGGC API trace
Start [ns] : Timestamp of the API call
Duration [ns] : Duration of the API call
Name : API function name
CorrID : Correlation ID for linking to other HGGC traces
Pid : ID of the calling process
Tid : ID of the calling thread
Thread Name : Name of the calling thread
Statistics rule
Each HGGC API call exports one row of data, sorted in ascending order by API execution time.
2.3.6 HGGC kernel tracing
Features
Export trace data from an asysrep report for an HGGC kernel, from API launch to execution, sorted in ascending order by start time.
Required asys collection option: --trace hggc
Command line usage:
asys stats -r hggc_kern_exec_trace report.asysrep
Run asys stats --help-report hggc_kern_exec_trace for detailed help information. The following options are supported:
base: Exports the kernel's base name (the function name without parameters).
mangled: Exports the kernel's mangled name.
By default, HGGC exports demangled kernel names.
The following is an example report:
Row#,API Start (ns),API Duration (ns),Queue Start (ns),Queue Duration (ns),Kernel Start (ns),Kernel Duration (ns),Total Duration (ns),PID,TID,device ID,API Function,Grid (X,Y,Z),Block (X,Y,Z),Kernel Name,
1,504935256,20348911,525284167,21237024,526172280,357034784,378271808,631660,631660,0,"hggcLaunchKernel","2 1 1","512 1 1","pcclKernel_AllReduce_RING_LL_Sum_int8_t(pcclWorkElem)",
2,845563829,20332834,865896663,20934656,866498485,17898735,38833391,631660,631660,1,"hggcLaunchKernel","2 1 1","512 1 1","pcclKernel_AllReduce_RING_LL_Sum_int8_t(pcclWorkElem)",
3,884469702,40488,884510190,627234,885096936,16944871,17572105,631660,631660,0,"hggcLaunchKernel","2 1 1","512 1 1","pcclKernel_AllReduce_RING_LL_Sum_int8_t(pcclWorkElem)",
...
The columns in the hggc_kern_exec_trace table are as follows:
Row# : Row number of the kernel trace
API Start [ns] : Start timestamp of the HGGC API launch call
API Dur [ns] : Duration of the HGGC API launch call
Queue Start [ns] : Start timestamp of the queue wait, if applicable
Queue Dur [ns] : Duration of the queue wait, if applicable
Kernel Start [ns] : Start timestamp of the HGGC kernel's execution
Kernel Dur [ns] : Duration of the HGGC kernel's execution
Total Dur [ns] : Total duration from the start of the API launch call to the end of the kernel execution
PID : ID of the process that launched the kernel
TID : ID of the thread that launched the kernel
DevId : ID of the HGGC device (PPU) that executed the kernel
API Function : Name of the HGGC API function that launched the kernel
GridXYZ : Grid dimensions (X, Y, Z) for the kernel launch
BlockXYZ : Block dimensions (X, Y, Z) for the kernel launch
Kernel Name : Name of the executed HGGC kernel
Statistical rules
The exported results are organized as follows: each kernel execution appears as a single row, sorted in ascending order by the start time of its launch API call. If a single HGGC API call triggers multiple kernels, such as in an HGGC Graph, each kernel is still listed in a separate row. The wait time after a kernel launch, shown in the queue start and queue dur columns, is calculated as follows:
A
kernelhas await timeif itsactual execution start timeis later than itsHGGC API execution end time.wait time=actual execution start time-HGGC API execution end time.If the kernel starts execution before the HGGC API execution finishes, the Queue Start / Queue Dur column is marked as the invalid value "-".
2.3.7 HGGC PPU tracking
Features
Exports trace data from an asysrep report for HGGC kernel, Memcpy, and Memset operations performed by the PPU, sorted in ascending order by start time.
Required asys collection option: --trace hggc
Command-line usage
asys stats -r hggc_ppu_trace report.asysrep
For detailed help information, run asys stats --help-report hggc_ppu_trace. The supported options are:
base: Exports the kernel's short name (the function name without parameters).mangled: Exports the kernel's mangled name.
By default, an HGGC Kernel is exported with its demangled name. In the following example report, inapplicable cells contain "-" to indicate an invalid value.
Row#,Start (ns),Duration (ns),CorrId,GrdX,GrdY,GrdZ,BlkX,BlkY,BlkZ,Reg/Trd,StcSMem (bytes),DymSMem (bytes),Bytes (bytes),Throughput (B/s),SrcMemKd,DstMemKd,Device,Ctx,Strm,Name,
1,193282492,3009,5,"-","-","-","-","-","-","-","-","-",256,85078016,"device","-","",1,1,"memset",
2,193329286,1332,6,"-","-","-","-","-","-","-","-","-",256,192192000,"pageable memory","device","",1,1,"memory copy (host to device)",
3,193380562,3415,7,"-","-","-","-","-","-","-","-","-",256,74963200,"pageable memory","device","",1,1,"memory copy (host to device)",
4,231829389,4562345,8,64,1,1,1,1,1,32,0,0,"-","-","-","-","",1,1,"add(int*, int*, int*)",
The hggc_ppu_trace table contains the following columns:
Row# : Row number of the PPU trace
Start [ns] : Start time of the event.
Duration [ns] : Duration of the event.
CorrId : Correlation ID.
GrdX : X dimension of the grid.
GrdY : Y dimension of the grid.
GrdZ : Z dimension of the grid.
BlkX : X dimension of the thread block.
BlkY : Y dimension of the thread block.
BlkZ : Z dimension of the thread block.
Reg/Trd : Registers per thread.
StcSMem [bytes] : Size of static shared memory.
DymSMem [bytes] : Size of dynamic shared memory.
Bytes [bytes] : Size of the memory operation.
Throughput [B/s] : Memory throughput.
SrcMemKd : Source memory kind for memcpy or memset.
DstMemKd : Destination memory kind for memcpy.
Device : PPU device name and ID.
Ctx : Context ID.
Strm : Stream ID.
Name : Trace event name.
Statistical rules
The exported results list each kernel, Memcpy, and Memset execution on a separate row, sorted in ascending order by start time.
In the exported results, inapplicable cells in the kernel, memcpy, and memset columns are marked with a dash (-) to indicate an invalid value.
2.3.8 HGGC PPU kernel
Description
Summarizes the time taken by HGGC kernels in the asysrep report and sorts them in descending order by total time.
Required asys collection option: --trace hggc
Command line usage:
asys stats -r hggc_ppu_kern_sum report.asysrep
Run asys stats --help-report hggc_ppu_kern_sum for detailed help. The supported options are:
base: Uses the kernel's base name (the function name only, without parameters) to aggregate statistics and generate output.mangled: Uses the kernel's mangled name to aggregate statistics and generate output.
Here is an example of the report output:
Row#,Time (%),Total Time (ns),Instances,Avg (ns),Med (ns),Min (ns),Max (ns),StdDev (ns),Name,
1,81.6,826473830,28,29516922,17075623,16812011,357034784,64193935,"_Z39pcclKernel_AllReduce_RING_LL_Sum_int8_t12ncclWorkElem",
2,13.9,141273640,4,35318410,34326818,31248932,41371071,4288359,"_Z9deltaKernIaLi256EEvPvS0_mPd",
3,2.3,23263744,4,5815936,5866699,4743763,6786583,1087875,"_Z14InitDataKernelIaEvPT_mii",
4,2.2,22033972,4,5508493,5461251,4528464,6583005,1031905,"_Z20InitDataReduceKernelIaXadL_Z9ncclOpSumIaET_S1_S1_EEEvPS1_mmii",
The hggc_ppu_kern_sum table contains the following columns:
Row# : Row number of the kernel summary
Time [%] : Percentage of the total execution time
Total Time [ns] : Total time for all executions of this kernel
Instances : Number of calls to this kernel
Avg [ns] : Average execution time of this kernel
Med [ns] : Median execution time of this kernel
Min [ns] : Minimum execution time of this kernel
Max [ns] : Maximum execution time of this kernel
StdDev [ns] : Standard deviation of this kernel's execution time
Name : Name of this kernel
Statistical rules
Statistics are aggregated by HGGC kernel name. The format of the kernel name depends on the base / mangled option. By default, the name is demangled and includes the function parameter list. The output is sorted by total time for each HGGC kernel in descending order.
2.3.9 HGTX range
Features
Aggregates HGTX range durations from an asysrep report and sorts the output by total duration in descending order.
Required asys collection option: --trace hgtx
Command-line usage:
asys stats -r hgtx_sum report.asysrep
Run asys stats --help-report hgtx_sum to view detailed help. The supported options are as follows:
rows=<limit>: Limits the number of HGTX ranges returned.process=<pid_list>: Includes statistics for only the specified process IDs (PIDs). Separate multiple PIDs with a forward slash (/). If omitted, all processes are included.thread=<tid_list>: Includes statistics for only the specified thread IDs (TIDs). Separate multiple TIDs with a forward slash (/). If omitted, all threads are included.
The following is an example of the report results:
Row#,Time (%),Total Time (ns),Instances,Avg (ns),Med (ns),Min (ns),Max (ns),StdDev (ns),Style,Range,
1,25.7,181837947,1,181837947,181837947,181837947,181837947,0,"PushPop","[prof_range]: iter 6",
2,25.1,177622641,1,177622641,177622641,177622641,177622641,0,"PushPop","[prof_range]: iter 9",
3,25.1,177254919,1,177254919,177254919,177254919,177254919,0,"PushPop","[prof_range]: iter 7",
4,24.1,170843422,1,170843422,170843422,170843422,170843422,0,"PushPop","[prof_range]: iter 8",
...
The columns in the hgtx_sum table are as follows:
Row# : The row number of the entry in the HGTX range summary.
Time [%] : This range's percentage of the total time.
Total Time [ns] : The cumulative duration of all instances of this range.
Instances : The number of recorded instances of this range.
Avg [ns] : The average duration of this range.
Med [ns] : The median duration of this range.
Min [ns] : The minimum duration of this range.
Max [ns] : The maximum duration of this range.
StdDev [ns] : The standard deviation of the range's duration.
Style : The marking method for the range, e.g., Start/End or Push/Pop.
Range : The name of the range.
Statistical rules
Statistics are calculated by summing the duration of HGTX ranges grouped by domain and name. If an HGTX range includes a domain, its name appears in the domain:range format. The results are sorted in descending order by the total group duration. When you define the scope using the process/thread option, a thread is included in the statistics if it matches the thread filter condition or its parent process matches the process filter condition.
2.3.10 HGTX kernel tracing
Features
Establishes the association between HGTX and HGGC kernels, and exports it for each HGTX range and HGGC kernel.
Required asys collection options: --trace hgtx,hggc
Command-line usage:
asys stats -r hgtx_kern_trace report.asysrep
Run asys stats --help-report hgtx_kern_trace for detailed help. This command supports the following options:
base: Exports the kernel's base name (the function name without parameters).mangled: Exports the mangled name of the kernel.standalone: Includes HGGC kernels that are not associated with any HGTX range in the output.
The following is an example of the report results:
Row#,Range name,Style,PID,TID,Device ID,HGTX range ID,Kernel exec ID,Kernel Start (ns),Kernel duration (ns),API Start (ns),API duration (ns),GridXYZ,BlockXYZ,Kernel name,
1,"profile","PushPop",3588556,3588556,0,6,20,257324264,4562345,218889819,37829255,"64 1 1","1 1 1","add(int*, int*, int*)",
2,"profile","PushPop",3588556,3588556,0,6,40,291234962,3474616,290293060,17365,"64 1 1","1 1 1","add(int*, int*, int*)",
3,"Loop1","PushPop",3588556,3588556,0,7,20,257324264,4562345,218889819,37829255,"64 1 1","1 1 1","add(int*, int*, int*)",
...
The hgtx_kern_trace table contains the following columns:
Row# : Row number in the HGTX range kernel trace.
Range name : Name of the HGTX range.
Style : Range definition style, such as `Start/End` or `Push/Pop`.
PID : Process identifier.
TID : Thread identifier.
Device ID : PPU device identifier.
Context ID : Context identifier.
Stream ID : Stream identifier.
HGTX range ID : Unique identifier for the HGTX range instance.
Kernel exec ID : Unique identifier for the kernel execution instance.
Kernel Start [ns] : Start timestamp of the HGGC kernel.
Kernel duration [ns] : Duration of the HGGC kernel.
API Start [ns] : Start timestamp of the kernel-launching API call.
API duration [ns] : Duration of the kernel-launching API call.
GridXYZ : Grid dimensions for the kernel launch.
BlockXYZ : Block dimensions for the kernel launch.
Kernel name : Name of the executed kernel.
Statistical rule
An HGGC kernel is associated with an HGTX range when an HGGC API call on the same thread launches the kernel during that range.
The export generates one row of data for each HGTX range and HGGC kernel. When the standalone option is enabled, the HGTX range field for HGGC kernels without an associated HGTX range is a dash (-).
Export order:
HGGC kernels are listed in ascending order of their PPU execution start time.
For each HGGC kernel, the associated HGTX range rows are listed in ascending order of their start time.
2.3.11 HGTX kernels
Features
Aggregates trace data from an asysrep report for HGTX ranges and their associated HGGC kernels, outputting statistics grouped by HGTX range and kernel names.
Required asys collection option: --trace hgtx,hggc
Using the command line:
asys stats -r hgtx_kern_sum report.asysrep
Run asys stats --help-report hgtx_kern_sum to view detailed help. The following options are supported:
base: Exports the kernel's function name without parameters.mangled: Exports the kernel's mangled name.standalone: Includes HGGC kernels that are not associated with an HGTX range.
Sample report results:
Row#,HGTX Range,Style,PID,TID,HGTX Inst,Kern Inst,Total Time (ns),Avg (ns),Med (ns),Min (ns),Max (ns),StdDev (ns),Kernel Name,
1,"DoProcess","PushPop",3588556,3588556,2,2,8036961,4018480,4018480,3474616,4562345,543864,"add(int*, int*, int*)",
2,"Loop1","PushPop",3588556,3588556,1,1,4562345,4562345,4562345,4562345,4562345,0,"add(int*, int*, int*)",
3,"Loop2","PushPop",3588556,3588556,1,1,3474616,3474616,3474616,3474616,3474616,0,"add(int*, int*, int*)",
4,"profile","PushPop",3588556,3588556,1,2,8036961,4018480,4018480,3474616,4562345,543864,"add(int*, int*, int*)",
The hgtx_kern_sum table includes the following columns:
Row# : Row number in the HGTX range kernel summary
HGTX Range : Name of the HGTX range
Style : Method used to define the range, such as Start/End or Push/Pop
PID : ID of the executing process
TID : ID of the executing thread
HGTX Inst : Number of HGTX range instances
Kern Inst : Number of HGGC kernel instances associated with the HGTX range
Total Time [ns] : Cumulative execution time of all associated kernel instances
Avg [ns] : Average execution time of the associated kernel instances
Med [ns] : Median execution time of the associated kernel instances
Min [ns] : Minimum execution time of the associated kernel instances
Max [ns] : Maximum execution time of the associated kernel instances
StdDev [ns] : Standard deviation of the execution time for the associated kernel instances
Kernel Name : Name of the kernel
Statistical rules
An HGGC kernel is associated with an HGTX range if an HGGC API call on the same thread launches it during the range.
Aggregation method:
For each process and thread, this feature aggregates kernel execution information by HGTX range and kernel name. This aggregation includes kernel execution time, the HGTX range count, and the kernel instance count.
The statistical results contain a row of data for each thread, HGTX range name, and HGGC kernel name. When you enable the standalone option, the system marks HGTX-related information with the invalid symbol (-) for HGGC kernels without an associated HGTX range. The results are sorted as follows:
Sort ascending by HGTX range name, process ID, and thread ID.
For kernels with the same thread and HGTX range name, sort descending by Total Time.
2.3.12 HGTX-to-PPU projection tracking
Features
Projecting the CPU side HGTX range from an asysrep report onto the PPU side allows you to view its active time and export its HGTX stack traces.
Required asys collection options: --trace hgtx,hggc
Command-line usage:
asys stats -r hgtx_ppu_proj_trace report.asysrep
Run asys stats --help-report hgtx_ppu_proj_trace to view the help message.
The following is an example report:
Row#,name,projected start (ns),projected duration (ns),original start (ns),original duration (ns),style,PID,TID,NumPPUOps,level,child count,range ID,parent ID,range stack,
1,"profile",193282492,75939861,190531194,79865797,"push/pop",3588556,3588556,10,0,2,6,"-",":6",
2,"Loop1",193282492,43122023,190588819,74067469,"push/pop",3588556,3588556,5,1,1,7,6,":6:7",
3,"DoProcess",193282492,43122023,190594879,72971893,"push/pop",3588556,3588556,5,2,0,8,7,":6:7:8",
...
The hgtx_ppu_proj_trace table contains the following columns:
Row# : Row number of the HGTX PPU projection trace
Name : Name of the HGTX range
Projected Start [ns] : Projected range start timestamp
Projected Duration [ns] : Projected range duration
Orig Start [ns] : Original HGTX range start timestamp
Orig Duration [ns] : Original HGTX range duration
Style : Range style; Start/End or Push/Pop
PID : Process identifier
TID : Thread identifier
NumPPUOps : Number of enclosed PPU operations
Lvl : Stack level, starts at 0
NumChild : Number of children ranges
RangeId : Arbitrary ID for range
ParentId : Range ID of the enclosing range
RangeStack : Range IDs that make up the push/pop stack
Statistical rules
A HGGC kernel is associated with an active HGTX range if it is launched by an HGGC API call on the same thread.
The active time of a CPU-side HGTX range on the PPU side spans from the start of its earliest associated PPU activity to the end of its latest. PPU activities include HGGC kernels, memcpy, and memset operations.
The export contains one row for each HGTX range, sorted in ascending order by projected start.
2.3.13 HGGC, kernel, grid, and block
Description
Summarizes HGGC kernel execution statistics from an asysrep report by kernel name, grid size, and block size.
Option for asys dependency collection: --trace hgtx,hggc
Using the command line
asys stats -r hggc_ppu_kern_gb_sum report.asysrep
Run asys stats --help-report hggc_ppu_kern_gb_sum for detailed help. The supported options are as follows:
hgtx-name: Prefixes the kernel name with the HGTX range name nearest to the kernel launch, separated by a forward slash (/).
base: Aggregates statistics using the kernel's short name (the function name, excluding parameters).
mangled: Aggregates statistics using the kernel's mangled name.
Here are sample report results:
Row#,Time (%),Total Time (ns),Instances,Avg (ns),Med (ns),Min (ns),Max (ns),StdDev (ns),GridXYZ,BlockXYZ,Name,
1,6.7,16337781,65,251350,260801,115520,277681,39767,"960 1 64","256 1 1","[prof_range]: iter 9/_ZN5acdnn4cuda9transposeILNS0_8LoopModeE0ELi32ELi8ELb0ELb0EN7",
2,3.1,7415267,20,370763,370601,366482,374162,1936,"2048 1 1","512 1 1","[prof_range]: iter 8/_ZL35batch_norm_bwd_single_vector_accessILb0EN5acdnn16identity",
3,3.0,7348069,20,367403,366401,361281,375921,3885,"122880 1 1","128 1 1","_ZN2at6native29vectorized_elementwise_kernelILi4EZZZNS0_12",
The columns in the hggc_ppu_kern_gb_sum table are:
Row#: Row number in the kernel summary
Time [%]: Percentage of total time
Total Time [ns]: Total time for all kernel executions
Instances: Number of kernel calls
Avg [ns]: Average kernel execution time
Med [ns]: Median kernel execution time
Min [ns]: Minimum kernel execution time
Max [ns]: Maximum kernel execution time
StdDev [ns]: Standard deviation of kernel execution time
GridXYZ: Grid dimensions of the kernel launch
BlockXYZ: Block dimensions of the kernel launch
Name: Name of the kernel
Statistics rule
Aggregation method:
Aggregates kernel execution information, such as execution time and occurrences, across kernels with the same name, grid size, and block size.
When the hgtx-name option is enabled, the kernel name also includes the HGTX range name.
Each unique combination of kernel, grid size, and block size generates one data row. The results are sorted in descending order by the Total Time column.
HGGC Kernel Grid Block tracking
Features
Exports trace data for HGGC kernel executions from an asysrep report, including grid size and block size, sorted in ascending order by execution start time.
Required asys collection option: --trace hgtx,hggc
CLI
asys stats -r hggc_ppu_kern_gb_trace report.asysrep
Run asys stats --help-report hggc_ppu_kern_gb_trace for detailed help. Supported options include:
hgtx-name: Prefixes the kernel name with the name of the HGTX range closest to the kernel launch, separated by a forward slash (/).base: Reports statistics by the kernel's short name (the function name, excluding parameters).mangled: Reports statistics by the mangled name of the kernel.
Example output:
Row#,Start (ns),Duration (ns),PID,Device ID,Context ID,Stream ID,GridXYZ,BlockXYZ,Name,
1,970508,6240,104699,0,1,1,"3 1 1","128 1 1","[prof_range]: iter 5/unrolled_elementwise_kernel",
2,1014188,44480,104699,0,1,1,"15360 1 1","128 1 1","[prof_range]: iter 5/unrolled_elementwise_kernel",
3,1158469,98480,104699,0,1,1,"960 1 64","256 1 1","[prof_range]: iter 5/transpose",
4,1257269,1880,104699,0,1,1,"1 1 32","256 1 1","[prof_range]: iter 5/transpose",
The hggc_ppu_kern_gb_trace table contains the following columns:
Row# : row number of the kernel trace
Start [ns] : start time of the event
Duration [ns] : duration of the event
PID : process identifier
Device ID : PPU device identifier
Context ID : context identifier
Stream ID : stream identifier
GridXYZ : grid dimensions for the kernel launch
BlockXYZ : block dimensions for the kernel launch
Name : kernel name
Statistical rules
In the exported results, each kernel execution is listed as a single row, sorted by start time in ascending order.