Trace target program
1. PPU activity tracing
asys collects tracking information for both HGGC and CUDA, letting you trace CUDA applications. Use the -t option to specify the items to trace. If this option is not specified, hggc,hgtx,acdnn,acblas are traced by default. The following table describes the PPU-related trace items for the --trace option:
Trace items | Description |
hggc | Execution time and call stack information for HGGC runtime and driver APIs Execution time and call stack information for CUDA runtime and driver APIs PPU execution information: kernel, memcpy, and memset operations Correlation between HGGC and CUDA APIs and PPU execution |
acdnn | cuDNN API: execution time information |
acblas | cuBLAS API: execution time information |
hgvideo | Execution time for HG-Encode APIs Execution time for HG-ACVID APIs Execution time for HG-JPEG APIs PPU execution information: video encoding and decoding Correlation between video APIs and PPU execution |
pccl | Execution time for each phase of PCCL communication |
For the hggc trace item, use the --hggc-trace-set option to control the tracing scope by enabling specific trace subsets. You can specify multiple subsets separated by commas, for example: --hggc-trace-set=kernel-activity,kernel-api.
Trace subset | Description |
kernel-activity | Information about kernels executed on the PPU. |
memory-activity | Information about memory operations on the PPU. |
kernel-api | Execution information for host-side kernel-related APIs. |
memory-api | Execution information for host-side memory-related APIs. |
default-set | The default value. Includes all specifiable trace subsets and other HGGC and CUDA tracking information. |
To prevent the hggc item from tracing specific APIs, set the ASIGHT_HGGC_TRACE_BLACKLIST environment variable to a comma-separated list of API names. For example: export ASIGHT_HGGC_TRACE_BLACKLIST=cudaEventQuery,cuEventQuery.
1.1 Device-side PPU activity
1.1.1 PPU activity
Required asys collection option: --trace hggc
The GUI tool displays PPU activity in a hierarchy, as shown in the following figure:
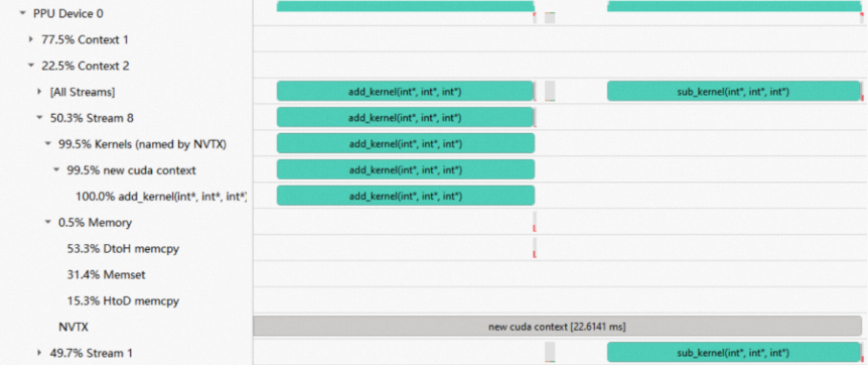
For clarity, the same timeline can appear on multiple rows. For example, in the figure above, add_kernel is displayed not only on its own row but also on the Kernels and Stream rows. If a context contains multiple streams, an [All Stream] row is displayed, which shows aggregated information for all streams.
Tip: If a device has only one context, the context node is not displayed, and its child stream nodes are shown directly. Similarly, if a context has only one stream, the stream node is hidden.
Each PPU node name is prefixed with a time percentage, which represents the node's duration relative to its parent node. For a stream node, the rule is as follows:
stream time percentage = 100.0 * stream duration / context duration
stream duration = sum of the duration of all events within the stream
context duration = sum of the duration of all events within the context
Therefore, "50.3% Stream 8" indicates that the total duration of all events in this stream accounts for 50.3% of the total duration of all events in its parent context.
Tip: The percentage calculation for the Kernel HGTX node under Kernels is an exception. Its denominator is the stream node, not its direct parent node.
Tip: When you apply a filter, the time percentage of PPU nodes is recalculated and the nodes are re-sorted based on the filtered range.
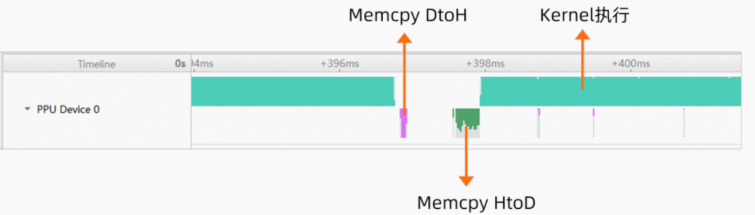
The PPU Device row summarizes the activity of the entire device. It is split into two layers: the upper layer shows kernel execution, and the lower layer shows memory operations. Different colors are used to distinguish memory operation types, such as HtoD, DtoH, DtoD, Pinned, and Pageable, as shown in the following figure:
1.1.2 PPU graph
Required asys collection option: --trace hggc
The Timeline View can display the graph timeline separately to help you analyze graph execution. If the report contains graph information, a graph node is displayed under the stream node in the following hierarchy:
Graph Group
Graph
Graph Exec
For the graph timeline, the Graph ID and Graph Exec ID are displayed, as shown in the following figure:
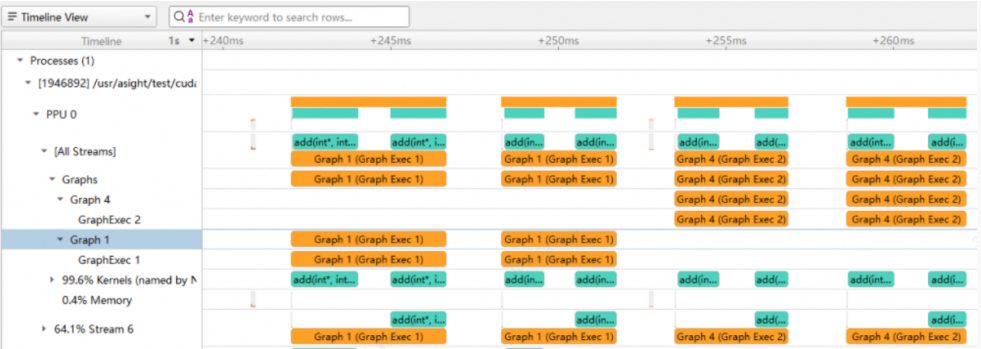
Summary information for the graph is also displayed on the device row.

1.1.3 PPU video
Required asys collection option: --trace hgvideo
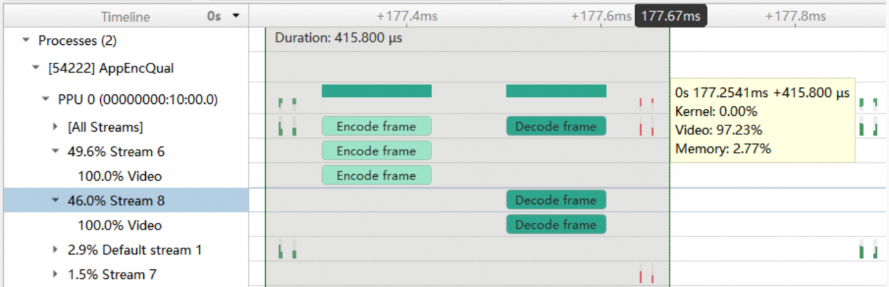
asys also collects PPU video activity data and displays the corresponding timeline to help you analyze video processing performance, as shown in the following figure:
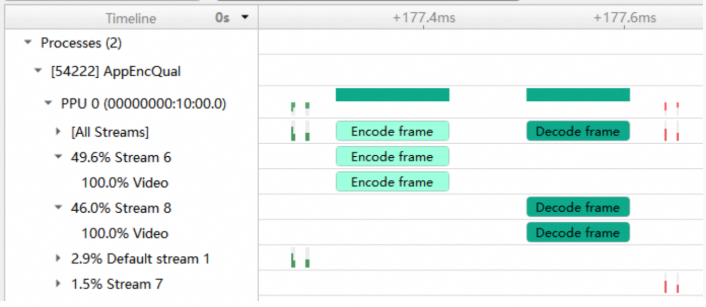
Under the stream node, a video node appears, which shows all video activity within the current stream. Similar to the kernel timeline, this activity is also summarized in the device node. When you select a time range, the tooltip shows the time percentage of the video activity, as shown in the following figure:
1.2 Host-side API calls
1.2.1 HGGC API
Required asys collection option: --trace hggc
Under the thread node, HGGC API calls are displayed. You can view the dispatch time of kernels and the start time of memory operations in HGGC:

1.2.2 ACDNN
Required asys collection option: --trace acdnn
When collection is enabled, the ACDNN timeline appears under the thread node:

1.2.3 ACBLAS
Required asys collection option: --trace acblas
When collection is enabled, the ACBLAS timeline appears under the thread node:

1.2.4 Video API
Required asys collection option: --trace hgvideo
When this option is enabled, Video API calls appear as shown below, including Encode, Decode, and HGJPEG APIs:

1.3 Navigating between host and device
Asight Systems shows the correlation between host-side API calls and device-side activity, and lets you navigate between them:
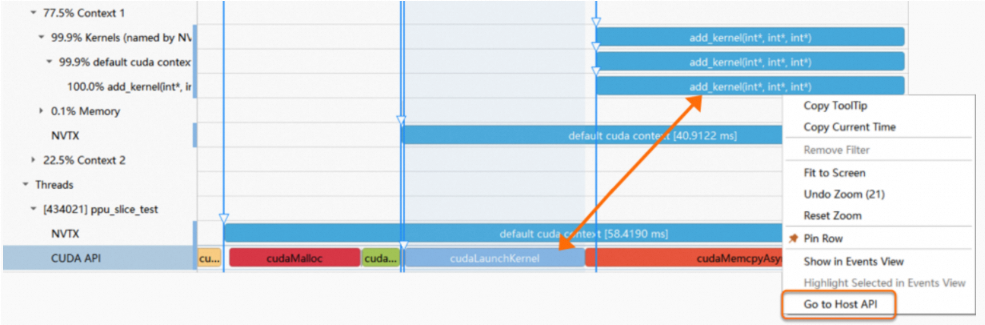
In the figure above, clicking cudaLaunchKernel highlights the correlated kernel executing on the device. You can use the Go to Host API or Go to Device Activity options in the context menu to navigate between them.
1.4 Switching launch API and kernel names
To change how launch API names are displayed, navigate to Tools > Options > Systems Profile > HGGC API Name Mode:
Show Host API name
Show launched Kernel name
1.5 Dependencies between PPU activities
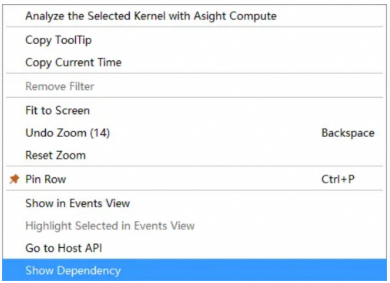
On the PPU, kernels on different streams can establish execution dependencies by using cudaEventRecord and cudaStreamWaitEvent. The Timeline View can display these dependencies. You can display a dependency from the context menu of a PPU activity timeline or a related event API timeline:
The Timeline View uses an orange curve to represent dependencies created by event-related APIs, as shown in the following figure:
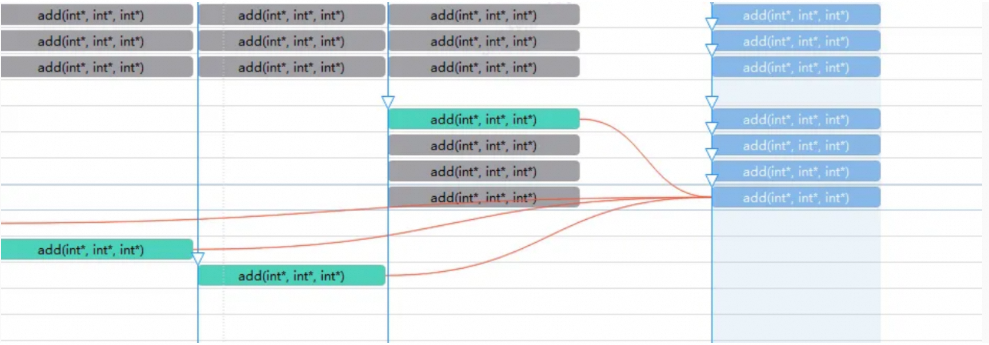
Timelines unrelated to the dependency are grayed out. When you hover over the curve, details about the dependency are displayed. When you click the curve, timelines related to that dependency path are highlighted. Dependencies between kernels on the same stream and dependencies on the default stream are represented by a green curve:
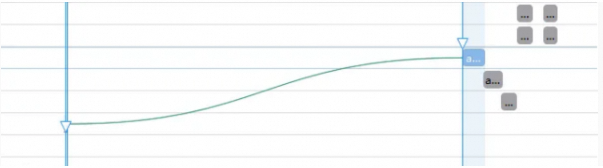
Tip: Dependencies are calculated from the tracking information in the report. If multiple threads operate on an HGGC stream concurrently, the displayed dependencies may not be accurate.
1.6 Analyzing a single kernel
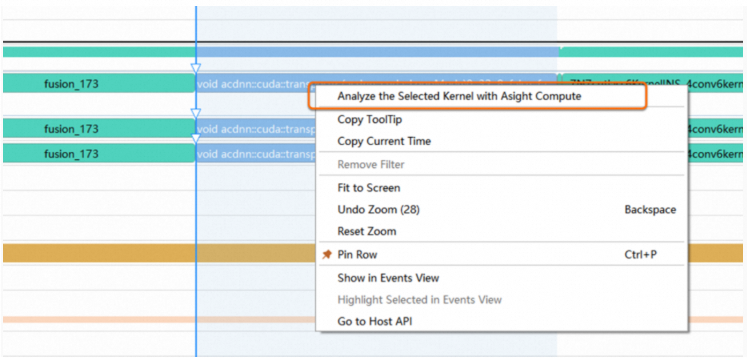
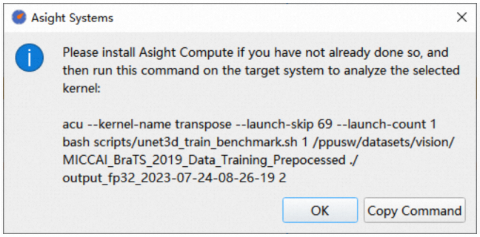
To perform an in-depth analysis of a kernel that does not meet performance expectations, select it in the Timeline View. From the context menu, select Analyze the Selected Kernel with Asight Compute to copy the report generation command. Run the command in the Asight Compute command-line tool to generate the report. Then, you can open the report in the Asight Compute GUI tool for further analysis of the kernel.
2. PPU metrics
asys periodically collects various runtime metrics from devices, such as resource utilization and I/O throughput, and displays how they change over time in the Asight Systems GUI:
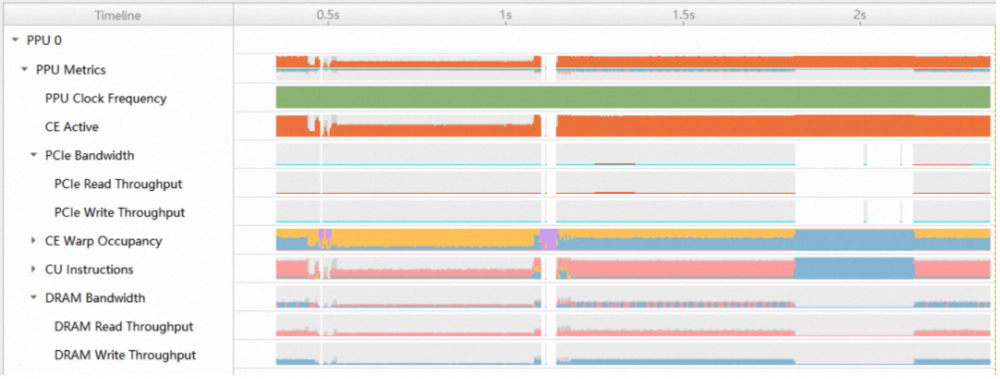
Metrics are grouped by category and support two summary display modes: Overlay and Stacked. Use the --ppu-metrics-device option to specify which devices to collect metrics from. For example, use --ppu-metrics-device all to collect metrics from all devices:
asys profile -t hggc --ppu-metrics-device all python test_linear.pyThis command collects metrics from all devices using the default metrics set. You can use the --ppu-metrics-set option to specify which metrics set to collect. For example, use --ppu-metrics-set throughput to collect the I/O throughput metrics set:
asys profile -t hggc --ppu-metrics-device all --ppu-metrics-set throughput python test_linear.pyUse the --ppu-metrics-device help option to list the available devices. You can specify multiple devices as a comma-separated list. For example, --ppu-metrics-device 0,1 collects runtime metrics from devices 0 and 1 only:
root@02892cb56ba5:~# asys profile --ppu-metrics-device help
Possible --ppu-metrics-device values are:
    all: Select all supported PPUs
    none: Disable PPU Metrics [Default]
    device ID list: comma separated device ID list(eg.: 0,1)

Available PPU metrics sampling devices are:
    0: PPU, PCI Bus ID: 00000000:10:00.0
    1: PPU, PCI Bus ID: 00000000:11:00.0
    2: PPU, PCI Bus ID: 00000000:CE:00.0
    3: PPU, PCI Bus ID: 00000000:CF:00.0
Device metrics are collected periodically. The default sampling frequency is 1,000 samples per second (1 kHz). You can use the --ppu-metrics-frequency option to set the sampling frequency. For example, --ppu-metrics-frequency 10000 sets the frequency to 10 kHz.
asys supports collecting a wide variety of device metrics. However, due to the sampling capacity limit, you can collect only a limited number of metrics in a single run. asys provides several predefined metrics sets. To view the supported metrics sets, use the --ppu-metrics-set help option:
root@02892cb56ba5:~# asys profile --ppu-metrics-set help
Possible --ppu-metrics-set values are:
 ---------------- ---------------------------------------- --------------------------------------------
  Identifier       Description                              Enabled Metrics
 ---------------- ---------------------------------------- --------------------------------------------
  summary          Collect clock / memory / CU activity /   ce__cycles_elapsed.avg.per_second
                   Bus throughput information.              ce__cycles_active.avg.pct_of_peak_sustained_elapsed
                                                            gd__dispatch_count.avg.pct_of_peak_sustained_elapsed
                                                            ce__warps_active_accumulated.avg.pct_of_peak_sustained_elapsed
                                                            ce__warps_inactive_cu_active_accumulated.avg.pct_of_peak_sustained_elapsed
                                                            ce__warps_inactive_cu_idle_accumulated.avg.pct_of_peak_sustained_elapsed
                                                            cu__cycles_active.avg.pct_of_peak_sustained_elapsed
                                                            cu__ws_issue_active.avg.pct_of_peak_sustained_elapsed
                                                            cu__we_pipe_tensor_cycles_active.avg.pct_of_peak_sustained_elapsed
                                                            dram__exclude_hbm_bytes_read.sum.pct_of_peak_sustained_elapsed
                                                            dram__exclude_hbm_bytes_write.sum.pct_of_peak_sustained_elapsed
...
  throughput       Collect DRAM / PCIe / ICN link           kvd__transaction_hit_rate.pct
                   throughput information.                  ksd__transaction_hit_rate.pct
                                                            l2__transaction_hit_rate.pct
                                                            dram__exclude_hbm_bytes_read.sum.pct_of_peak_sustained_elapsed
                                                            dram__exclude_hbm_bytes_write.sum.pct_of_peak_sustained_elapsed
                                                            pcie__read_bytes.avg.pct_of_peak_sustained_elapsed
                                                            pcie__write_bytes.avg.pct_of_peak_sustained_elapsed
                                                            icnltx__bytes.sum.pct_of_peak_sustained_elapsed
                                                            icnlrx__bytes.sum.pct_of_peak_sustained_elapsed
...
asys allows you to specify a custom list of metrics. Use the --ppu-metrics-list help option to view descriptions for all supported metrics:
root@02892cb56ba5:~# asys profile --ppu-metrics-list help
Possible --ppu-metrics-list values are:

ce__cycles_active.avg
    Display Name:
        ce__cycles_active.avg
    Unit: cycle
    Description:
        # of cycles active on CE across CEs
...
kvd__transaction_hit_rate.pct
    Display Name:
        kvd__transaction_hit_rate.pct
    Unit: %
    Description:
        (%) hit rate of KVD cacheable requests
...
You can use the --ppu-metrics-list option to specify a custom list of metrics, separated by commas. asys merges the metrics specified by --ppu-metrics-list with the set specified by --ppu-metrics-set. For example, --ppu-metrics-list ce__cycles_active.avg,kvd__transaction_hit_rate.pct specifies collecting CE utilization and KVD cache hit rate:
asys profile -t hggc --ppu-metrics-device all --ppu-metrics-set none --ppu-metrics-list ce__cycles_active.avg,kvd__transaction_hit_rate.pct python test_linear.pyDue to the device's sampling capacity limit, the custom list of metrics specified with --ppu-metrics-list must not exceed this limit. You can use --check-ppu-metrics-list to validate a comma-separated list of metrics:
root@02892cb56ba5:~# asys profile --check-ppu-metrics-list ce__cycles_active.avg,kvd__transaction_hit_rate.pct,pu__we_average_warps_issue_stalled_compute_sfu_raw_per_issue_active.ratio
Check sampling metrics list result: PASS.
Metrics list is suitable for PPU sampling capacity.Tip: asys might fail to collect device runtime metrics if the PPU performance data collection resources are occupied by other applications. Possible causes include:
Another asys process is collecting device runtime metrics.
Another acu process is collecting trace data.
DCGM is collecting profiling metrics. To pause DCGM collection, run
dcgmi profile --pause.You can use PPU-SMI to check the busy status of the PPU performance counter and the HGML GPM service.
Use
ppu-smi -qto check the status of the PPU performance counter.Use
ppu-smi gpm --get-sample-stateto check if the HGML GPM service is enabled. (If enabled, this service occupies the PPU performance counter.)To pause output from the HGML GPM service and release the PPU performance counter, run
ppu-smi gpm -s 0.
3. HGTX tracing
Asight Systems supports HGTX tracing, which lets you annotate the timeline. It supports custom domains and the push/pop and start/end APIs. The following example shows how to use HGTX:
#include <nvtx3/nvToolsExt.h>

for (int index = 0; index < 1000; ++index) {
    nvtxRangePushA("Loop");
    nvtxRangePushA("DoProcess");
    DoProcess();
    nvtxRangePop();
    ...
    nvtxRangePop();
}
The code pushes two nested HGTX ranges, Loop and DoProcess. The innermost DoProcess() function calls some HGGC APIs. To collect the HGTX trace, run the following command:
asys profile -t hgtx -o test_report sampleThe GUI then displays the report as follows:

In the figure above, the timeline for the outer NVTX range appears above the inner NVTX range. The Loop timeline encompasses the DoProcess timeline, which in turn encompasses the timeline for the innermost CUDA API calls. Asight Systems also supports collecting and displaying user-specified colors:

4. OS runtime tracing
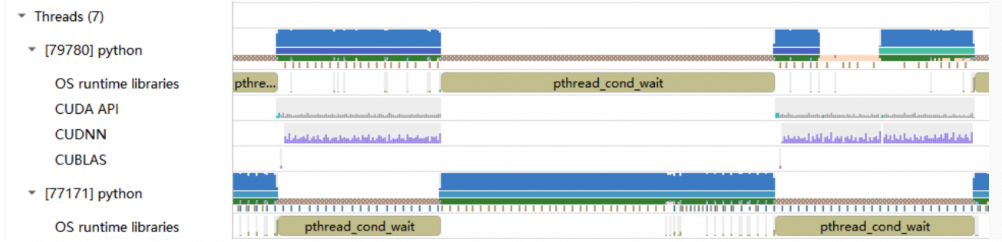
OSRT information helps identify the causes of CPU thread suspension, such as pthread_mutex_lock or sleep. To collect OSRT, add osrt to the -t tracing option:
Use the
--osrt-thresholdoption to set the collection threshold.Use the
--osrt-backtrace-thresholdoption to set the call stack backtrace threshold.
For example:
asys profile -t osrt --osrt-backtrace-threshold 80000 python /test_script/ops/test_linear.pyView the OSRT timeline in the GUI:
5. Tracing CPU and thread activity
Asight Systems can trace how threads are scheduled across CPU cores. Use the --sample or -s option to collect application execution data from all system CPUs. This feature also periodically samples CPU execution call stacks and aggregates the data to provide function execution time statistics.
For example, to collect CPU execution data and specify the call stack sampling period:
asys profile -s process-tree -b dwarf --sample-period 2000000 python test_linear.py-s process-tree: Traces CPU scheduling for the application process and its descendant processes.-b dwarf: Collects CPU execution call stacks. This option is enabled by default and can be omitted.--sample-period 2000000: Specifies the sampling period for CPU call stacks, measured in CPU execution cycles.--sample-backtrace-depth: Specifies the call stack depth for CPU sampling. The default is 24.
Note:
Enabling CPU execution sampling significantly increases the report file size. The smaller the
--sample-periodvalue, the higher the performance overhead on the application.The sampling period specified with the
--sample-periodoption might be capped by the operating system, resulting in a lower actual sampling rate.If you specify a short sampling period with
--sample-period, some sample points might be dropped due to throughput constraints.
5.1 CPU activity
This feature requires one of the following options:
--sample process-tree: Traces the process tree.--sample system-wide: Traces all processes on the system.
When CPU sampling is enabled, you can view the CPU activity:
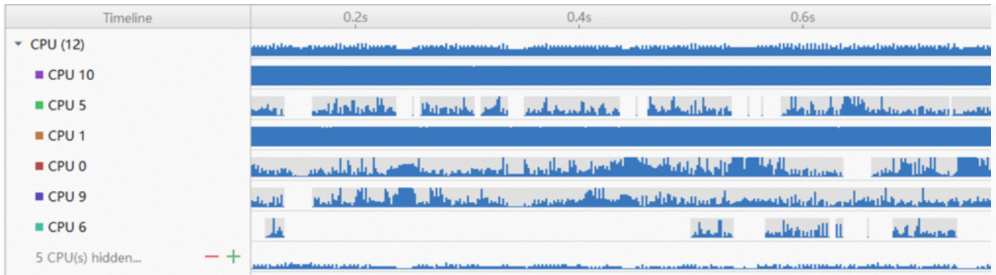
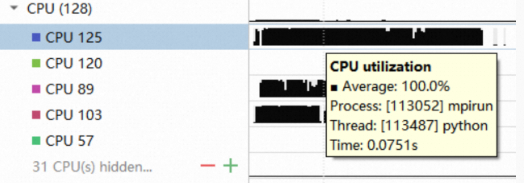
In the preceding figure, the CPU Group row shows the overall CPU activity. Each node below it represents the workload of a specific core. On the timeline, a colored bar indicates that the core was busy during that time period, while a blank area indicates the core was idle. Dark blue represents activity from the main process, and black represents activity from a child process. On the left, each CPU core node has a colored label that is also used in the thread row. The timeline tooltip shows which process and thread are currently executing on the CPU:
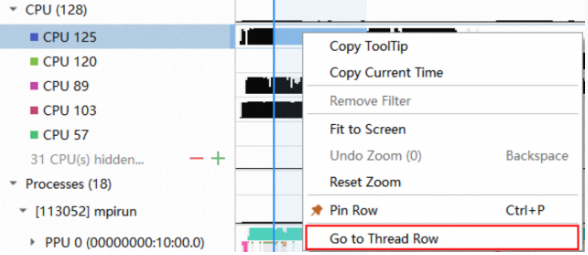
Use the "Go to Thread Row" option in the context menu to navigate to the corresponding thread row:
CPU sampling uses a high sampling rate, which can significantly increase the report file size. If you do not need CPU sampling data, disable it by passing the -s none option in the asys command.
5.2 Thread scheduling
This feature requires one of the following options:
--sample process-tree: Traces the process tree.--sample system-wide: Traces all processes on the system.
When CPU sampling is enabled, the thread timeline appears as follows:
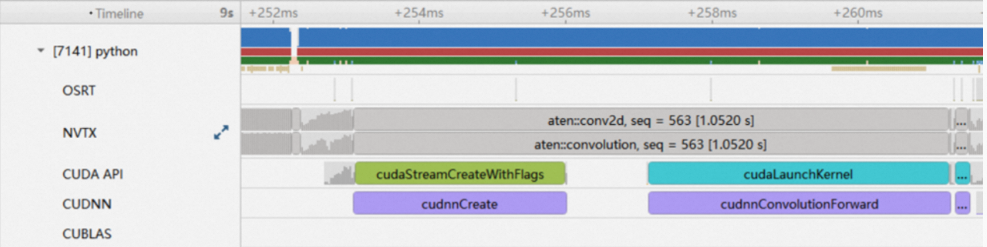
The child nodes of a thread row show various API calls. The thread row itself displays the thread's execution on CPU cores across four sub-rows:
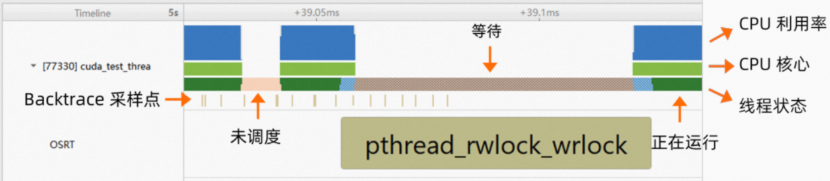
From top to bottom, they are:
CPU utilization: Shows CPU resource utilization.CPU core: Shows which core the thread is scheduled on. Its color corresponds to the label of the CPU core node.Thread state, which includes four states:Running

Unscheduled
Waiting
Calling OSRTBacktrace sample point: Represents a sample point. Its tooltip contains detailed call stack information.


Hover over an item to view more details.
When CPU sampling is disabled but OSRT collection is enabled, Asight Systems estimates the thread state based on OSRT execution. Time spent executing in OSRT counts as CPU idle, while time spent executing outside of OSRT counts as CPU busy, as shown in the following figure:
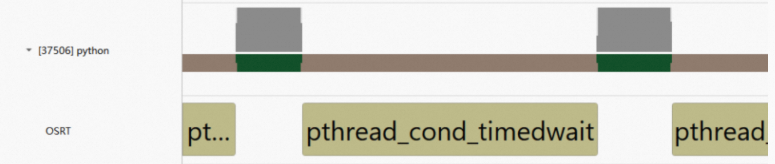
In this scenario, the thread state can be one of two types:
Possibly Running
Possibly Waiting


When only backtrace sampling is enabled, the thread row displays sample points:

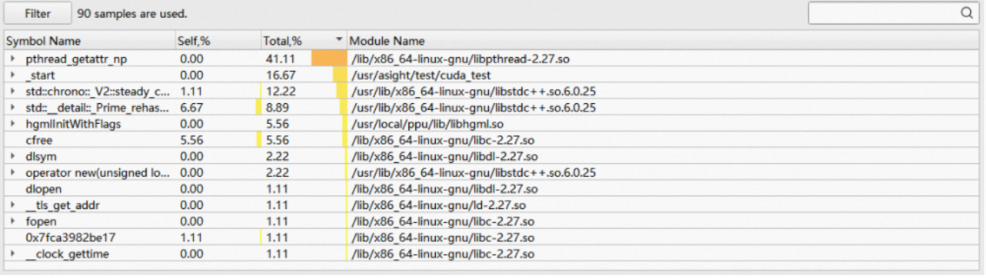
The Function View at the bottom of the GUI displays the application's function execution time statistics:
6. API call stack tracing
asys supports collecting call stacks for APIs such as HGGC, CUDA, OSRT, ACDNN, ACBLAS, CUDNN, and CUBLAS. You can set a runtime threshold to collect call stacks for API calls exceeding a specified duration, and control the maximum backtrace depth. After enabling API call stack tracing, you can view function calls in the GUI's Function View as a flame graph or icicle graph, or in Top Down, Bottom Up, and Flat tables.
6.1 Collect HGGC call stacks
Use the following command to trace HGGC and collect its call stacks:
asys profile -t hggc --hggcbacktrace all:1000 --hggc-backtrace-depth 24 python test_linear.py-t hggc: Enables HGGC tracing.--hggcbacktrace all:1000: Collects call stacks for all traced HGGC APIs when their runtime exceeds the threshold of 1,000 nanoseconds (ns).--hggc-backtrace-depth 24: Sets the maximum backtrace depth for HGGC call stacks to 24 frames.
Hover over an event on the Timeline to view its call stack:
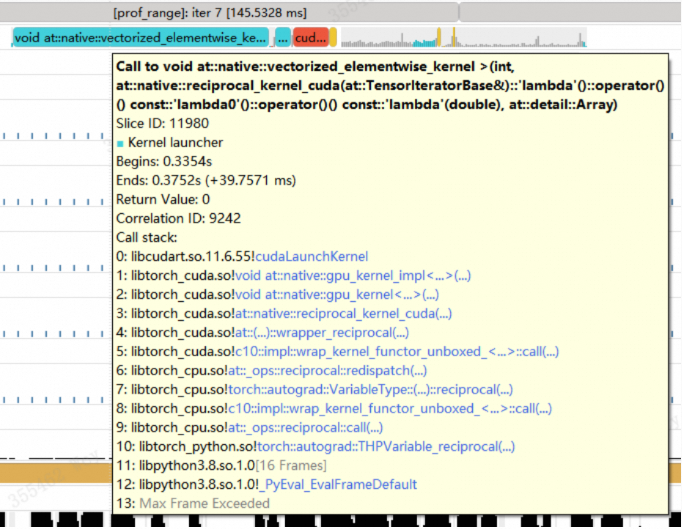
6.2 Collect OSRT call stacks
Use the following command to trace OSRT and collect its call stacks:
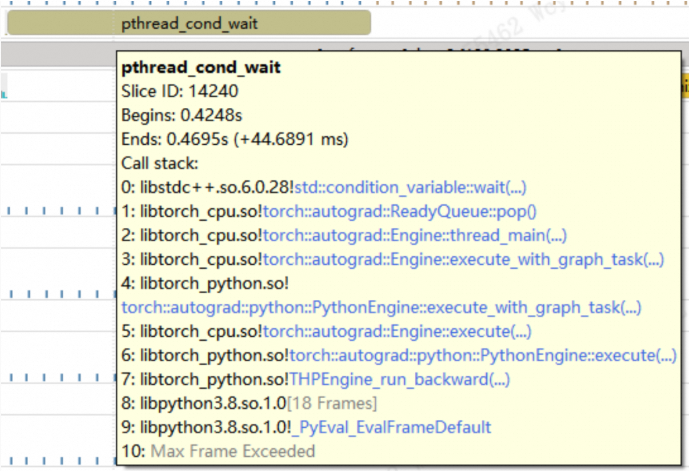
asys profile -t osrt --osrt-backtrace-threshold 80000 --osrt-backtrace-depth 24 python /test_script/ops/test_linear.py-t osrt: Enables OSRT tracing.--osrt-backtrace-threshold 80000: Sets the runtime threshold for collecting OSRT API call stacks to 80,000 nanoseconds (ns).--osrt-backtrace-depth 24: Sets the maximum backtrace depth for OSRT call stacks to 24 frames.
Below is an example call stack:
6.3 Collect ACDNN and ACBLAS call stacks
Use the following command to trace ACDNN and ACBLAS and collect their call stacks:
asys profile -t acdnn,acblas --acompute-backtrace-threshold 80000 python /test_script/ops/test_linear.py
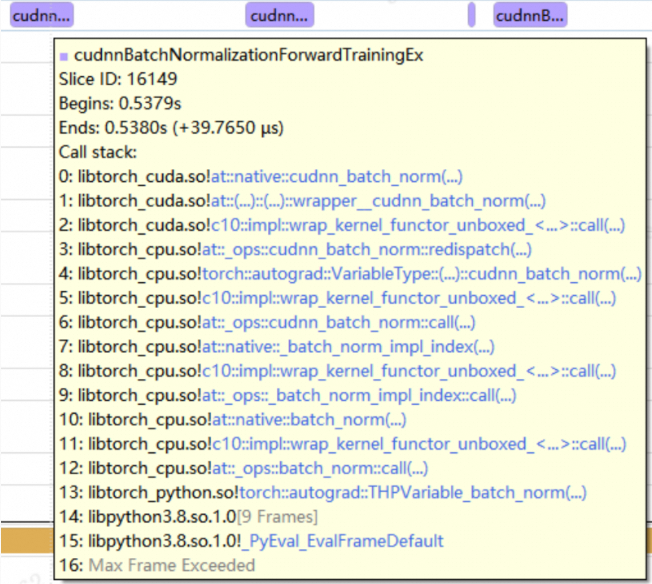
-t acdnn,acblas: Enables ACDNN and ACBLAS tracing.--acompute-backtrace-threshold 80000The runtime threshold in nanoseconds (ns) that triggers call stack collection for ACDNN and ACBLAS APIs.
Below is an example call stack:
7. Memory usage tracking
7.1 PPU memory usage
asys supports tracking an application's device memory usage. It captures the call stack when device memory is allocated or freed and aggregates this data to provide device memory statistics. You can enable memory usage tracking with the --hggc-memory-usage option. For example:
asys profile -t hggc --hggc-memory-usage true python test_linear.pyWhen you enable memory usage tracking, Asight Systems displays PPU memory usage on the timeline, which lets you analyze memory usage, as shown in the figure below:
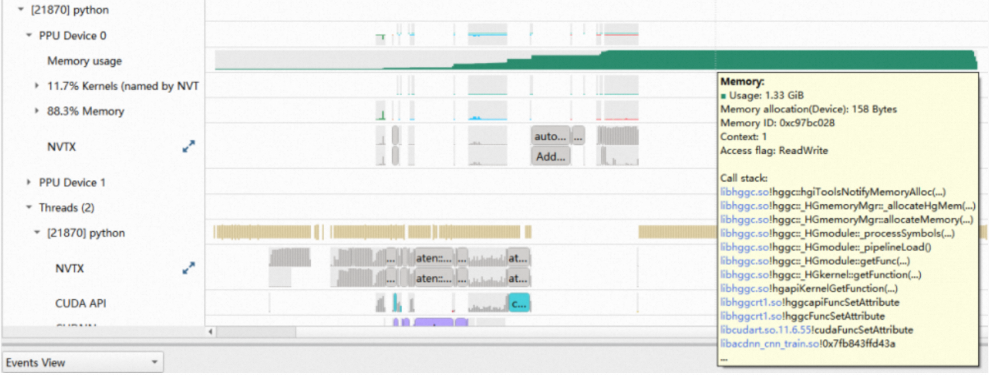
The "Device memory usage" row shows the PPU memory usage throughout the application's execution. Its features include:
Correlation with CUDA/HGGC API calls.
Support for call stack information.
Display of memory allocation/deallocation events in the Events View.
When a PPU memory allocation fails, Asight Systems marks it with a red dot on the "Device memory usage" row:

In the Device Memory View, you can view Top Down, Bottom Up, and Flat tables.
Tips:
You can control the call stack collection depth with the
--hggc-backtrace-depthoption. The default depth is 24 frames. For example,--hggc-backtrace-depth 50sets the maximum backtrace depth to 50 frames.This feature does not track device memory freed by the HGGC destructor when the process exits.
7.2 Host memory usage
asys supports periodically sampling an application's host memory usage. Use the --host-memory-sampling option to enable host memory sampling and the --host-memory-sampling-frequency option to control the sampling frequency. For example:
asys profile -t hggc --host-memory-sampling true --host-memory-sampling-frequency 500 python test_linear.py
Sampling host memory lets you view how host memory usage for each process changes over time in the Asight Systems GUI:

The view displays two types of memory usage:
Resident set size: The actual physical memory usage.
Watermark: The peak physical memory usage during the collection period.
Tip: asys supports tracking system memory usage for the application's process tree (the root process and its descendants). This feature is disabled when system-wide tracing (-s system-wide) is enabled.
7.3 Pinned memory usage
asys supports tracking an application's pinned memory usage. It captures the call stack when pinned memory is allocated or freed and aggregates this data to provide pinned memory statistics. Pinned memory tracking is enabled by default when you enable both the --hggc-memory-usage (for device memory) and --host-memory-sampling (for host memory) options. For example:
asys profile -t hggc --hggc-memory-usage true --host-memory-sampling true python test_linear.py
Collecting pinned memory usage data lets you view how each process's pinned memory usage changes over time and see summary statistics on pinned memory usage by various APIs, as shown in the figure below:
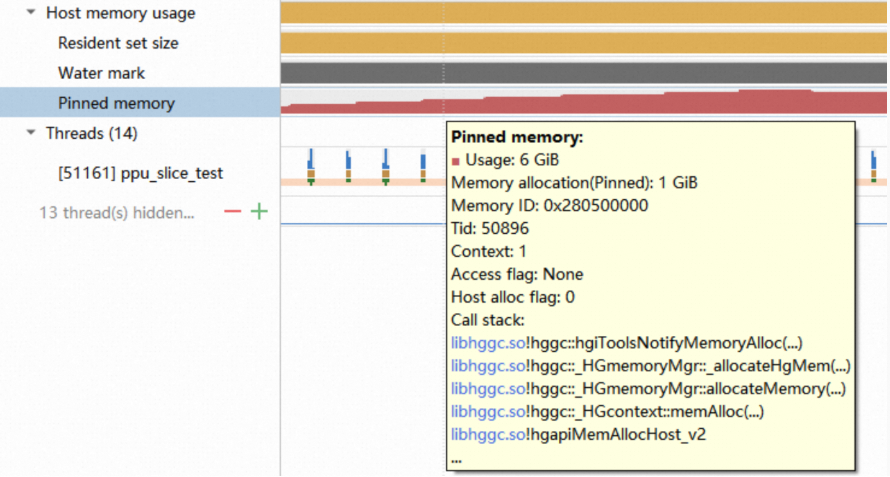
The figure above shows how pinned memory usage changes over time. The tooltip displays details about the corresponding allocation/deallocation event and its call stack information. The Events View also displays pinned memory events. In the Host Pinned Memory View, you can view the data in Top Down, Bottom Up, and Flat tables.
Tips:
You can control the call stack collection depth with the
--hggc-backtrace-depthoption. The default depth is 24 frames. For example,--hggc-backtrace-depth 50sets the maximum backtrace depth to 50 frames.This feature does not track pinned memory freed by the HGGC destructor when the process exits.
8. Python tracing
8.1 Collecting Python call stacks
8.1.1 Python sampling
asys periodically samples the call stack of a running Python script, including function names, file names, and line numbers. This information is displayed in the Asight Systems GUI:
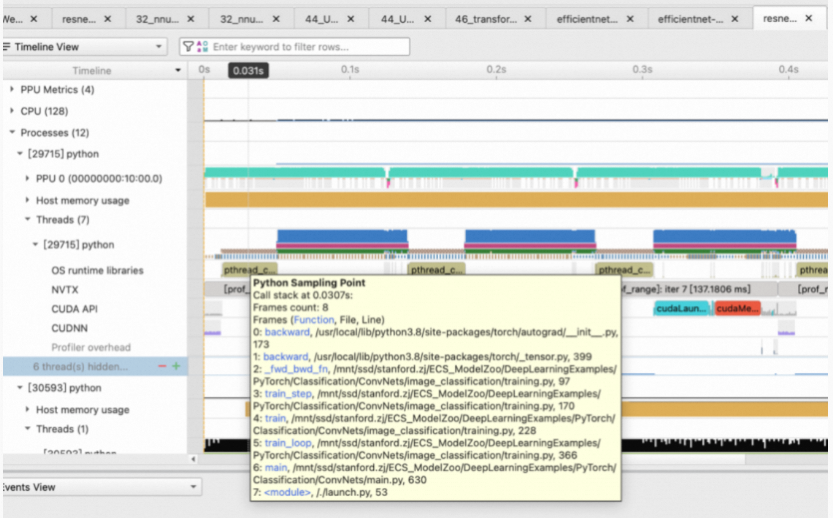
Use the --python-sampling option to enable periodic sampling of the Python call stack and the --python-sampling-frequency option to control the sampling frequency. For example:
asys profile --python-sampling true --python-sampling-frequency 1000 python launch.py
--python-sampling true: Enables periodic sampling of the Python call stack. This option is on by default.--python-sampling-frequency 1000: Controls the sampling frequency. The valid range is from 1 Hz to 1 kHz. The default is 500 samples per second (500 Hz).--python-backtrace-depth: Specifies the call stack depth for Python Sampling, with a default of 24.
8.1.2 Python backtrace
asys can collect the Python call stack when a specific event occurs. This stack is then combined with the C call stack to show the complete call chain.
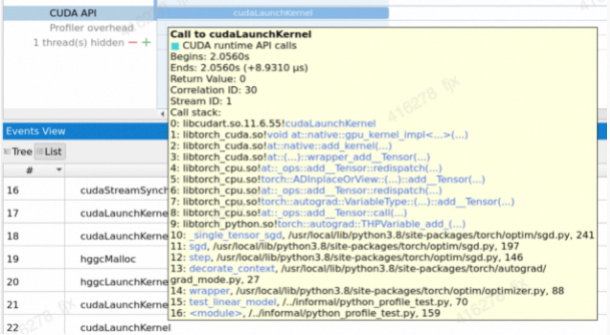
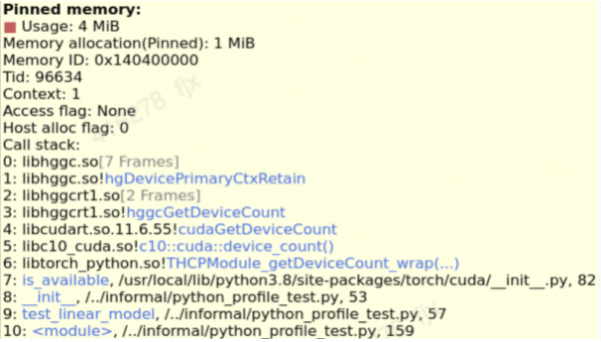
Enable this feature using --python-backtrace=hggc and control the call stack depth with --python-backtrace-depth. Python Backtrace currently supports the following trace events:
hggc
For example:
asys profile --python-backtrace=hggc python launch.pydevice memory / pinned memory
For example:
asys profile --hggc-memory-usage=true --host-memory-sampling=true --python-backtrace=hggc python launch.py
Note:
asys Python call stack collection currently supports only Python versions 3.8 to 3.12.
Collecting the Python call stack is not supported for applications launched with an aliased Python interpreter (one not named
pythonorpython3).
8.2 Tracing python functions
asys can collect execution data for Python functions without modifying the source code. This data is displayed as an HGTX range:

Use the --python-functions-trace option to specify functions in different modes. The available modes are as follows:
Value | Description |
none | Does not collect any functions (default). |
all | Collects all functions in the Python script. |
module:<module_name> | Collects all functions within the specified module. You can specify a parent module. To specify multiple modules, use a comma-separated list, for example: |
<json_file> | Collects functions specified in the JSON file. |
You can use the --python-functions-threshold option to set a minimum runtime threshold for tracing a Python function. The unit is nanoseconds (ns), and the default value is 80,000 ns. You can specify functions in a JSON file in the following three ways:
Specify a module to trace all its functions, including those in its sub-modules. For example, specifying 'torch' also traces functions in 'torch.nn'.
[
  {
    "module": "torch.nn.functional"
  },
  {
    "module": "threading"
  }
]
Specify a module with its fully qualified name and a list of functions within that module. You can also define a custom domain (the default domain is 'Python Hgtx').
[
  {
    "module": "torch.nn.functional",
    "domain": "Torch Domain",
    "functions": ["sigmoid","log_softmax"]
  }
]
In the list of functions for a specific module, you can override attributes for individual functions. If a function entry specifies a module, it overrides the parent module. A function-level domain entry overrides the parent-level setting for that function.
[
  {
    "module": "torch.nn.functional",
    "domain": "Parent Domain",
    "functions": ["sigmoid", {"function": "Adadelta.step", "module": "torch.optim.adadelta", "domain": "Child Domain"}]
  }
]
You can combine these methods. If there are conflicting specifications, the last one specified takes precedence.
For example, to collect all functions in the torch module and set the runtime threshold to 1,000 ns:
asys profile --python-functions-trace module:torch --python-functions-threshold 1000 python xx.py
Note:
Python Functions Trace supports Python 3.8 and later.
In multi-threading scenarios, data collection for a child thread may be delayed.
Specifying functions within the
__main__module is not supported.Function collection might be inaccurate before and after an application forks.
9. PCCL activity tracking
asys can collect PCCL activity events. Enable collection with the -t pccl option. For example:
asys profile -t pccl hggc python test_pccl.pyThe timeline is shown below:
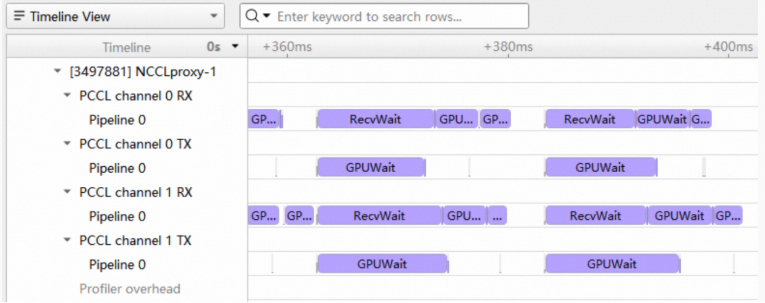
The PCCL timeline is categorized by channel, and then by pipeline.
10. RDMA network card runtime metrics
asys can periodically collect runtime metrics from RDMA network cards on the system, such as bytes sent and received, average packet size, and congestion control information. The Asight Systems GUI plots these metrics over time:
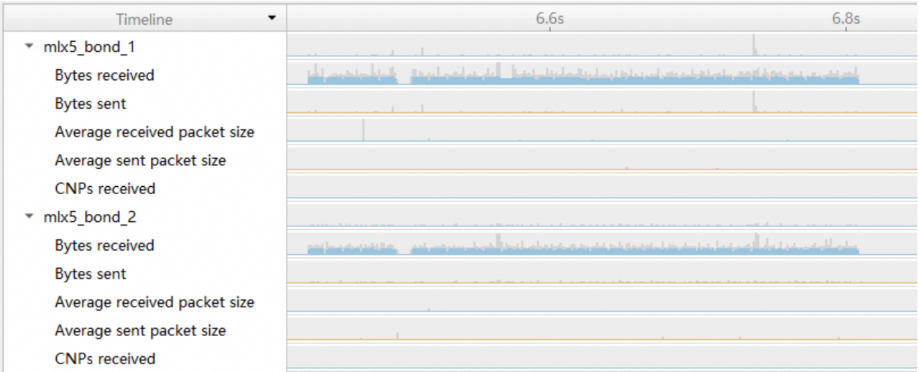
The displayed metrics include:
network receive speed
network send speed
network receive packet size
network send packet size
network receive CNP rate
network send CNP rate
send wait
When you select a time range, the tooltip shows the average network transmission speed for that selection, as shown below:
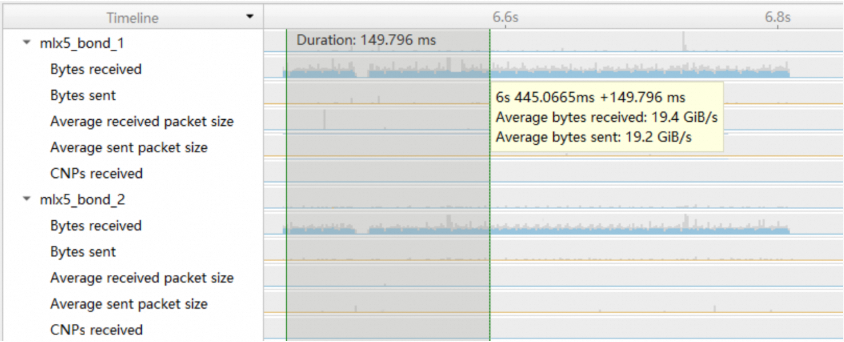
To enable network card metrics collection, use the --nic-metrics option. asys collects runtime metrics from all network card devices on the system and displays the active devices in the GUI. For example:
asys profile --nic-metrics true ./all_reduce_perf--nic-metrics true: Enables runtime metrics collection for network cards.
Use the --nic-device-include option to specify regular expressions for filtering network card devices by name. Separate multiple rules with a comma (,). If a network card's name matches a rule, asys collects metrics from that card. For example:
asys profile --nic-metrics true --nic-device-include "bond" ./all_reduce_perf--nic-device-include "bond": Collects metrics for network card devices whose names contain "bond".
asys profile --nic-metrics true --nic-device-include "bond,eth" ./all_reduce_perf--nic-device-include "bond,eth": Collects metrics for network card devices whose names contain "bond" or "eth".
Use the --nic-metrics-frequency option to control the sampling frequency. The value can range from 1 Hz to 100 kHz, with a default of 1 kHz.
asys profile --nic-metrics true --nic-metrics-frequency 10000 ./all_reduce_perfNote: Due to limitations of the RDMA driver interface, the actual sampling frequency might not reach the configured value. If you specify a frequency that exceeds the maximum supported rate, asys collects data at the highest achievable rate.