This document explains the terms used in the Mobile Monitoring service.
Crash analysis
Term | Description | Use case |
Java crash | A crash that occurs in the Java code layer. | Android crashes |
native crash | A crash that occurs in the native code (C/C++) layer. | Android and HarmonyOS crashes |
JS crash | A crash that occurs in the ArkTS code layer. | HarmonyOS crashes |
app freeze | An app freeze occurs when an app fails to respond to user interactions, such as taps, within a specific time limit. | HarmonyOS lag |
crash | An unexpected app termination detected by a process exit signal. | iOS crashes |
OOM | An acronym for Out of Memory. This type of crash occurs when a device has insufficient memory. | Android crashes iOS crashes |
Watchdog | An operating system service that monitors applications. It terminates an app if it detects that the app is unresponsive or fails to complete a critical operation within a specified time. | iOS crashes |
ANR | An acronym for Application Not Responding. On Android, an ANR occurs when an application is unresponsive, prompting the system to display a dialog that allows the user to either wait or force the app to close. | Android lag |
memory leak | Occurs when objects such as Activity, IntentReceiver, and ServiceConnection are not released from memory after they are no longer needed. | Android exceptions |
oversized image | The use of an image resource that is significantly larger than its display area. This practice consumes excessive memory and can lead to an Out of Memory (OOM) error. | Android exceptions |
resource leak | Occurs when a program fails to release a resource it has acquired, such as a file or a database connection. The StrictMode tool can help detect such leaks. | Android exceptions |
main thread lag | A period of unresponsiveness on the main thread. This service flags lag that lasts more than 1 second on Android and 5 seconds or more on iOS. | Android lag and iOS lag |
custom error | An error that developers report by calling a specific SDK API. | Android and iOS exceptions |
insecure code | Code practices that can lead to security vulnerabilities, such as file URI exposure and non-HTTPS requests. These issues can be detected by tools like StrictMode. | Android exceptions |
[Error Type] rate | The rate at which a specific type of error occurs, calculated by dividing the number of [Error Type] events by the total number of app launches within a given period. | - |
user [Error Type] rate | The percentage of unique devices affected by a specific error type. It is calculated by dividing the number of affected devices by the total number of unique devices that launched the app within a given period. | - |
affected device count | The total number of unique devices that have experienced a specific type of error. | - |
UTDID | An app-level device identifier. UTDID provides a simple and secure way to obtain a unique ID for a specific device. | - |
Performance analysis
Term | Description |
cold launch | Launching an app when its process is not already running. |
hot launch | Bringing an app that is already running in the background to the foreground. |
warm launch | Relaunching an app where the process is still running but its activities have been destroyed (for example, after the user presses the back button). This type of launch is specific to Android. |
launch time | The duration of an app launch. If a custom launch end node is configured in the SDK, the calculation uses this custom endpoint. |
slow launch | An app launch where the launch time meets or exceeds the configured slow launch threshold (default: 3,000 ms). |
slow launch rate | The percentage of app launches that are classified as slow launches. Calculated as: (Slow Launches / Total Launches). |
launch crash | A crash that occurs during the app launch process. |
launch crash rate | The percentage of app launches that result in a crash. Calculated as: (Launch Crashes / Total Launches). |
custom launch end node | A custom marker set via the SDK to define the end of the app launch process. When this is configured, all launch-related metrics (such as launch time distribution, trends, and slow launch detection) are calculated based on this endpoint. |
custom sub-stage | A developer-defined stage within an app launch or page load, reported via the SDK for more granular performance analysis. |
custom dimension | A developer-defined dimension for tracking business-specific data, reported via the SDK. This allows you to filter data and analyze performance within a specific business context. |
load time | The time it takes for a device to load a page. |
slow load | A page load that meets or exceeds the configured slow load threshold (default: 3,000 ms). |
slow load rate | The percentage of page loads that are classified as slow. Calculated as: (Slow Loads / Total Page Loads). |
scrolling frame rate | The rate at which frames are rendered per second (fps) while a user scrolls a page. To ensure fair comparisons, the service normalizes frame rates from all devices to a 60 Hz baseline. |
jank | A noticeable stutter during scrolling caused by a frame taking too long to render. A frame is classified as jank if its render time is both more than double the average of the previous three frames and exceeds 83.33 ms. |
frozen frame | A severe type of jank where a single frame takes more than 700 ms to render. |
average | The average value calculated from a set of data samples. |
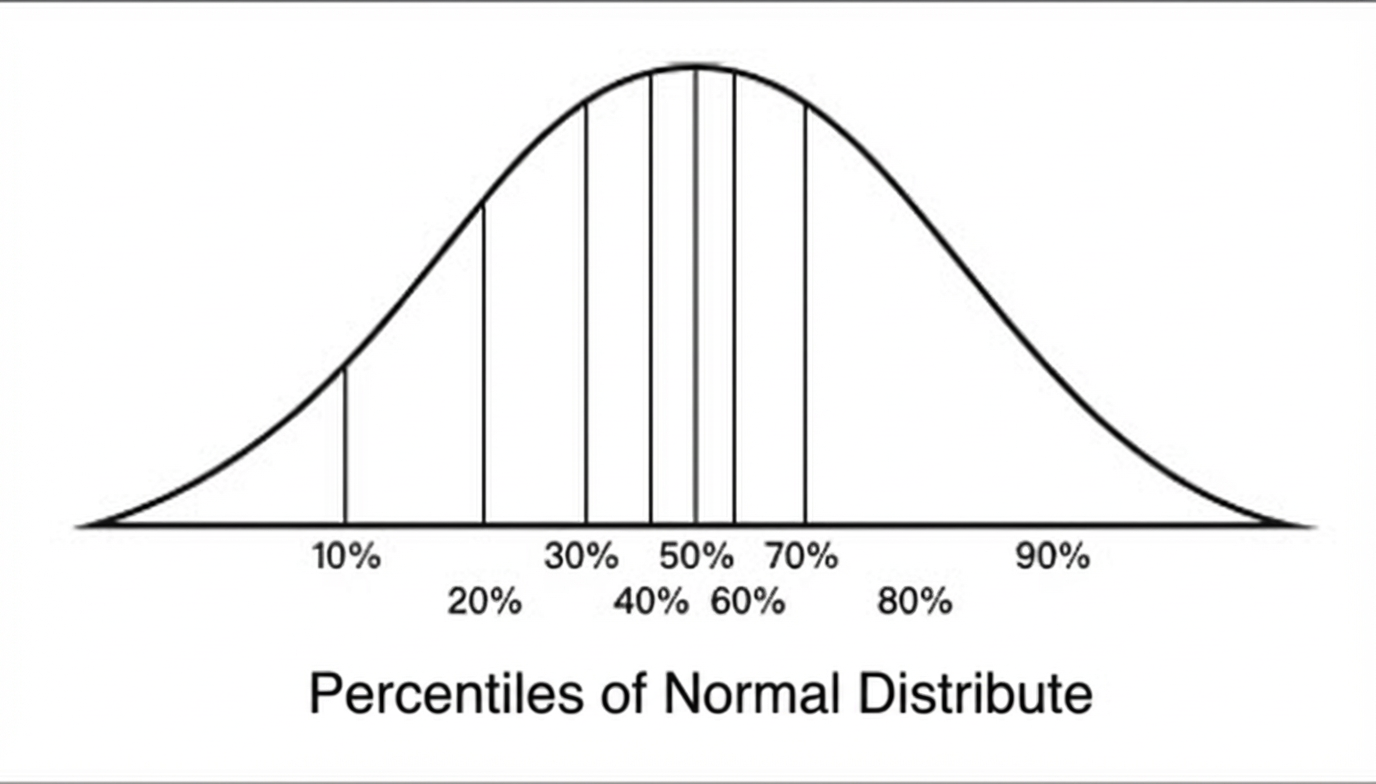
quantile | A value that divides the probability distribution of a random variable into continuous intervals with equal probabilities. Common examples include the median (the 2-quantile), quartiles, and percentiles. For more information, see this link. For example, the percentiles of a normal distribution are shown in the following figure:
|
90th percentile | The value below which 90% of the data samples fall. It indicates that 90% of the recorded values are less than or equal to this value. |
median | The middle value in a sorted dataset. For more information, see this link. |
connection reuse rate | The percentage of network requests that reuse an existing connection instead of creating a new one. It is calculated as: (Requests Reusing Connections / Total Requests). |
network error | An error occurring during a network request. Examples include DNS resolution failures, SSL handshake errors, connection timeouts, and other issues that prevent a successful connection. |
HTTP status code | A code returned by a server to indicate the status of an HTTP request. Responses are grouped into five classes: informational (1xx), successful (2xx), redirection (3xx), client errors (4xx), and server errors (5xx). |
error rate | The percentage of total requests that result in an error. An error is typically defined as a response with a 4xx or 5xx HTTP status code. |
sending time | The duration from the start to the completion of sending request data. |
waiting time | The duration between the completion of sending a request and the start of receiving a response. This is also known as time to first byte (TTFB). |
receiving time | The duration from the start to the completion of receiving response data. |
init_time_avg | The time taken by the Application.attachbaseContext() method. Android only. |
build_avg | The time from the end of Application.attachbaseContext() to the end of Application.onCreate(). Android only. |
load_avg | The time from the end of Application.onCreate() to the end of MainActivity.onResume(). Android only. |
from_exec_to_load | The phase from app process launch to the completion of SDK loading. iOS only. |
from_load_to_main | The phase from the completion of SDK loading to the |
from_main_to_didFinishLaunching | The phase from the |
from_load_to_didFinishLaunching | The phase from the completion of SDK loading to the arrival of the |
from_didFinishLaunching_to_first_render_time | The phase from the arrival of the |
from_vc_loadView_to_didAppear | The phase from FirstVC.loadView() to the end of FirstVC.viewDidAppear(). iOS only. |
Remote logging
Term | Description |
remote logging/user log | Logs generated by an application and stored on the end-user's device. This term is often used in the context of remote logging. |
log fetching | The process of retrieving logs from a user's device to the remote logging console for analysis. |
log level | A category that indicates the severity of a log message. The levels are ordered from highest to lowest:
|
fetch level | A setting that limits the level of logs that are pulled to the console. Only logs at or above the specified fetch level are retrieved.
The fetch level is configured globally during SDK initialization. If not set, it defaults to Info. |
fetch task | A specific operation to retrieve logs from one or more devices. You can target devices using either device-specific fetching or conditional fetching. |
task type | The method used to define the target devices for a fetch task. See device-specific fetching and conditional fetching for details. |
device-specific fetching | Retrieves logs by sending a command to a known, previously online device. This method helps troubleshoot issues on specific devices. |
conditional fetching | Presets filter rules to monitor for devices coming online and retrieve logs. This method captures logs in real time from any device, new or existing, that matches the specified conditions. |
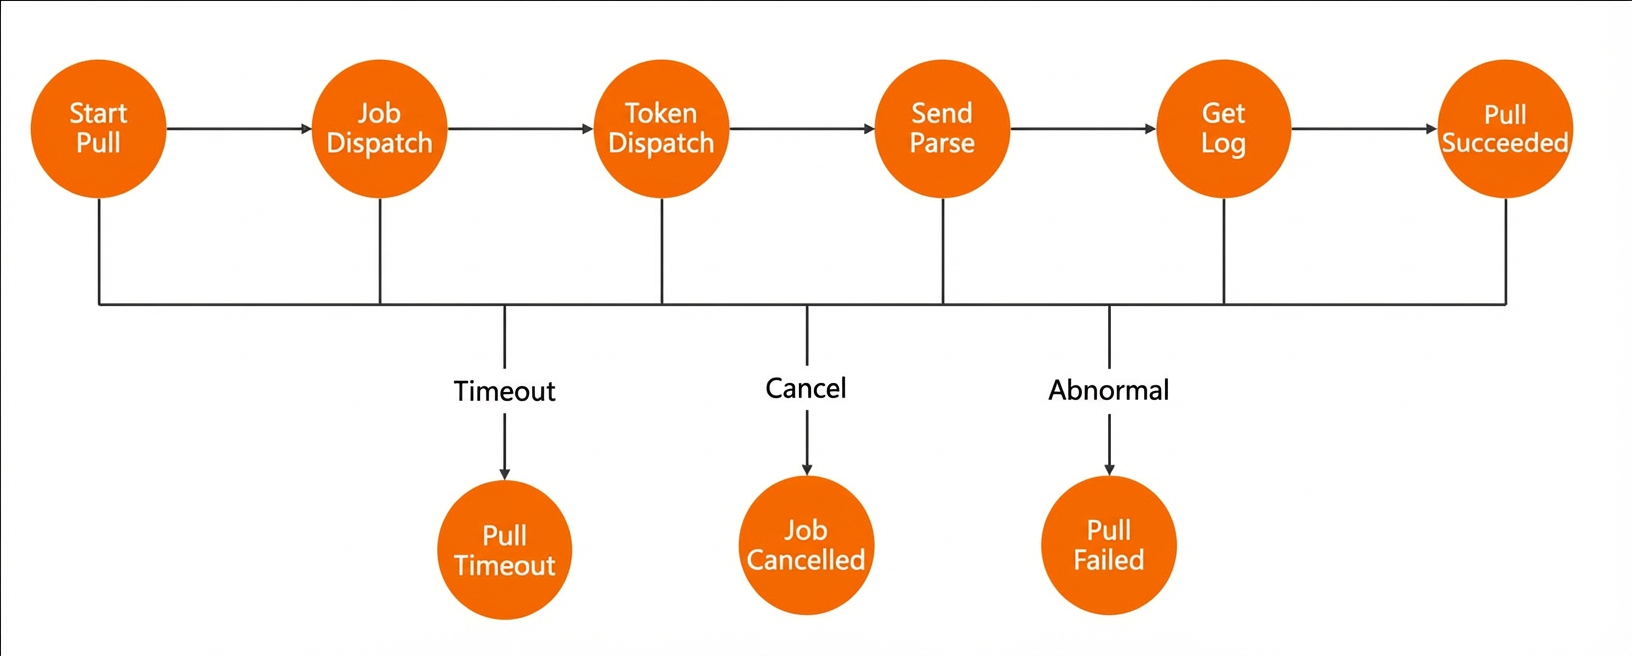
fetch status | The stages that describe the progress of a fetch task. The fetch statuses include:
|
manual add | Creates a device-specific fetching task by specifying a target device's device ID or user nickname. |
crash analysis fetching | A log fetch triggered by the crash analysis service to investigate a specific crash issue. |
crash ID | A unique identifier assigned to a group of similar crash events, allowing for aggregated analysis. |