This topic describes how to view detailed data for crashes, stuttering, and exceptions in a specific application using Crash Analytics. You can also view aggregate data for each type.
Terms
Aggregate data is data that is collected over a specific time period and grouped by intervals, such as 1 minute, 5 minutes, 1 hour, or 1 day.
For example, if the aggregation period is 1 day, the data for the last 7 days is displayed in daily segments.
By default, for 1-minute and 5-minute aggregations, data from the last 15 minutes is displayed.
By default, for 1-hour aggregations, data from the last 24 hours is displayed.
By default, for 1-day aggregations, data from the last 7 days is displayed.
View data analytics
The procedure for viewing detailed data is similar for crashes, stuttering, and exceptions. The following example shows how to view detailed crash data:
Log on to the EMAS console, select Application Monitoring, and then click Enter to open the Application Monitoring console.
In the navigation pane on the left of the Application Monitoring console, click Crash Analytics. Then, select Crash, Stuttering, or Exception.
Set the filter options as needed and click Query. For more information about filter features, see More search options. The following example uses a 1-day aggregation for the last 7 days.
View the detailed data in the Crash Analysis, Crash Distribution, Crash Ranking, and Crash List sections.
View crash analysis
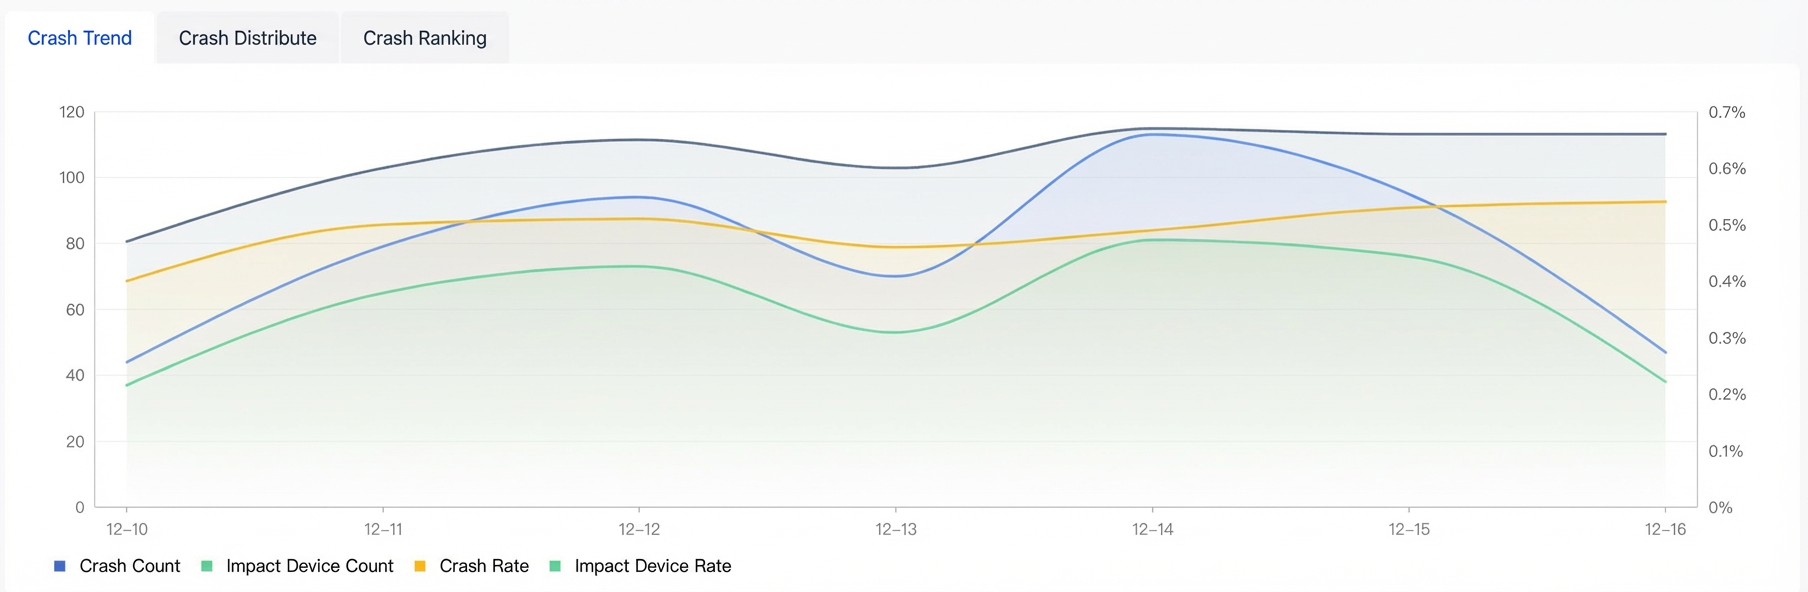
A line chart displays the crash analysis details based on the filter criteria.
Parameter |
Description |
Number of crashes |
The number of crashes that match the filter criteria. |
Affected devices |
The number of devices affected by crashes that match the filter criteria. |
Crash rate |
Crash rate = Number of crashes that match the filter criteria / Number of application launches that match the filter criteria. |
Affected device rate |
Affected device rate = Number of affected devices that match the filter criteria / Number of devices that launched the application and match the filter criteria. |
View crash distribution
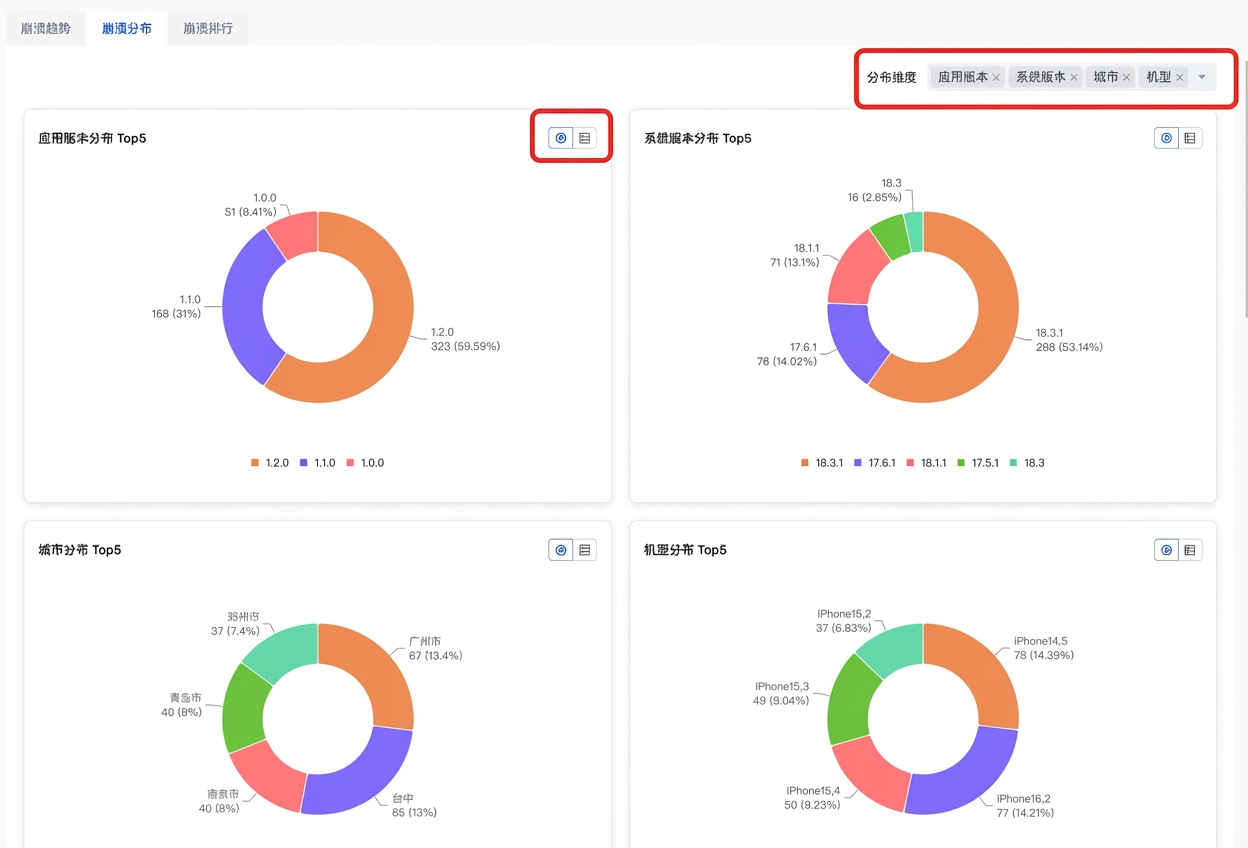
The crash distribution is displayed based on the filter criteria.
On the Crash Distribution tab, select the required search filter options, such as OS Version, App Version, Build Number, Brand, Model, Channel, City, Page, and Process.
NoteAt least one metric is displayed in the legend. By default, four metrics are shown.
(Optional) Click the
 icon to switch the view between a distribution graph and a list.
Parameter |
Description |
OS version |
OS version percentage = (Count of filtered OS versions / Total count of OS versions) × 100% |
Application version |
Application version percentage = (Count of filtered application versions / Total count of application versions) × 100% |
Build number |
Build number percentage = (Count of filtered build numbers / Total count of build numbers) × 100% |
Brand |
Brand percentage = (Count of filtered brands / Total count of brands) × 100% |
Device model |
Device model percentage = (Count of filtered device models / Total count of device models) × 100% |
Channel |
Channel percentage = (Count of filtered channels / Total count of channels) × 100% |
City |
City percentage = (Count of filtered cities / Total count of cities) × 100% |
Page |
Page percentage = (Count of filtered pages / Total count of pages) × 100% |
Process |
Process percentage = (Count of filtered processes / Total count of processes) × 100% |
View crash list
Based on the filter criteria, the crash list displays aggregated data for each class of crash. The data includes Crash Name, Crash Count, Crash Rate, Affected Devices, Affected Device Rate, First Seen Version, and Status.
Metric |
Description |
Crash Name |
Click a name to go to the Crash Details page and view more aggregation details. |
Crash Count |
The icon next to the number shows a preview of the crash count trend chart. Hover over the trend chart to view specific values. |
Crash Rate |
Crash rate = Number of crashes that match the filter criteria / Number of application launches that match the filter criteria. |
Affected Devices |
The number of devices affected by crashes that match the filter criteria. |
Affected Device Rate |
Affected device rate = Number of affected devices that match the filter criteria / Number of devices that launched the application and match the filter criteria. |
First Seen Version |
The application version in which this issue first appeared. |
Status |
|
Aggregate data is divided into three parts: View basic information, View issue analysis, and Detailed information.