View detailed information
The details page displays all error instances aggregated by crash name. Each instance represents a device where the error occurred. The procedure for viewing details is the same for crashes, stuttering, exceptions, and custom errors. This topic uses a crash as an example.
Procedure
Log on to the EMAS Management Console. Select Application Monitoring and click to enter the Application Monitoring console.
In the navigation pane on the left, choose Application Monitoring - Crash Analysis. Then, select Crash, Stuttering, or Exception.
Set the required filters and click Query.
In the Crash List section, click a crash name to open the crash aggregation analysis page.
Page overview
The left side of the details page lists all error instances that share the same crash name. When you click an instance, the right side displays its Basic Information, Error Stack, Contextual Data, ConsoleLog, Custom Log, Process Information, and Symbol Table.
Page features
On this page, you can use the Resymbolicate and Search Instance features.
Resymbolicate: Reruns the symbolication process.
Search Instance: Searches for a specific crash instance by device Utdid.
Basic information
Basic information shows details about the device where each error instance occurred.
Parameter |
Description |
Utdid |
The Utdid of the device where the crash occurred. |
User ID |
The user ID on the device where the crash occurred. |
Application version |
The application version on the device where the crash occurred. |
User nickname |
The user nickname on the device where the crash occurred. |
Device name |
The name of the device where the crash occurred. |
System version |
The system version of the device where the crash occurred. |
Report time |
The time the crash was reported from the device. |
Crash time |
The time the crash occurred on the device. |
Startup time |
The startup time of the device where the crash occurred. |
Startup phase |
If the issue occurred within 5 seconds of startup, it is considered the startup phase. |
Error stack
The error stack provides the detailed stack trace reported when the crash occurred. This information is crucial for analyzing and resolving crash issues.
If no symbol table is uploaded, the original stack is displayed. After a symbol table is uploaded and parsed, the restored stack is displayed.
If the symbol table or parsing is incorrect, click Resymbolicate on the Symbol Table page.
By default, the restored stack expands the thread stack where the crash occurred. If the current thread stack does not provide enough information to locate the problem, click Expand Call Stack to view other thread stacks.
You can search the stack, download the full stack, and copy the full stack or individual thread stacks.
Stuttering flame graph, stack tree, and time slice
The error stack for stuttering supports three different visualizations: flame graph, stack tree, and time slice.
When troubleshooting stuttering issues, developers should use these three views along with three key time metrics: total stuttering duration, key stack duration, and maximum leaf node duration.
The current stack capture interval is 300 ms.
In the flame graph, the x-axis represents relative time, and the y-axis represents the call depth. The width of a function block reflects its execution duration. Colors distinguish between system and business stacks.
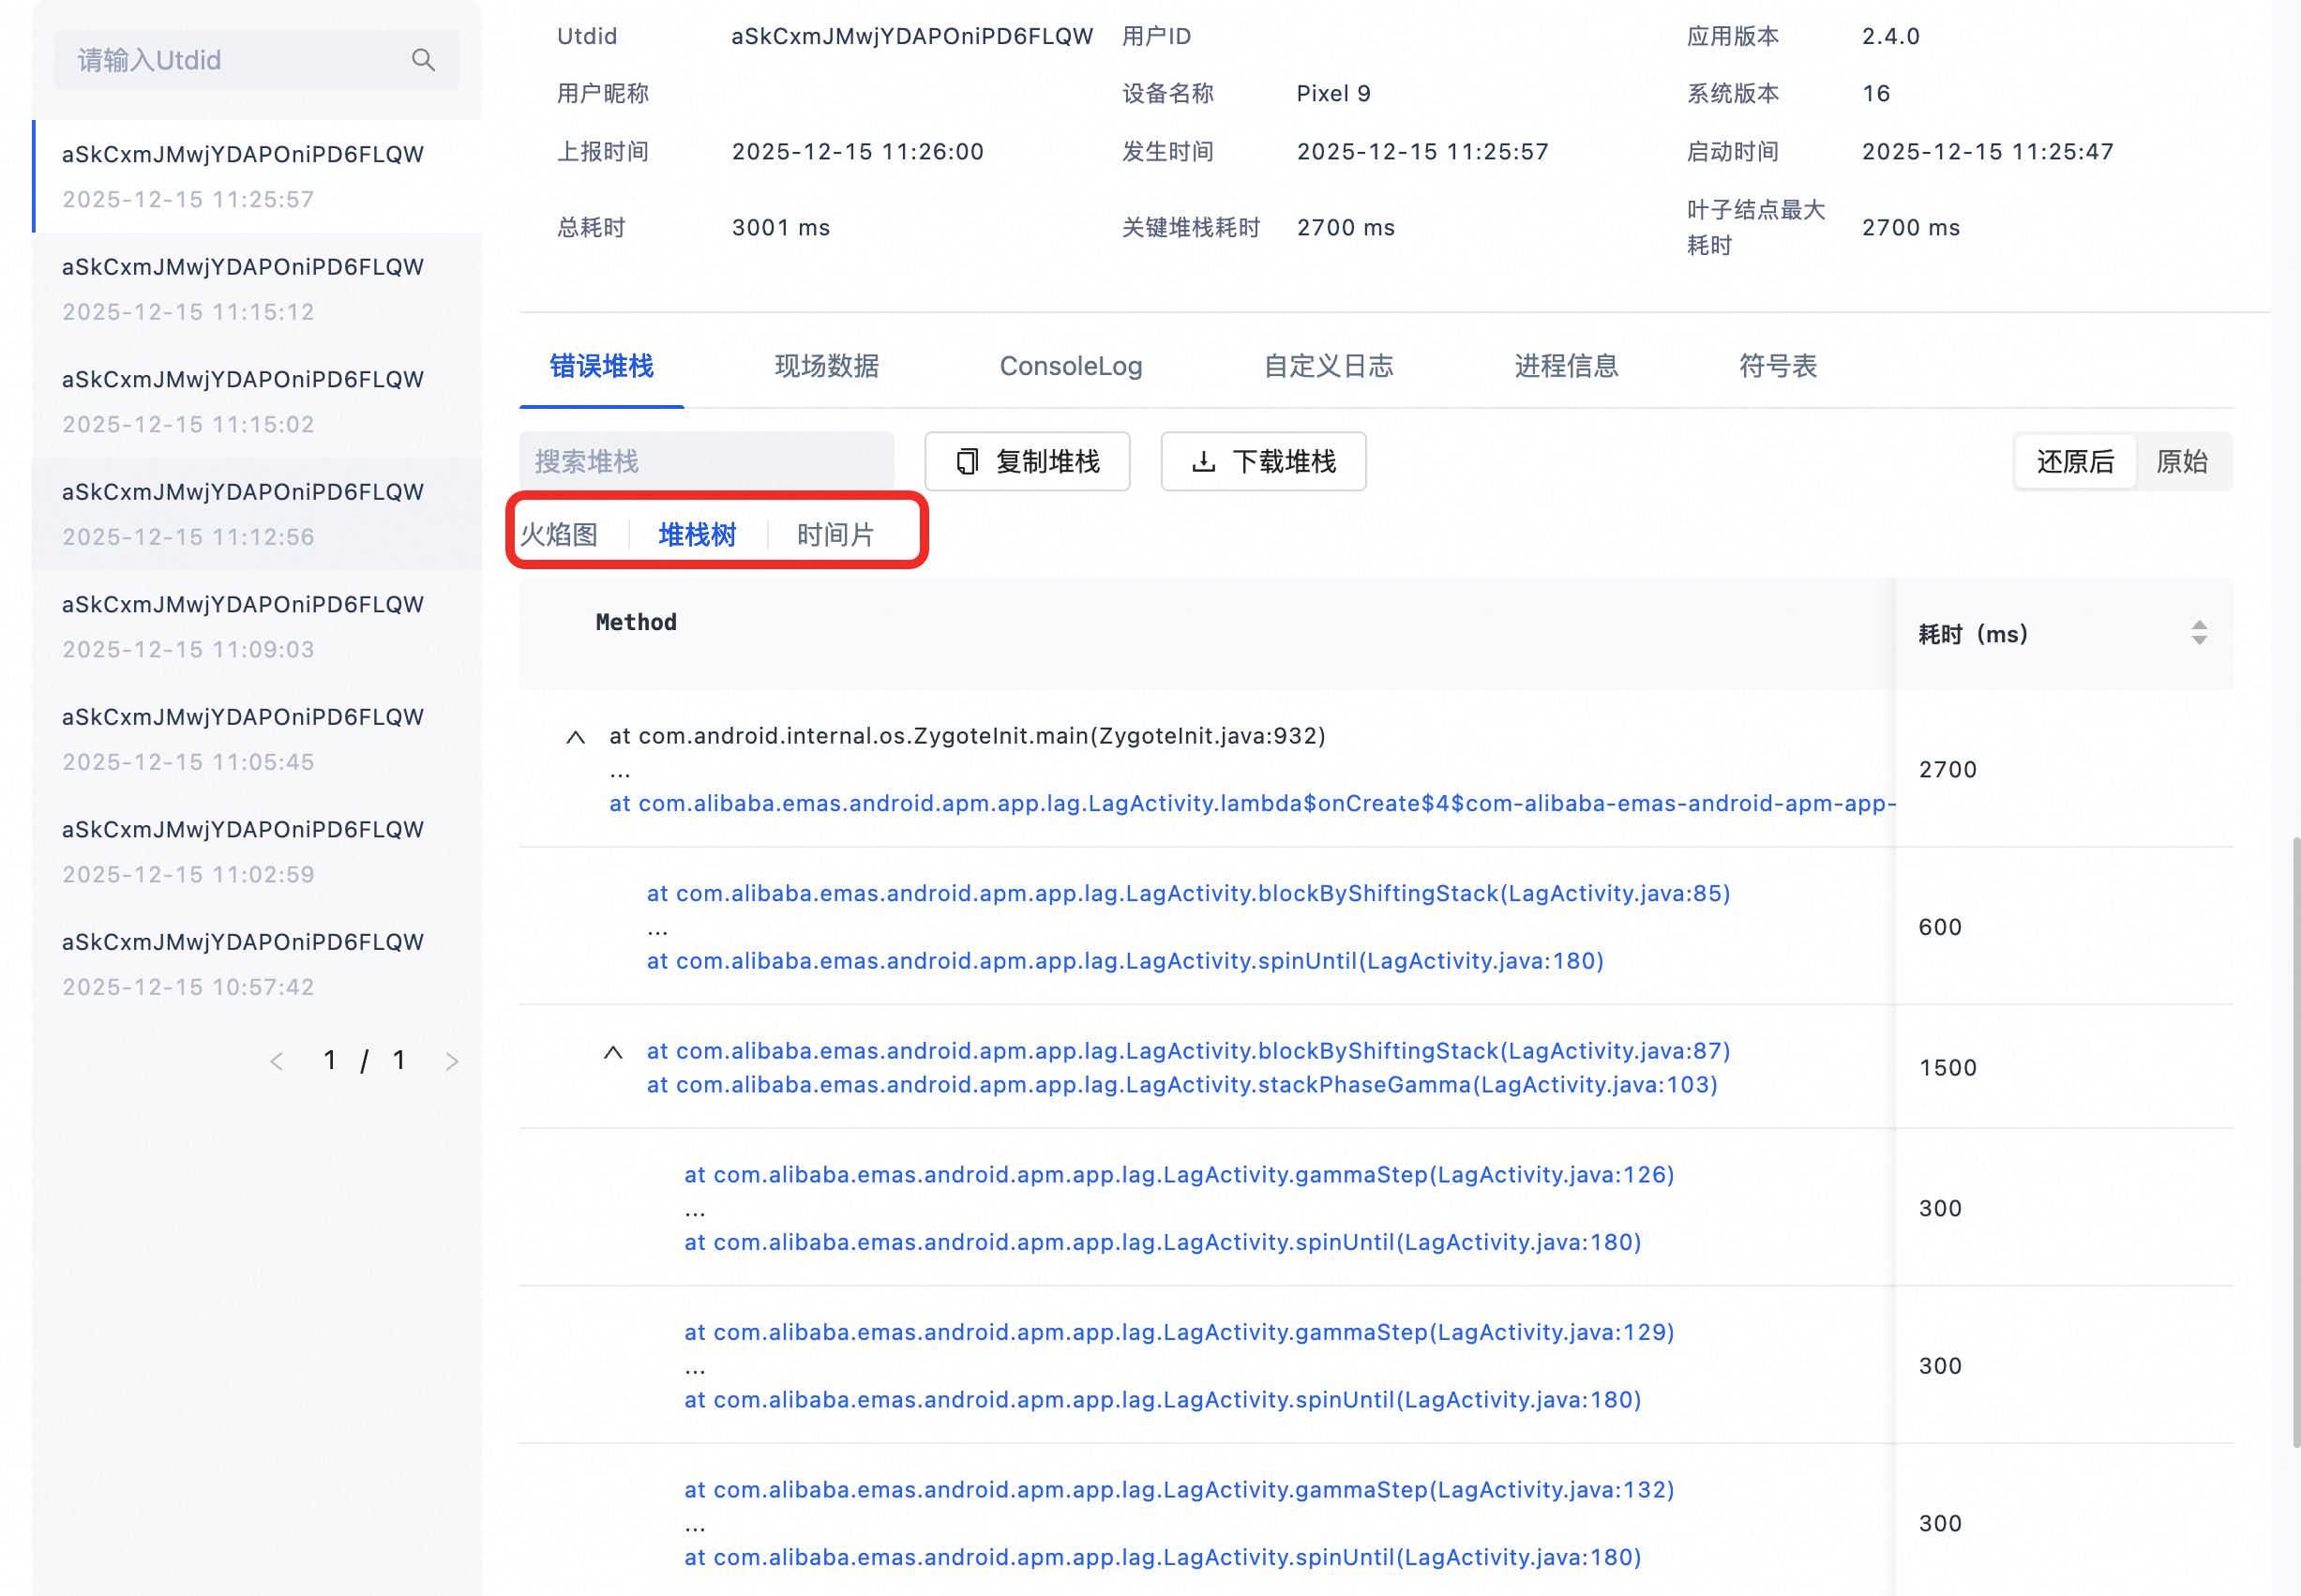
The following figure illustrates a stack tree.
Time slice analysis displays data in the order it was collected. Adjacent call stack fragments with identical content are automatically merged.
On-site data
This section displays the context of the crash instance, including basic information, memory information, and custom data.
Basic information
Parameter |
Description |
appKey |
The AppKey used when integrating Crash Analytics. |
Application version |
The application version passed during Crash Analytics integration. |
Build number |
Refers to VersionCode in Android and BundleVersion in iOS. |
Channel |
The channel identifier passed during Crash Analytics integration. |
Report time |
The time the report was received. This is a server-side time. |
Startup time |
The time the application started. This is a client time. |
Crash time |
The time the crash occurred. This is a client time. |
Brand |
The brand of the device where the crash occurred. |
Model |
The model identifier of the device where the crash occurred. |
Operating system |
The operating system of the device at the time of the crash. |
Operating version |
The operating system version of the device at the time of the crash. |
Carrier/Network |
The carrier and network information of the device at the time of the crash. |
Country/Region |
The geographical location of the device at the time of the crash, estimated based on the IP address. |
Province/City |
The province and city where the device was located at the time of the crash. |
User IP |
The public IP address of the device at the time of the crash. |
Resolution |
The screen resolution of the device where the crash occurred. |
Page |
The page that was open in the application at the time of the crash. |
Is foreground |
Indicates whether the crash occurred in a foreground process. |
Is main thread |
Indicates whether the crash occurred in the main thread. |
Process name |
The name of the crashed process. |
Parent process name |
The name of the parent process of the crashed process. |
CPU architecture |
The CPU architecture of the device at the time of the crash. |
Language |
The language used by the device at the time of the crash. |
Memory information
This section shows the device's memory state when the crash was reported.
Android
Parameter |
Description |
dalvikPss |
The Proportional Set Size (PSS) of a Java heap is the amount of actual physical memory that it consumes. |
dalvikPrivateDirty |
Private dirty page memory in the Java heap is memory that is exclusive to this process and has been modified. |
dalvikSharedDirty |
Shared dirty page memory in the Java heap is memory that is shared by multiple processes and has been modified. |
summary.javaHeap |
The total memory of the Java heap. This measures the memory consumption allocated by the process to the Java heap. |
nativePss |
The PSS of the native heap. This measures the actual physical memory consumed by the native heap. |
nativePrivateDirty |
The private dirty memory of the native heap. This memory is exclusive to the process and has been modified. |
nativeSharedDirty |
The shared dirty memory of the native heap. This memory is shared by multiple processes and has been modified. |
summary.nativeHeap |
The total memory of the native heap. This measures the memory consumption allocated by the process to the native heap. |
otherPss |
The PSS of other parts. This measures the actual physical memory consumed by modules other than Java and native, such as resource mappings and third-party libraries. |
otherPrivateDirty |
The private dirty memory of other parts. This memory is exclusive to the process and has been modified. |
otherSharedDirty |
The shared dirty memory of other parts. This memory is shared by multiple processes and has been modified. |
summary.privateOther |
The total private memory of other parts. |
summary.code |
The memory usage of the code segment. This measures the memory consumption of the application's code segment and read-only data. |
summary.stack |
The stack memory usage. This measures the memory consumption of the process or thread stack. |
summary.graphics |
The graphics-related memory usage. This measures the memory consumption of graphics modules, such as OpenGL GPU memory and SurfaceFlinger, occupied by the process. |
summary.system |
The system-related memory usage. This measures the memory consumption allocated by the system, such as ashmem, binder, and ION. |
summary.totalPss |
The total PSS of all memory in the process. Equivalent to totalPss. |
summary.totalSwap |
The total swap space used by the process. |
totalPss |
The total PSS of all memory in the process. |
totalSwappablePss |
The total PSS of all swappable memory in the process. |
totalPrivateClean |
The private clean page memory of all memory. This memory is exclusive to the process and has not been modified. |
totalPrivateDirty |
The private dirty page memory of all memory. This memory is exclusive to the process and has been modified. |
totalSharedClean |
The shared clean page memory of all memory. This memory is shared by multiple processes and has not been modified. |
totalSharedDirty |
The shared dirty page memory of all memory. This memory is shared by multiple processes and has been modified. |
iOS
Parameter |
Description |
active |
The amount of memory currently being actively used by the system, in bytes. |
inactive |
The amount of memory currently marked as inactive by the system, in bytes. |
wired |
The amount of memory currently wired down by the system, in bytes. |
free_mem |
The amount of memory that is unused and immediately available for allocation, in bytes. |
total_mem |
The total amount of physical memory on the device, in bytes. |
virtual |
The total amount of virtual memory currently occupied, in bytes. |
resident |
The actual amount of memory currently residing in physical memory, in bytes. |
footprint |
The total amount of memory that the application actually occupies in physical memory, in bytes. |
HarmonyOS NEXT
Parameter |
Description |
pss |
Proportional Set Size. The actual physical memory used, proportionally allocated based on the number of references to shared libraries. |
rss |
Resident Set Size. The actual physical memory used, including memory occupied by shared libraries. |
vss |
Virtual Set Size. The virtual memory consumed, including memory occupied by shared libraries. |
sys_avail_mem |
The amount of available memory in the system. |
sys_free_mem |
The amount of free memory in the system. |
sys_total_mem |
The total amount of memory in the system. |
Custom data
Shows the properties of custom fields reported through SDK callbacks at the time of the crash. This helps you perform custom analysis.
You can filter this data using Custom Dimension in the filter options.
Page tracking
This section shows the user's page navigation path before the crash. The pages are listed in reverse chronological order.
Consolelog
This feature is supported on Android and HarmonyOS.
This section shows the console log data from the device, captured before and after the crash occurred.
Custom log
Shows custom logs reported through SDK callbacks at the time of the crash.
If you have integrated Remote Log Access, you can click Retrieve Logs for This Device to quickly create a log retrieval task.
Process information
This information is reported only for Android crashes. It is not reported for iOS or HarmonyOS.
Shows process-related information at the time of the crash, including Maps info, Meminfo, process status, and FD info.
Maps info shows the memory mapping of the user process at runtime. You can filter for specific memory segments by address and access permissions.
Meminfo shows detailed memory usage statistics. You can use this information to find memory allocation abnormalities and optimize memory usage.
Memory statistics dimensions
Located on the x-axis of the statistics table, these dimensions describe the physical properties and sharing status of memory pages.
Parameter
Description
Pss Total
Proportional Set Size. The total actual physical memory consumed by the application, including private memory and proportionally shared memory.
Private Dirty
Private dirty memory. Physical memory that is exclusive to the application and has been modified. It cannot be directly reclaimed by the system and represents the core cost of the process.
Private Clean
Private clean memory. Physical memory that is exclusive to the application but has not been modified. The system can reclaim it directly under pressure.
SwapPss Dirty
Proportional swap space usage. The amount of memory swapped to ZRAM or compressed storage, proportionally allocated to the application.
Memory partitions
Located on the y-axis of the statistics table, these partitions describe the logical source of memory usage.
Parameter
Description
Native Heap
Native heap memory. Memory requested by C/C++ code through malloc/new, including Bitmap pixel data on Android 8.0+.
Dalvik Heap
Java heap memory. Memory space allocated by the virtual machine for Java/Kotlin objects.
Dalvik Other
Other virtual machine overhead. Internal memory required for the virtual machine to run, including JIT code cache and GC management data.
Stack
Thread stack. The total stack space required for all active threads in the application to run.
Cursor
Database cursor. A buffer area used to store the result set during a SQLite database query.
Ashmem
Anonymous shared memory. Space allocated by the Android-specific anonymous shared memory (Ashmem) mechanism, used for large data transfers between processes.
Gfx dev
Graphics driver mapping. A memory region mapped to the process space by the graphics card driver, typically used for graphics data interaction with the GPU.
Other dev
Other device mapping. Memory regions mapped to the process space by hardware drivers other than the graphics card driver.
.so mmap
Native library mapping. The mapping in memory of C/C++ dynamic-link libraries (.so files) loaded by the application.
.jar mmap
Java library mapping. The mapping in memory of Java archive files (.jar files) loaded by the application.
.apk mmap
APK mapping. The mapping in memory of the application's installation package file (.apk) and its internal resources.
.ttf mmap
Font mapping. The mapping in memory of font resource files (.ttf or .otf) loaded by the application.
.dex mmap
Bytecode mapping. The mapping in memory of the Dalvik Executable (.dex) files executed by the Dalvik virtual machine.
.art mmap
ART image mapping. The mapping in memory of the preloaded class information and object image (Boot Image) by the ART virtual machine.
.oat mmap
Compiled code mapping. The mapping in memory of the machine code file (.oat) after Ahead-Of-Time (AOT) compilation.
Other mmap
Other file mapping. Other files or memory regions mapped by the application using mmap, other than the types listed above.
EGL mtrack
EGL memory tracking. Graphics buffer (Surface) and display memory usage reported by the graphics driver.
GL mtrack
OpenGL memory tracking. Texture and vertex buffer memory usage reported by the graphics driver.
Other mtrack
Other memory tracking. Other hardware memory usage reported by drivers that is not classified as EGL or GL.
Unknown
Unknown mapping. Anonymous memory mappings that cannot be clearly identified and classified by the system.
Total
Total memory usage. The sum of the physical usage for all the preceding partitions across each metric dimension.
Process status shows a detailed list of the process status at the time of the crash.
FD info shows the file descriptor (FD) usage status at the time of the crash.
-
Parameter
Description
Current number of used FDs
Used to determine if the process is close to FD exhaustion.
Maximum available FDs for the process
A reference baseline.
Usage rate
Formula: Current number of used FDs / Maximum available FDs for the process.
FD type
The category name.
Quantity
The number of FDs in this category.
Percentage
Quantity / Current number of used FDs × 100%.
Details
The original link information for all FDs in this category.
-
Symbol table
Uploading symbol table files to the Crash Analytics console lets you de-obfuscate crash call stacks for easier problem analysis and resolution.
You can upload and download a symbol table.