You can integrate Mesh monitoring metrics with open source components, such as Prometheus. This lets you capture metrics using your own monitoring solution.
Overview
Control plane components, including MOSN, DSRConsole, DRM, OpenAPI, Pilot, Citadel, ACVIP, intelliproxy, and OSP, expose monitoring metrics in the standard Prometheus format. These metrics include component health status, such as Java Virtual Machine (JVM), CPU, memory, and coroutine information, along with custom metrics related to component features.
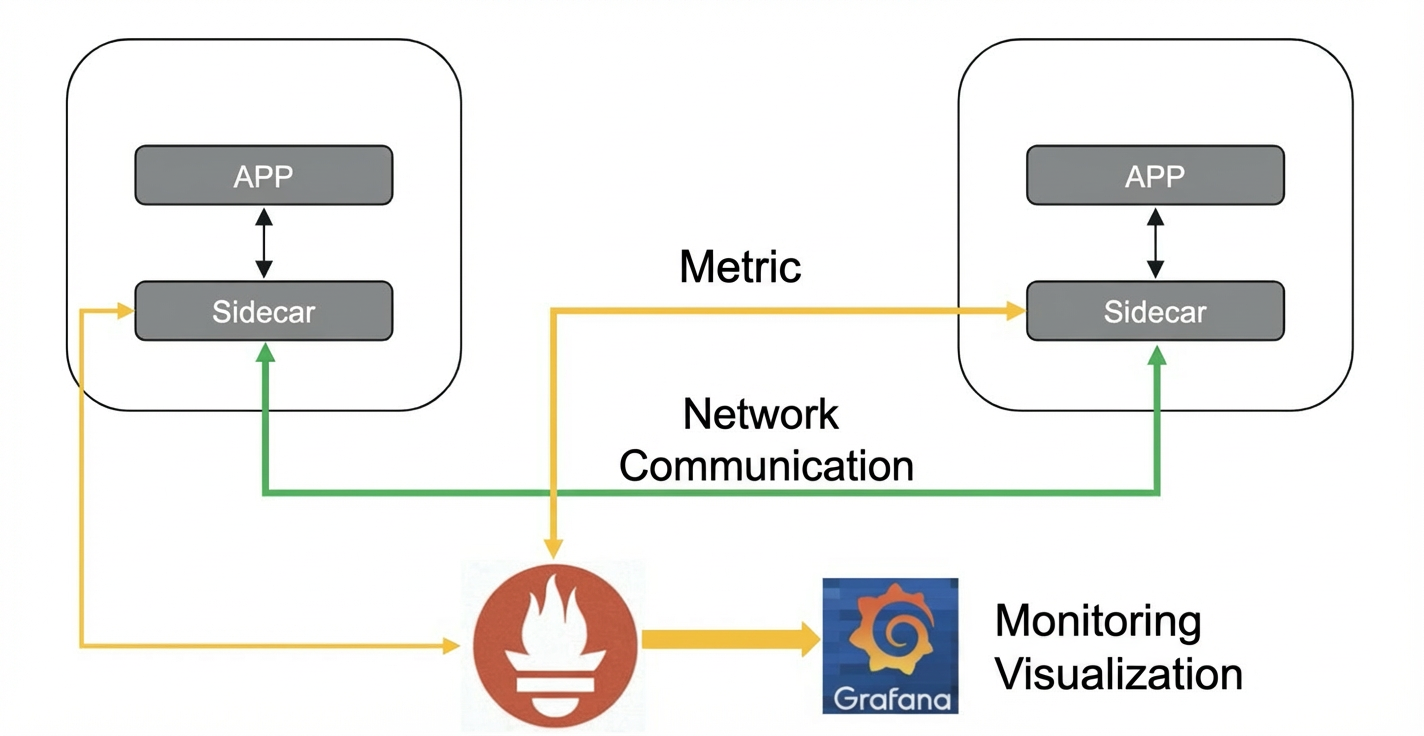
When using Prometheus, you can deploy Prometheus and Grafana separately. Then, you can configure a Job for each component in the Prometheus configuration file. Prometheus collects metrics correctly when the `relabel` configuration in the Job matches the annotations and labels of the components. Alternatively, you can deploy using an Operator. This method uses a PodMonitor or ServiceMonitor to collect metrics. You can then configure a Grafana dashboard to display the metrics.
Solution implementation
Prometheus modifications
Mesh fully supports Prometheus. No modifications are needed.
Mesh modifications
Mesh control plane components expose the following monitoring metrics:
Control plane monitoring metrics
Control plane component
Metrics - Resource Monitoring
Metrics - Application Monitoring
Pilot
process_resident_memory_bytes
process_virtual_memory_bytes
go_memstats_alloc_bytes
go_memstats_heap_inuse_bytes
go_memstats_stack_inuse_bytes
process_cpu_seconds_totalgo_goroutines
pilot_xds_new: Number of Sidecar connections
pilot_total_xds_internal_errors: Total number of XDS errors
pilot_xds_write_timeout: XDS write timeouts
pilot_xds_push_timeout: XDS push timeouts
pilot_xds_push_errors_new: Number of errors pushed to Sidecars
The supported types are as follows:
{type="push_abort"}
{type="retry"}
{type="unrecoverable"}
pilot_xds_pushes_new: Total number of XDS pushes
The supported types are as follows:
{type="cds"}
{type="cds_senderr"}
{type="eds"}
{type="eds_senderr"}
{type="lds"}
{type="lds_senderr"}
{type="rds"}
{type="rds_senderr"}
Citadel
process_resident_memory_bytes
process_virtual_memory_bytes
go_memstats_alloc_bytes
go_memstats_heap_inuse_bytes
go_memstats_stack_inuse_bytes
process_cpu_seconds_totalgo_goroutines
citadel_server_authentication_failure_count: Number of authentication failures
citadel_server_csr_count: Number of CSR requests
citadel_server_success_cert_issuance_count: Number of successfully signed certificates
operator, operator-VM
process_resident_memory_bytes
process_virtual_memory_bytes
go_memstats_alloc_bytes
go_memstats_heap_inuse_bytes
go_memstats_stack_inuse_bytes
process_cpu_seconds_totalgo_goroutines
operator:
Number of Sidecar injection requests
Number of successful Sidecar injections
Number of failed Sidecar injections
Reasons for failed Sidecar injections
operator-vm:
Number of virtual machine Sidecar injection requests
Number of successful virtual machine Sidecar injections
Number of failed virtual machine Sidecar injections
Reasons for failed virtual machine Sidecar injections
Number of agent registrations
Current number of agent nodes
DSRConsole
CPU
Memory
Number of JVM threads
GC count statistics
Total number of HTTP requests
Number of successful HTTP requests
Number of failed HTTP requests
Number of RPC calls
Number of successful RPC calls
Number of failed RPC calls
Number of service administration rules sent
Number of successfully sent service administration rules
Number of failed deliveries of service administration rules
DRM
CPU
Memory
Number of JVM threads
GC count statistics
DRM push metrics
drm_push{dataId=,target_ip=,instance_id=,status=}Number of DRM client connections
Configuration delivery time
OpenAPI
CPU
Memory
Number of JVM threads
GC count statistics
Total number of HTTP requests
Number of successful HTTP requests
Number of failed HTTP requests
Number of service administration rules sent
Number of successfully sent service administration rules
Number of failed service administration rules
Connection status with k8s
Number of OpenAPI calls
OSP
CPU
Memory
Number of JVM threads
GC count statistics
Total number of HTTP requests
Number of successful HTTP requests
Number of failed HTTP requests
Number of RPC calls
Number of successful RPC calls
Number of failed RPC calls
Number of service administration rules sent
Number of successfully sent service administration rules
Number of failed deliveries of service administration rules
intelliproxy
CPU
Memory
Number of JVM threads
GC count statistics
Total requests (filterable by domain name)
http_server_requests_seconds_countSuccessful requests
http_server_requests_seconds_count - tomcat_global_error_totalFailed requests
tomcat_global_error_totalAverage request duration
http_server_requests_seconds_sum / http_server_requests_seconds_count
ACVIP
CPU
Memory
Number of JVM threads
GC count statistics
Health status of each node
acvip_nodes_health{host_ip=}Number of domain names managed by each node
acvip_nodes_domains{host_ip=}Total number of enabled IP addresses for each domain name
acvip_domain_config_ips{domain=}Total number of healthy IP addresses
acvip_domain_healthy_ips{domain=}Total number of unhealthy IP addresses
acvip_domain_unhealthy_ips{domain=}
Data plane monitoring metrics
Monitoring metric
Description
Number of MOSN applications
The number of connected MOSN applications.
Number of MOSN servers
The number of MOSN servers.
Error code categorization
A categorization of all error codes.
Error code categorization by application
A categorization of error codes by application.
Application MOSN system metrics
MOSN system metrics, such as CPU, memory, and TCP and UDP connections.
CPU utilization
The CPU utilization of MOSN.
Top MOSN instances by memory utilization
A ranking of MOSN instances by memory usage.
Top MOSN instances by response time (RT)
A ranking of MOSN instances by response time.
Top MOSN GoRoutines
A ranking of MOSN processes by the number of GoRoutines.
Top MOSN threads
A ranking of MOSN processes by the number of threads.
Steps
Modify the Prometheus configuration file.
Prometheus uses PodMonitors for monitoring. Each component requires its own PodMonitor YAML file. You also need to configure a PodMonitorselector in the Prometheus configuration file to discover PodMonitors. The following is an example:
# DsrConsole: The Prometheus port is 8080

apiVersion: monitoring.coreos.com/v1
kind: PodMonitor
metadata:
  name: dsrconsole
  labels:
    team: frontend
  namespace: monitoring
spec:
  namespaceSelector:
    any: true
  podMetricsEndpoints:
    - port: metrics # Modify this based on your actual environment
      path: /actuator/prometheus
  selector:
    matchLabels:
      app: dsrconsole
Configure the Grafana data source.
Log in to the Grafana console.
In the navigation pane on the left, choose
 > Data Sources, and then click Add data source.
Select Prometheus as the data source and configure the settings based on your environment.
The following figure shows a configuration example:
Click Save & Test.
Demonstration
Data Plane Monitoring Dashboard
Service Administration Monitoring Dashboard
Pilot Monitoring Dashboard
Citadel Monitoring Dashboard
OpenAPI Monitoring Dashboard
Sidecar-operator Monitoring Dashboard
Intelliproxy Monitoring Dashboard