Generate commands using Command Helper
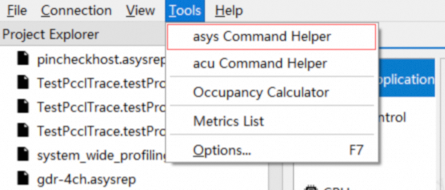
In the Asight System GUI menu bar, click Tools > asys Command Helper to open the asys Command Helper:
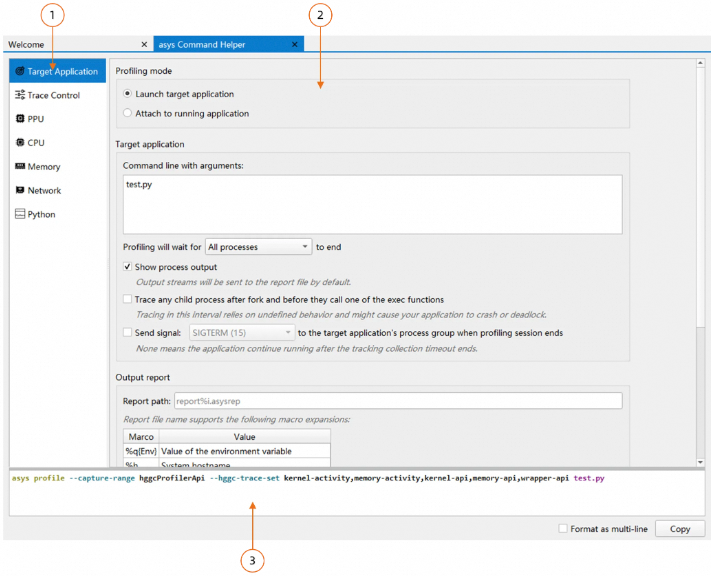
Command Helper menu bar: Categorizes parameters by type.
Parameter configuration area: Configure trace options.
Command generation area: Displays the generated command.
1. Command Helper menu bar
The menu categories help you quickly find the collection options you need.
Menu bar | Description |
Target application | Configure settings for the target application, such as its path, arguments, output report path, and environment variables. |
Trace control | Configure collection controls, such as event-triggered tracing, collection duration, and file rotation. |
PPU | Configure PPU activity trace options, such as HGGC, PPU metrics, ACDNN, and ACBLAS. |
CPU | Configure CPU tracing to monitor application execution and collect CPU metrics. |
Memory | Configure usage tracing for PPU memory, host memory, heap memory, and pinned memory. |
Network | Configure runtime metrics collection for the RDMA network adapter. |
Python | Configure Python tracing, such as collecting the Python call stack and tracing Python functions. |
2. Parameter configuration area
Some options include an illustrative diagram. Supplementary descriptions appear in gray italics.
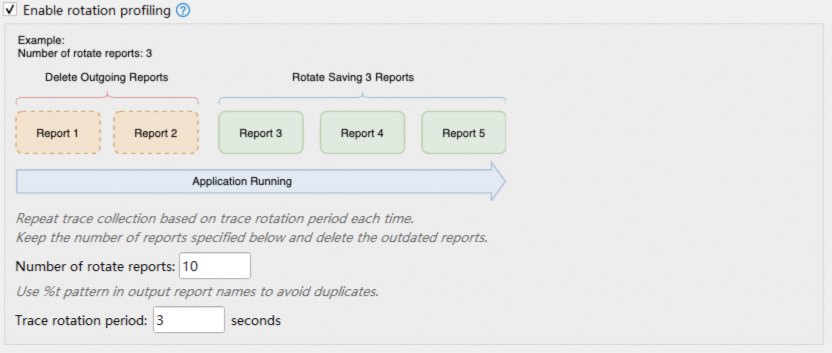
2.1 Input restrictions
Some input fields have restrictions on the content and format. For example, the PPU device ID field only accepts numbers and commas:
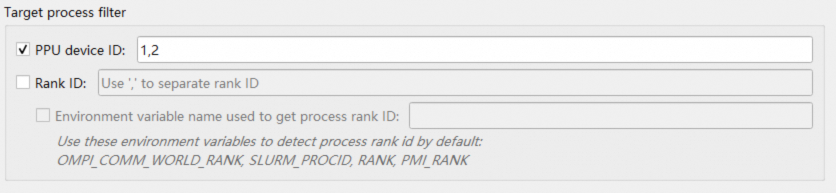
2.2 Error messages
If you enable an option but leave a required parameter field empty, a red error message appears:
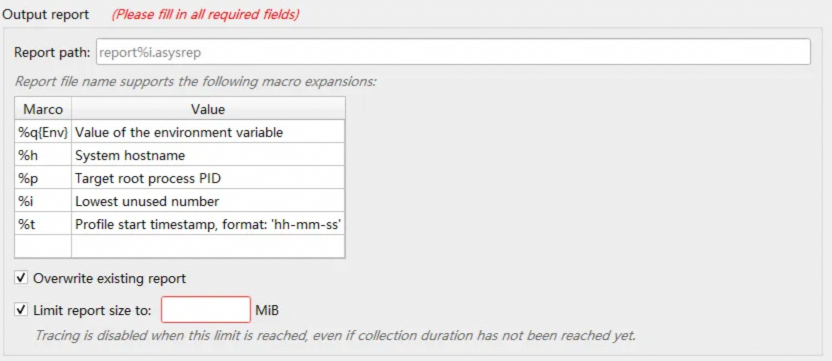
Some options are mutually exclusive. If you enable a conflicting option, an error message appears on its parent, and the option itself is grayed out:
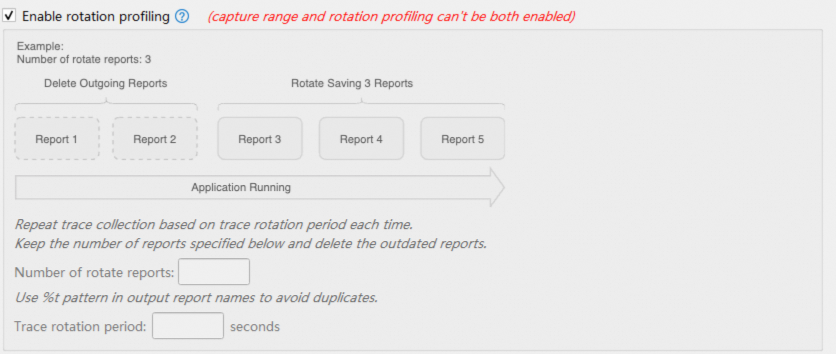
2.3 Navigating to the help document
Click an option's help icon to open the relevant section in the help document.
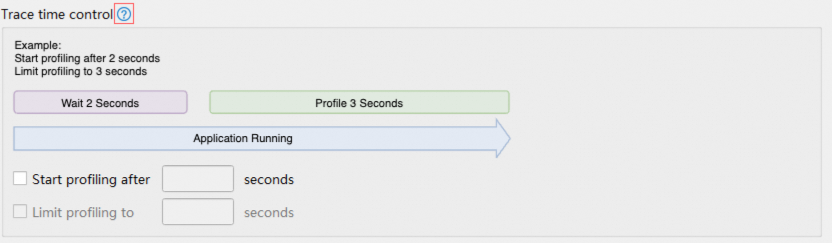
2.4 Metrics selection dialog box
For options that require metrics, click the selection button to open the metrics selection dialog box:
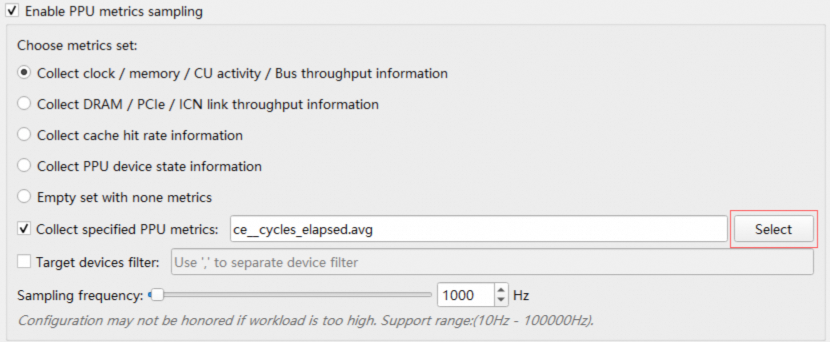
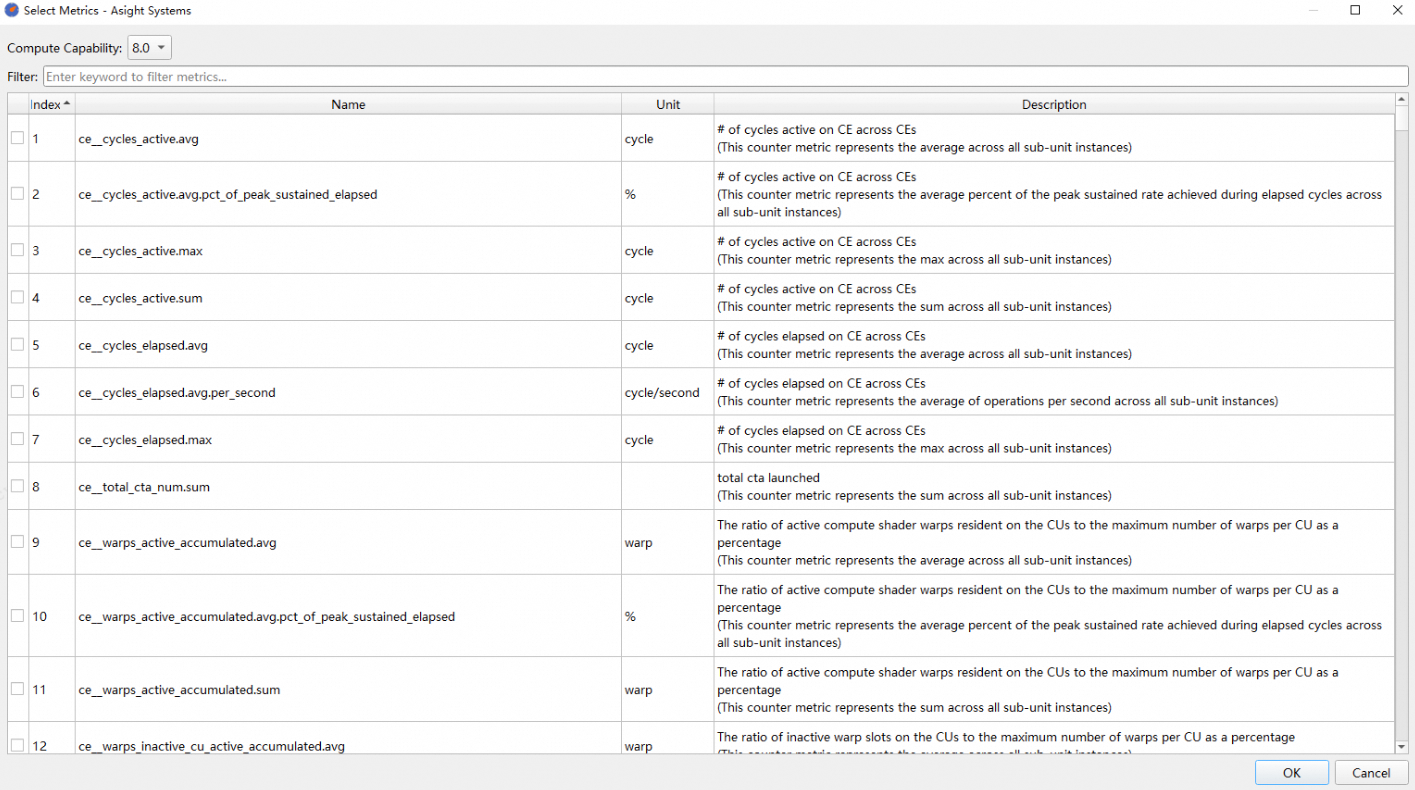
In this dialog box, you can select a different compute capability to load the corresponding list of metrics. You can collect only a limited number of metrics in a single run. If you exceed this limit, an error message appears, and the OK button is disabled.
3. Command generation area
As you change parameters, the corresponding asys command is generated and displayed in real time in the command generation area:

Select the Format as multi-line checkbox to display the command across multiple lines:
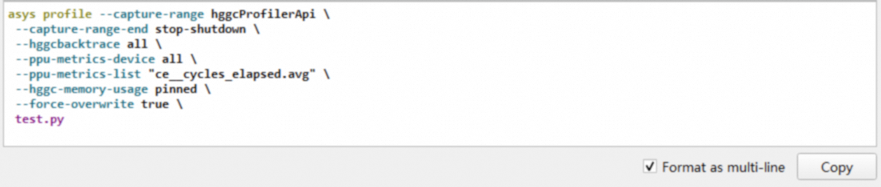
Click the Copy button to copy the command to the clipboard. You can then paste it into a terminal to start profiling the target application.