View reports in the Asight Systems GUI
The Asight Systems GUI displays collected reports. The following figure shows the GUI with a report open:
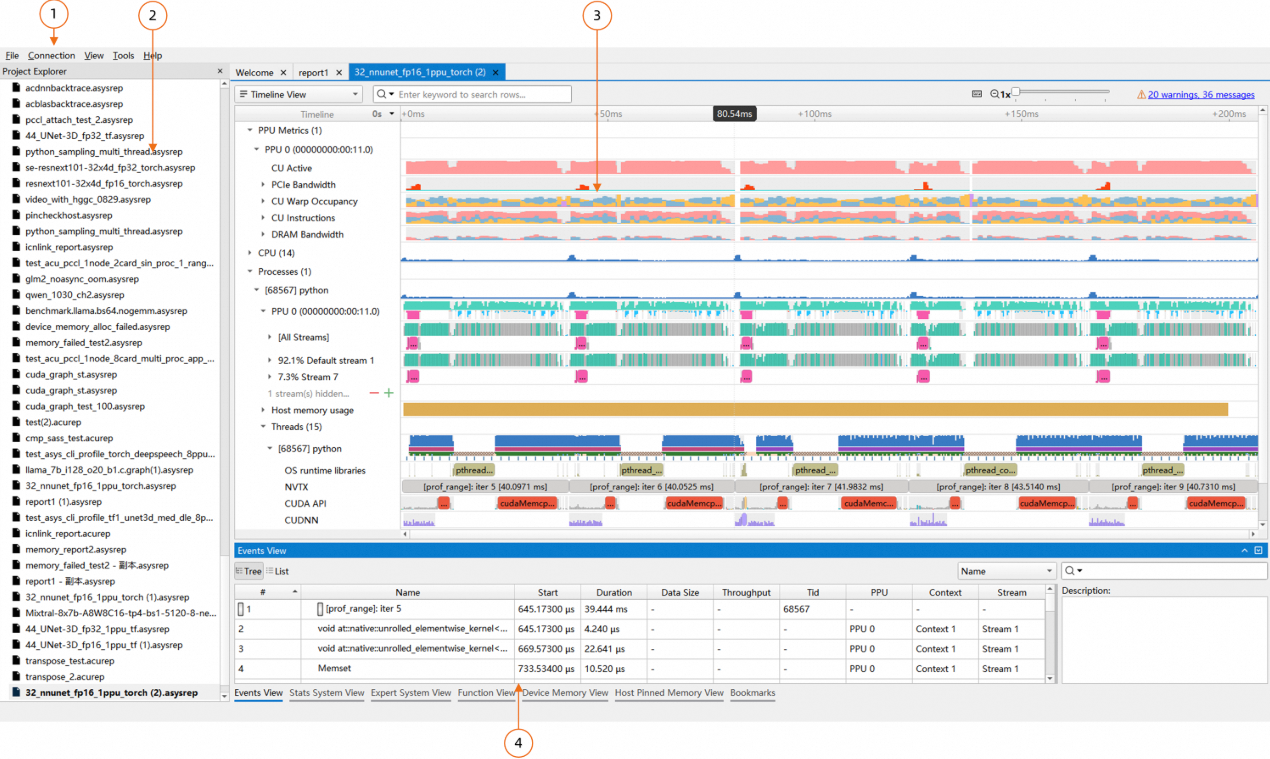
The GUI consists of the following main components:
Menu Bar: For details, see Menu Bar.
Project Explorer: For details, see Project Explorer.
Timeline View: For details, see Timeline View.
Events View: For details, see Events View.
1. Menu bar
The menu bar in the Asight Systems GUI provides the following:
File
Open: Opens a report.
Open Advanced: Opens a report with advanced options. For details, see Advanced open for reports.
Exit: Exits the Asight Systems GUI.
View
Show Project Explorer: Shows or hides the Project Explorer.
Show Output Messages: Shows or hides the Output Window.
Tools
Options: Opens the Options dialog. For details, see Options.
Help
Documentation: Opens the Asight Systems user manual.
About: Displays information about Asight Systems.
1.1 Advanced open for reports
The advanced open feature for reports lets you:
Open multiple reports in the same Timeline View.
Open a specific portion of a report based on a percentage range.
Specify which event types to load. Only selected types are loaded when the report is opened.
To access the advanced open feature, select File > Open Advanced. The following figure shows the UI:

A list of reports to open. These reports appear in the same Timeline View.
Control buttons for report paths. From left to right, they are:
Add a new path.
Delete the currently selected path.
Move the currently selected path up one row.
Move the currently selected path down one row.
A button to open a file browser and replace the current path.
An option to align multiple reports by their start time.
A list of event types to load. Only checked types are loaded.
Controls to select the percentage of the report to open. In the preceding figure, this is set to open the 30% to 60% portion of the report.
The following table maps load event types to trace data types.
Load event type | Trace data type |
Metrics sampling | PPU metrics trace CPU metrics trace |
CPU schedule | CPU thread scheduling |
Memory usage | PPU memory usage trace Pinned memory usage trace Host memory usage sampling Heap memory usage trace |
OS runtime | OS Runtime (OSRT) trace and call stack |
HGTX | HGTX trace |
HGGC | HGGC API trace and call stack HGGC PPU activity trace |
acDNN | acDNN API trace and call stack |
acBlas | acBlas API trace and call stack |
Video | Video API trace Video PPU activity trace |
PCCL | PCCL activity trace |
Log | Application stdout and stderr logs |
NIC metrics | RDMA NIC metrics trace |
Backtrace | HGGC, acDNN, acBlas, and OSRT API call stacks CPU backtrace sampling trace Python backtrace sampling trace PPU, Pinned, and Heap memory usage call stacks |
When you open multiple reports in the same Timeline View, the timeline of each report appears chronologically based on its event times. To align the timelines of different reports, see Align timelines for multiple reports.
2. Project Explorer
The Project Explorer in the Asight Systems GUI lets you manage open reports, as the following figure shows:
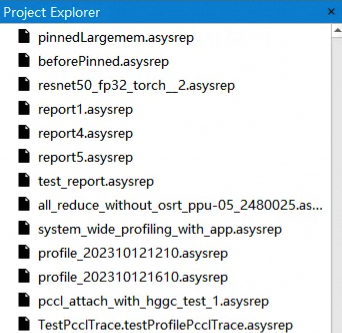
In the preceding figure, the report name in bold indicates that the report is open. The Project Explorer saves a history of opened reports. You can remove a report from this history by using the context menu. To quickly navigate to the directory of a report file, right-click the report in the Project Explorer and select Show in Finder/Explorer from the context menu.
Tip: The Project Explorer only saves references to reports. If you delete or move the report files, these references become invalid.
3. Timeline view
The Timeline View displays timelines for all events, including HGGC, HGTX, OSRT, and CPU Sampling. Use this view to examine PPU and CPU workloads and pinpoint bottlenecks.
The Timeline View is divided into two parts: the timeline area at the top and the Events View at the bottom, as shown in the following figure:

Page-switching drop-down list: Switches from the Timeline View to the Analysis Summary View.
Timeline tree
Report-level Options button: Click to open the Options dialog box.
Search box
Timeline area
Operation guide button: Click to open the operation guide.
Vertical zoom slider: Zooms the timeline vertically.
Button to switch to the Diagnostics Summary View.
Events View
Collected events are organized in a tree structure in the timeline tree on the left. If a collection feature is not enabled, the timeline does not display its corresponding row.
3.1 Operation guide
The Asight Systems GUI supports various operations for navigating the timeline. The operation guide lists the supported actions and their shortcut keys:
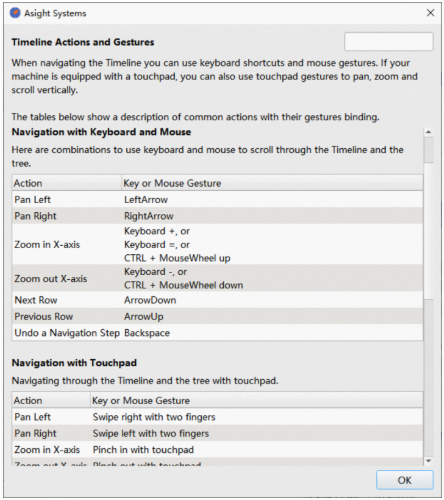
Keyboard and mouse
Action | Operation |
Pan left | Left arrow key or A |
Pan right | Right arrow key or D |
Zoom in horizontally | + or = or W, or CTRL/Command + mouse wheel up |
Zoom out horizontally | - or S, or CTRL/Command + mouse wheel down |
Next row | Down arrow key |
Previous row | Up arrow key |
Undo an action | Backspace |
Trackpad
Action | Operation |
Pan left | Two-finger swipe left |
Pan right | Two-finger swipe right |
Zoom in horizontally | Pinch out |
Zoom out horizontally | Pinch in |
Scroll up | Two-finger swipe down |
Scroll down | Two-finger swipe up |
Select an item
Action | Operation |
Select an item in the timeline | Left-click |
Select an item in the Events View | Double-click |
Select an item and zoom to fit the screen | CTRL/Command + left-click |
Select a time range
Action | Operation |
Select a time range | Left-click and drag |
Drag the selected time range | Left-click and drag |
Deselect the time range | ESC or click outside the selected range |
Zoom to the time range | Z |
Zoom to the time range and deselect | Shift + Z or double-click the time range |
Filter by the current time range | F |
Filter by the current time range and deselect | Shift + F |
Vertical zoom
In addition to horizontal zoom, the Timeline View provides a vertical zoom feature. You can use the vertical zoom slider in the upper-right corner:

Click the magnifying glass icon  on the left to reset the zoom.
Pin row
The Timeline View supports pinning rows. Use the context menu or the CTRL/Command + P shortcut key to pin rows of interest to the top or bottom of the screen for easy comparison:
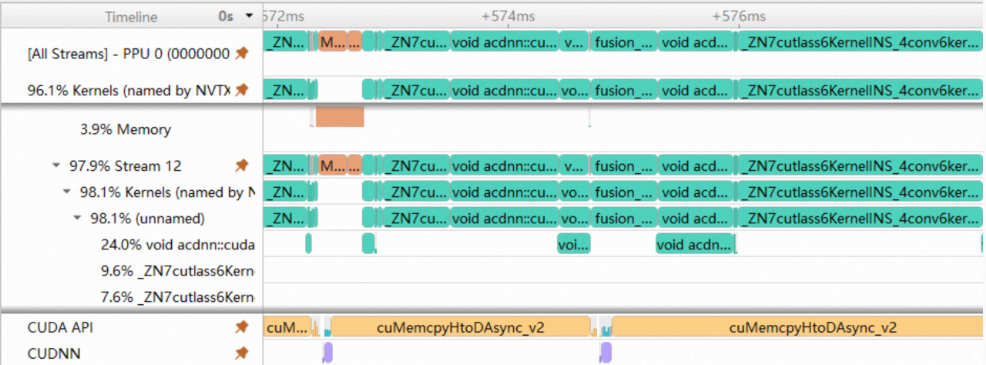
Hide trailing nodes
For a cleaner display, certain nodes in the timeline tree support hiding their trailing child nodes:
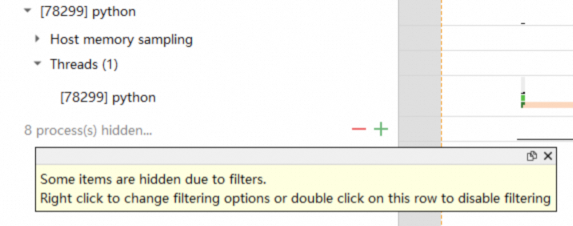
The following operations are supported for hiding nodes:
Action | Operation |
Show one more node | Left-click "+" |
Show one fewer node | Left-click "-" |
Show five more nodes | CTRL/Command + left-click "+" |
Show five fewer nodes | CTRL/Command + left-click "-" |
Show all hidden nodes | Double-click |
You can also use the context menu:
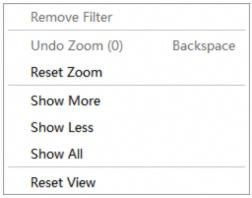
Action | Description |
Show More | Show one more node. |
Show Less | Show one fewer node. |
Show All | Show all nodes. |
Reset View | Restore the default display state. |
You can hide the following node types:
CPU Core
Thread
Process
PPU Stream
PPU HGTX
PPU Kernel
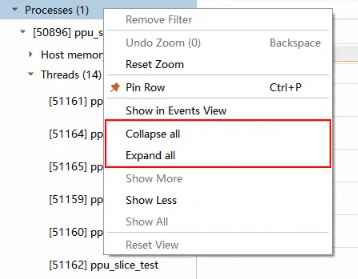
Expand/collapse all child nodes
From the context menu of a node with children, you can expand or collapse all of its child nodes, as shown in the following figure:
Tooltip
All items in the Timeline View have a tooltip. Hover over an item to view its details:

Click the pin icon in the upper-right corner of the tooltip to keep it visible. Click the Copy button to copy the tooltip content.
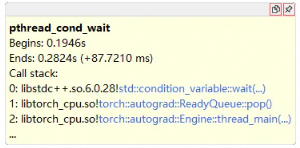
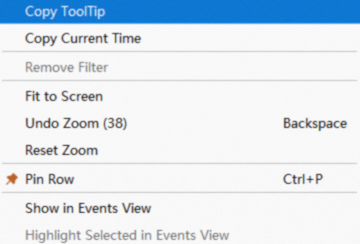
You can also copy the tooltip content from the context menu by selecting Copy Tooltip:
Switch time axis display modes
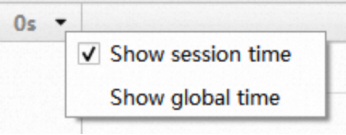
The time axis in the Timeline View supports two display modes:
Session Time: Displays time relative to the report's start time, which is treated as the origin (0), as shown in the following figure:

Global Time: Displays the actual wall-clock time.


Switch between these two modes by clicking the triangle button on the left:
Dock widget
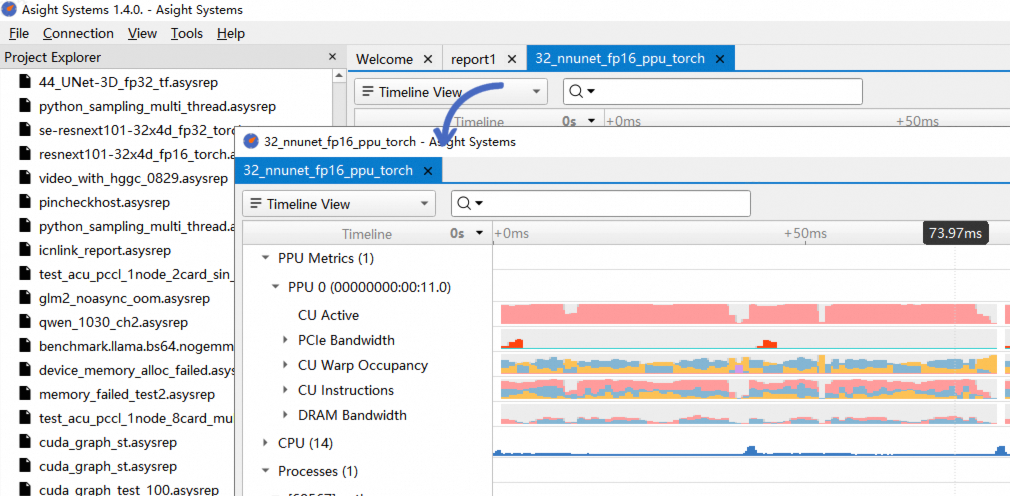
The dock widget feature lets you drag a report out of the main window to view it in a separate window or on a different screen.
You can dock a view by dragging its tab:
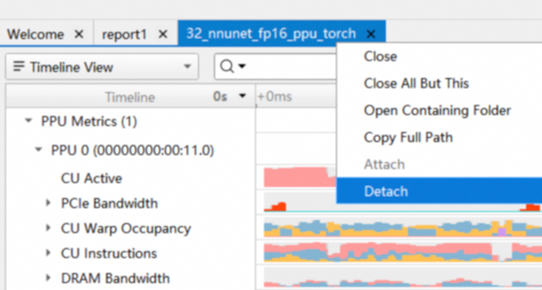
You can also use the Detach/Attach options in the context menu:
Bookmark timeline
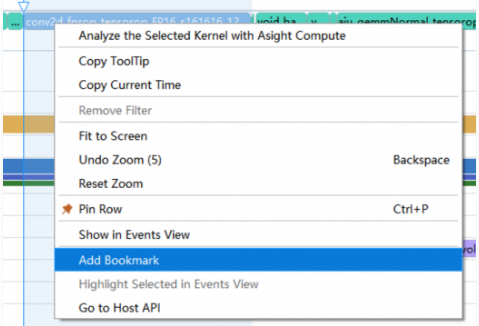
The Timeline View lets you bookmark timelines to mark points of interest in large reports. You can add or remove a bookmark from a timeline's context menu:
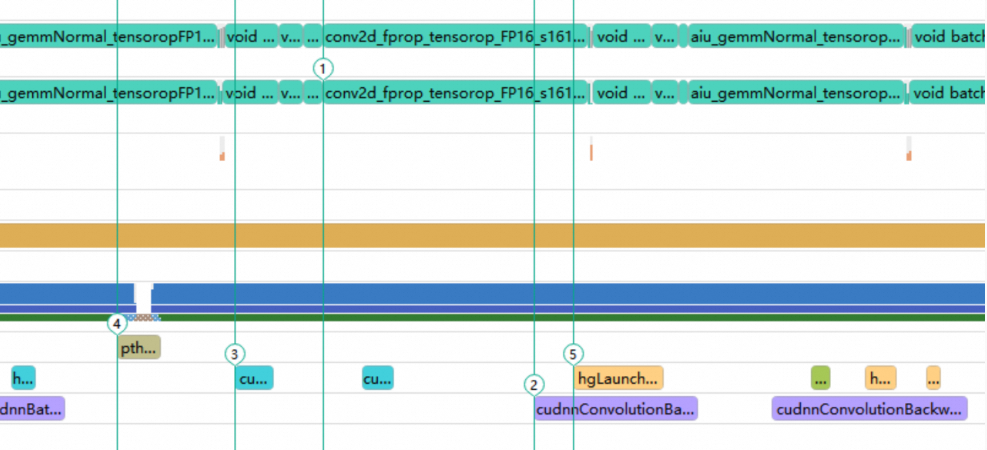
Bookmarking a timeline displays a persistent marker with its index number:
You can manage all your bookmarks in the Bookmarks window below:

In this window, you can perform the following actions:
Change the index number of a bookmark.
Add comments to a bookmark.
Clear all bookmarks at once.
Double-click an entry in the Name column or use the context menu to jump to the corresponding timeline location.
Import or export bookmark code using the clipboard.
When you close a report, bookmarks are saved to an
.asysrepbmfile with the same name as the report in the same directory. When you reopen the report, the bookmarks are automatically imported from this file.You can change this behavior by navigating to
Tools->Options->Systems Profile->Bookmark Management Modein the menu bar.
3.2 Timeline item display

Above the Timeline View is a time axis where time progresses from left to right. For better readability, when the Timeline View is zoomed in to a certain level, it displays time in a base+offset format.
In the Timeline View, an event's timeline is a timeline item. Different types of timeline items have different colors. The left edge of an item indicates the event's start time, the right edge indicates its end time, and the width of the item represents its duration.
When the Timeline View is not fully zoomed in, Asight displays events using an occupancy bar chart:
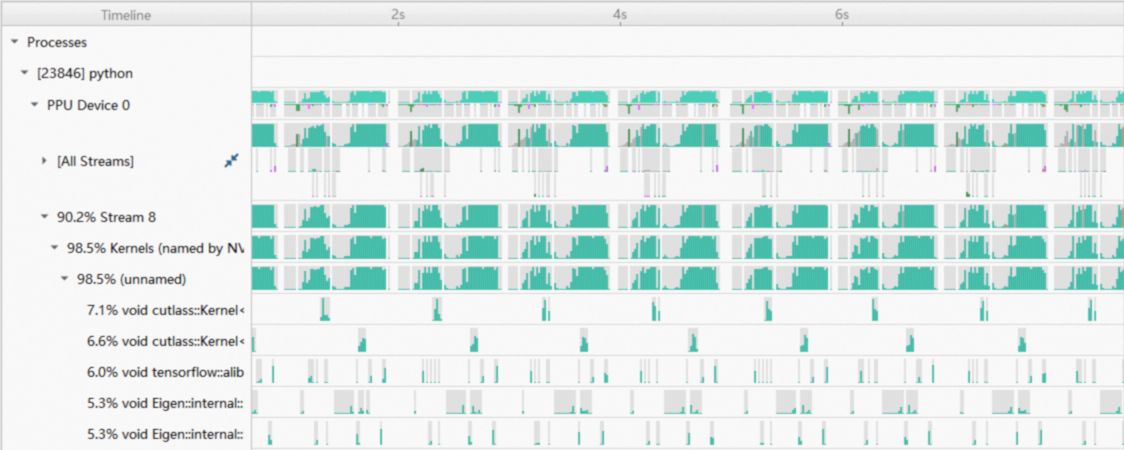
In the preceding figure, the kernel timeline is shown as bar charts of varying heights. This display strategy is used for various data types, including CPU utilization, thread and process occupancy, kernel, and Memcpy events.
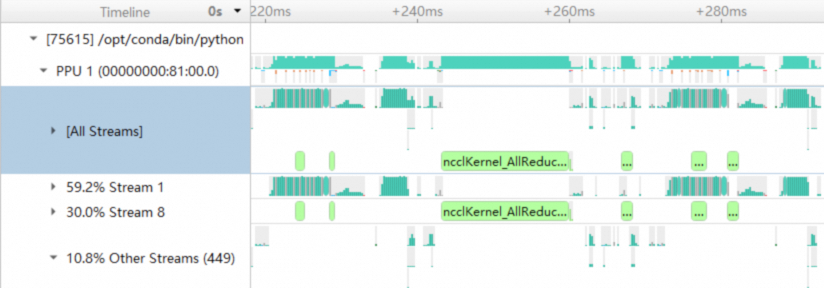
Hierarchical display of communication operators
In the Timeline View, communication operators are displayed in layers and with special colors, for example in the [All Streams] row:
Kernel colors
To distinguish each kernel's timeline, the Timeline View can display them in different colors, as shown in the following figure:

You can enable this feature in the Options dialog box under Systems Profile->Color HGGC Kernels.
3.3 Timeline correlation
Selecting an item highlights all related items:

Events correlate in two situations:
They belong to the same call stack, for example, an HGGC event nested within an HGTX event.
A device activity is triggered by a host API call, for example, a launch kernel API and the resulting kernel.
3.3.1 Correlation operations and markers
When you select an item, corresponding markers and buttons appear in the Timeline View:

3.4 Time range selection
The Timeline View supports selecting a time range. To do so, left-click and drag, as shown in the following figure:
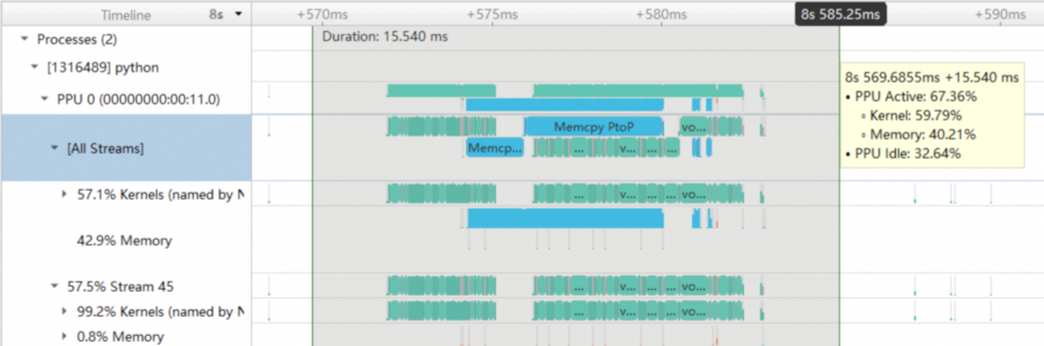
When you select a time range, a tooltip appears, showing the start time and duration of the range. It also displays the percentage of PPU active/idle time, as well as the time breakdown for kernel execution and memory operations within that range.
While selecting or resizing a time range, you can hold down the Shift key to enable a snapping feature, which automatically snaps the selection to the start or end of the nearest timeline.
After selecting a time range, you can drag it to change its position and size. Double-clicking the time range zooms it to fit the entire screen. You can also filter events by selecting Filter and Zoom in from the context menu, which displays the results in the Events View.
3.5 Multi-report timeline alignment
When you open multiple reports in the Timeline View, the timelines from different reports are displayed chronologically. To adjust the time offset between reports, Asight Systems provides a timeline alignment feature, which can be accessed as shown in the following figure:

After you click the button, the timeline alignment dialog box appears:

Time offset of each report's timeline from its collection start time, in nanoseconds. The default is 0. You can manually enter a time offset for calibration.
Select whether to align reports by their start times.
Enter timeline selection mode to select a baseline timeline in each report for alignment.
Select the timeline alignment mode.
The Timeline View supports two alignment modes:
3.5.1 Manual alignment
If you know the time offset between reports, you can manually enter it in nanoseconds. A positive value shifts the report's timeline to the right, while a negative value shifts it to the left. You cannot specify an offset for the first report in the list.
3.5.2 Semi-automatic alignment
If you know which events in the reports occurred simultaneously, you can use these timelines as a baseline for semi-automatic alignment. The Timeline View automatically calculates the time offset between the different reports based on these timelines.
First, click the Pick button to enter timeline selection mode:

After entering timeline selection mode, the timeline alignment dialog box disappears, and a tooltip appears at the bottom of the window. In the Timeline View, left-click to select a baseline timeline. The selected timeline appears highlighted. You can only select one timeline per report. If you select a different timeline from the same report, the system deselects the previous one.
After selecting the timelines, you can choose Left Align or Right Align in the timeline alignment dialog box:
Left Align: The selected timelines are aligned by their start times (left edge).
Right Align: The selected timelines are aligned by their end times (right edge).
Use the following shortcut keys to exit timeline selection mode:
Enter: Confirms the selected timelines and reopens the timeline alignment dialog box.
ESC: Discards the timeline selection and reopens the timeline alignment dialog box.
If you confirm the selected timelines, the timeline alignment dialog box reappears as follows:
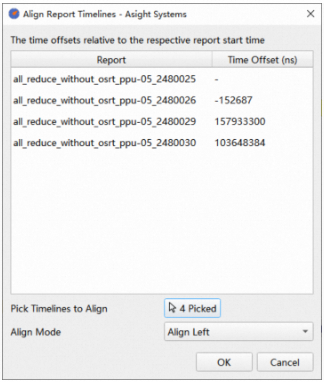
The time offset for each report is automatically calculated and entered. The Pick button indicates that you have selected four timelines. In the drop-down list below, you can choose Left Align or Right Align, and the time offsets above will be automatically recalculated based on your choice.
Tip: When selecting baseline timelines, the time offsets are calculated relative to the baseline timeline selected in the first report. If no baseline timeline is selected for the first report, the offset is calculated from the start time of the first report in Left Align mode, and the end time in Right Align mode. Therefore, we recommend always selecting a baseline timeline for the first report.
You do not need to select timelines for the other reports. Reports without a selected baseline timeline are not aligned.
3.6 Search and filter rows
The search and filter feature helps you quickly find timeline rows of interest, as shown in the following figure:

You can switch between search and filter modes.
Search mode: Highlights matching items and allows you to jump to the previous or next match.
Filter mode: Displays only matching items.
The search results in search mode are shown in the following figure:

3.7 Group view
To simplify the analysis of specific timelines, the Timeline View provides a grouping feature that lets you add timelines of interest to a Group View for isolated analysis.
You can right-click a timeline row of interest and add it to a Group View:
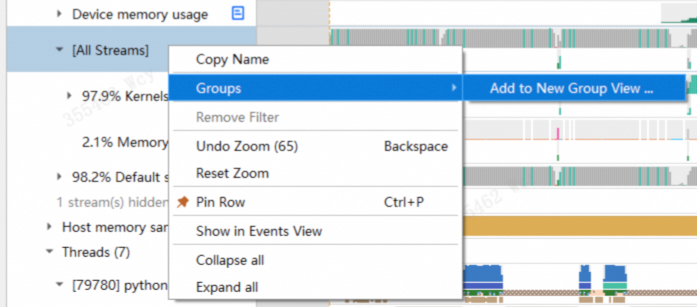
Once added, a button to switch to the Group View appears at the top of the Timeline View. A group icon also appears to the right of the timeline row, with its color matching the Group View button above. Clicking this button switches to that Group View, with the following effect:
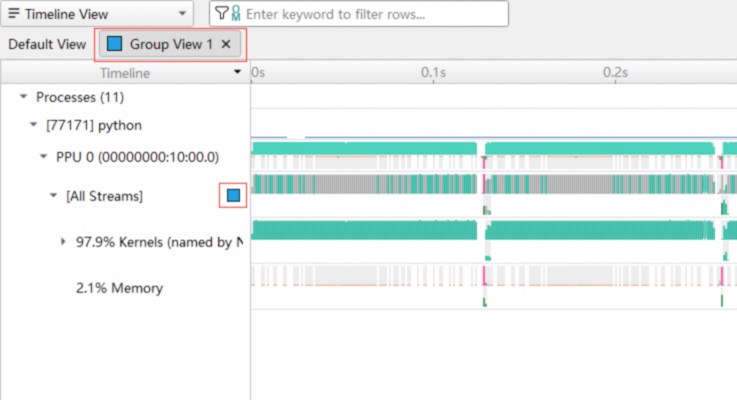
As you can see in the figure above, only the "[All Streams]" row of interest is displayed, while other timeline rows are hidden. The view also displays:
All ancestors of the target row
The child nodes of the target row
You can right-click the group button to rename the group:
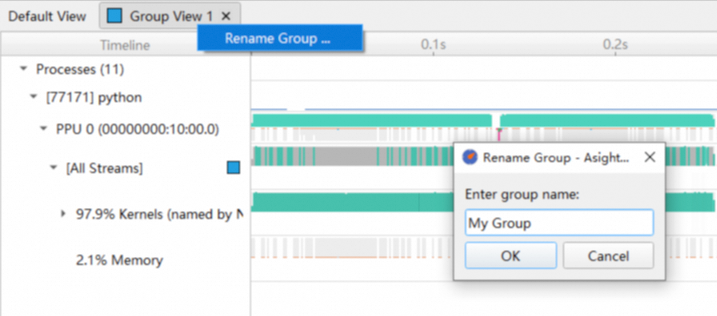
The same timeline row can be added to multiple Group Views:
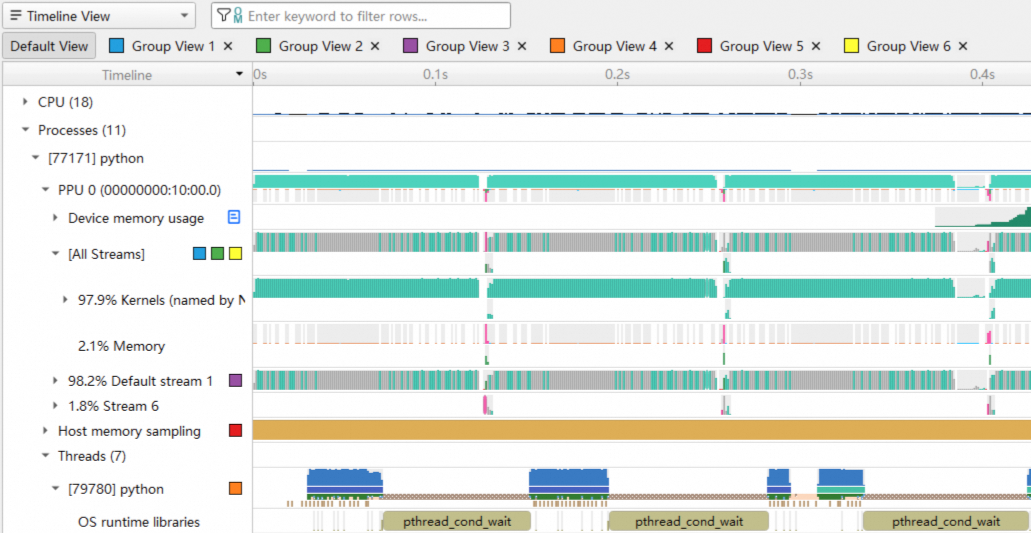
3.8 Report-level options
In addition to the global options under Tools->Options, the Timeline View also supports report-level options. These options have the following characteristics:
They apply only to the current report.
These settings are not saved; they reset when you restart Asight.
If an option is also set in the global options, it overrides the global setting.
They take effect immediately without needing to reopen the report.
You can open the Options dialog box by clicking the Options button to the left of the search box in the Timeline View:

The dialog box appears as follows:

The supported options are:
Show correlation arrows: Controls whether to display arrows for selected timelines. Default is Yes.
Show CPU sampling rows: Controls whether to display rows related to CPU sampling. Default is Yes.
Show PPU metrics rows: Controls whether to display rows related to PPU metrics. Default is Yes.
Show NIC metrics rows: Controls whether to display rows related to NIC metrics. Default is Yes.
Show non-HGGC process and thread rows: Controls whether to display thread and process rows that do not have HGGC information. Default is Yes.
Show graph node based HGTX timelines: Controls whether to display HGTX timelines based on graph node mapping. Default is Yes.
Unified memory usage scale: Controls whether to display timelines for memory usage types on a unified scale. The default value is the same as the global option.
Color HGGC kernels: Controls whether to display different kernels in different colors. The default value is the same as the global option.
Color CPU Usage by Thread: Controls whether to color CPU timelines by thread name. The default value is the same as the global option.
HGGC API name mode: Controls whether to display the host-side HGGC launch API as the name of the corresponding kernel. The default value is the same as the global option.
When a report-level option is active, a dot appears on the Options button:

3.9 Events view
The Events View displays events in a list format, supporting sorting, searching, and filtering. It also supports navigation between the Timeline View and the Events View.
From the Timeline View, you can display a specific node's events in the Events View by right-clicking it and selecting Show in Events View (shortcut: Shift + double-click):
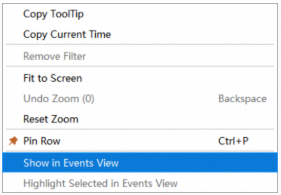
The Events View also displays the child events of the selected node:
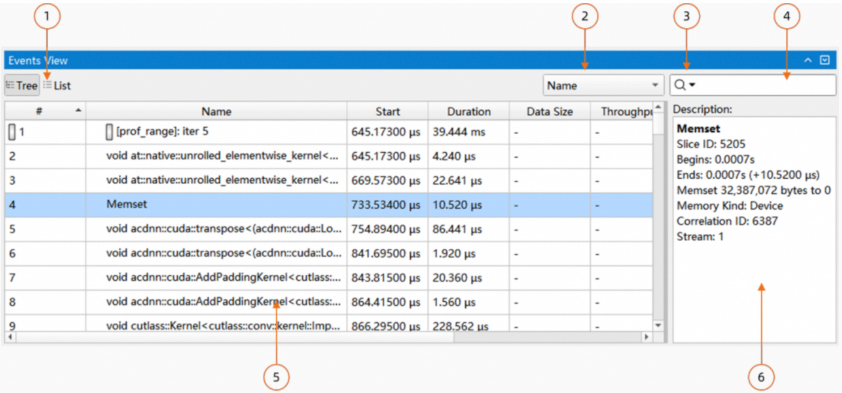
Display mode selector. For nested HGTX events, you can choose a tree or a flat list display.
Search scope selector (by Name or Description).
Advanced search options.
Search bar.
Events table.
Description pane for the selected item (content is identical to the item's tooltip).
The table includes the following columns:
#
Name
Start
Duration
TID
If the Events View displays PPU-related nodes, it will also show PPU, Context, and Stream columns:
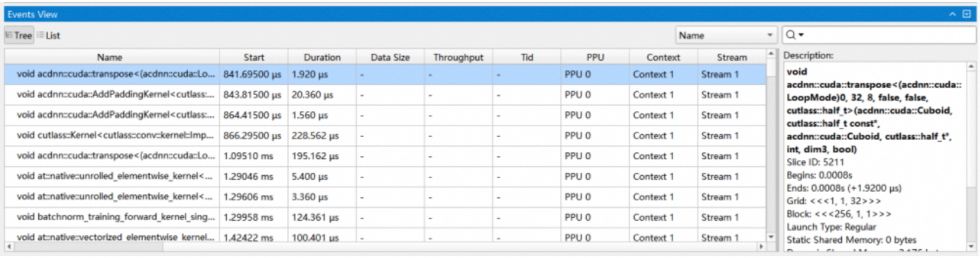
After selecting events in the table, you can export the selected items using the Copy function in the context menu. Multi-selection with Shift/Ctrl is supported. You can also select all items using the Select All function in the context menu. To export all events directly to a CSV file, use the Export All to CSV function in the context menu. Clicking a column header sorts the data in ascending or descending order.
3.9.1 Search
The Events View supports a search function:

Two search criteria are supported:
By Name
By Description
Two modes are supported:
Search
Filter
The search results are displayed as shown below:
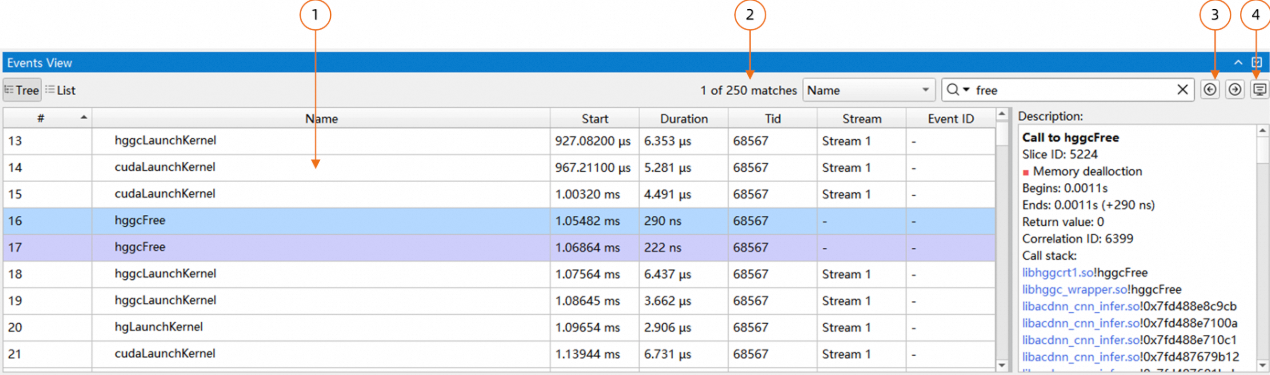
Matching items are highlighted.
The number of matching items is displayed.
Navigation buttons allow you to jump to the previous or next match.
Search results are also highlighted in the Timeline View.
When you use Show in Events View again, the search bar and results are reset.
The Events View also supports advanced search. Click the triangle button next to the magnifying glass to show advanced search options:
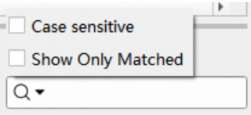
Case Sensitive: Makes the keyword search case-sensitive.
Show Only Matched: If checked, the Events View displays only matching items and hides non-matching ones.
3.9.2 Go to row
In the Events View, you can use the shortcut key Ctrl + G to jump to a specific row by entering its row number, as shown in the following figure:

3.9.3 Go to timeline
The Events View supports navigation to and from the Timeline View:
When an item is visible in the Events View, double-clicking that item in the Timeline View will select and go to it in the Events View.
Double-clicking an item in the Events View will highlight the corresponding item in the Timeline View.
You can also navigate using the context menu:
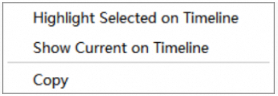
Highlight Selected on Timeline: Highlights the item in the Timeline View, which is the same as double-clicking the item.
Show Current on Timeline: Highlights the item in the Timeline View and zooms to fit it to the screen.
3.9.4 Filter by time range
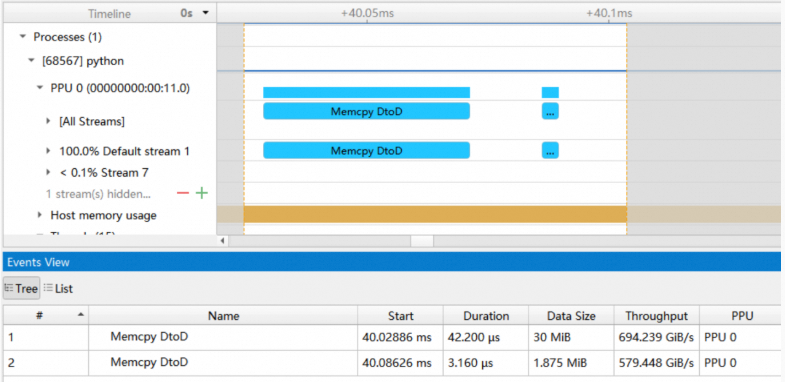
You can use a time range selection to make the Events View display only events within that period. First, select a time range in the Timeline View, then filter the events by selecting Filter and Zoom in from the context menu. The Events View will then show only the events within that time range:
3.10 Function view
Use the Function View to analyze the CPU usage of all functions. The Function View presents CPU usage data in three table formats (Top-Down, Bottom-Up, and Flat) and two graphical formats (flame graph and icicle graph). It supports sorting, searching, and filtering to help you quickly find hotspot functions. To use the Function View, you must enable backtrace sampling when collecting the report. See Collect API call stacks.
3.10.1 Flame and icicle graphs
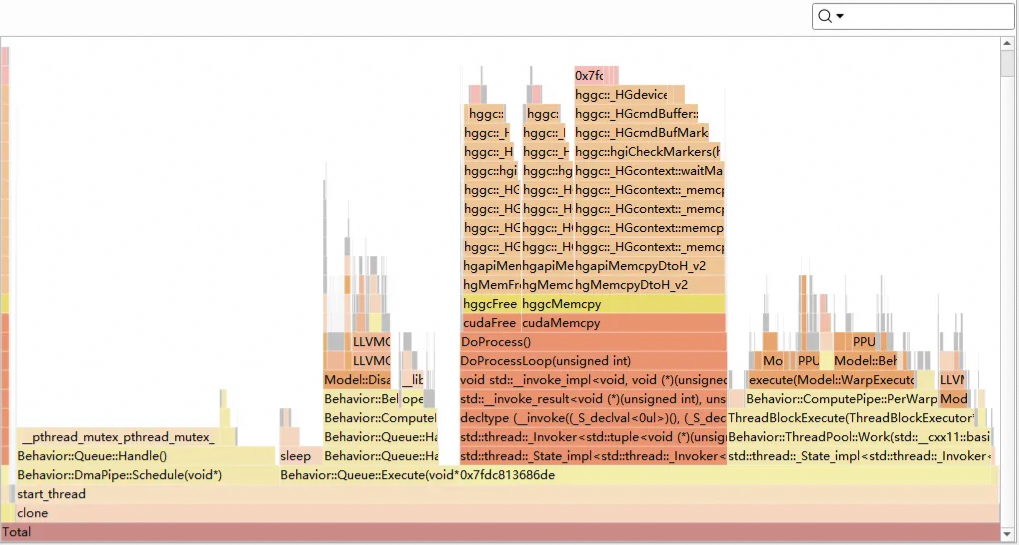
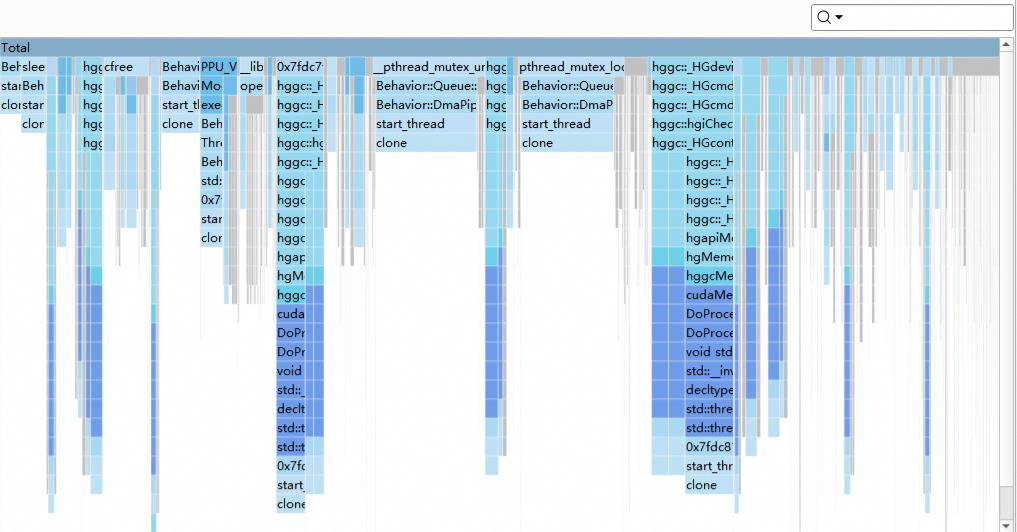
A flame graph helps you quickly find the call stack that consumes the most CPU time, while an icicle graph helps you quickly locate the function with the highest CPU consumption and its callers. With these graphs, you can get an overall view of the duration of all functions and quickly pinpoint hotspot functions and their corresponding call stacks.
The flame graph is shown in the following figure:
The icicle graph is shown in the following figure:
The main features of the flame and icicle graphs are:
Each rectangle in the graph represents a function. The width of the rectangle indicates the CPU time consumed by the function, and the color distinguishes different modules. The x-axis does not represent the chronological order of functions, while the y-axis represents the depth of the call stack, with callers at the bottom and callees at the top.
When you hover over a function, a tooltip or the top of the graph displays detailed CPU consumption, the function's module name, and more.
Clicking a function zooms in on it, letting you view its detailed callers and callees.
From a function's context menu, you can copy its function name or module name.
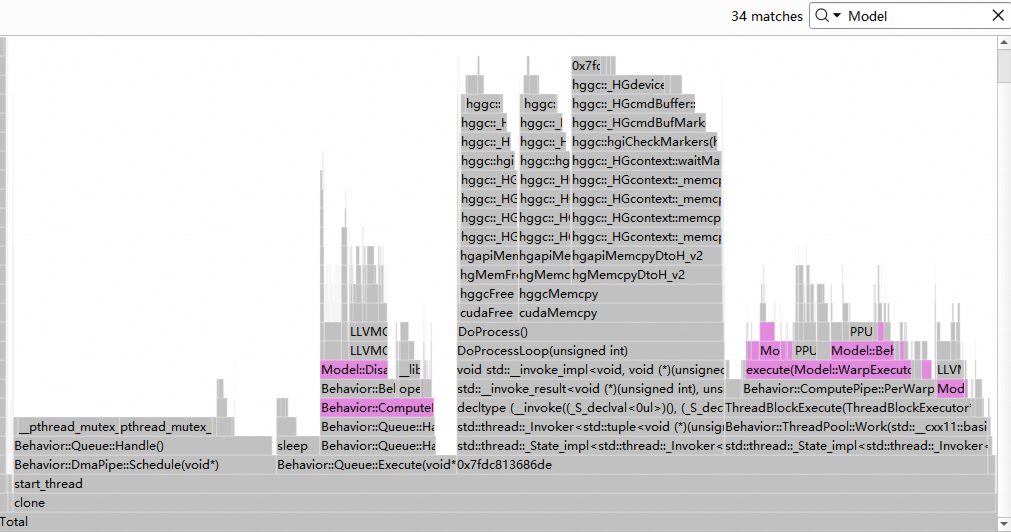
You can search for functions, and the search results will be highlighted in magenta in the graph.
3.10.2 Function tables
The Function tables include Top-Down, Bottom-Up, and Flat views. The main features are arranged as shown in the following figure:
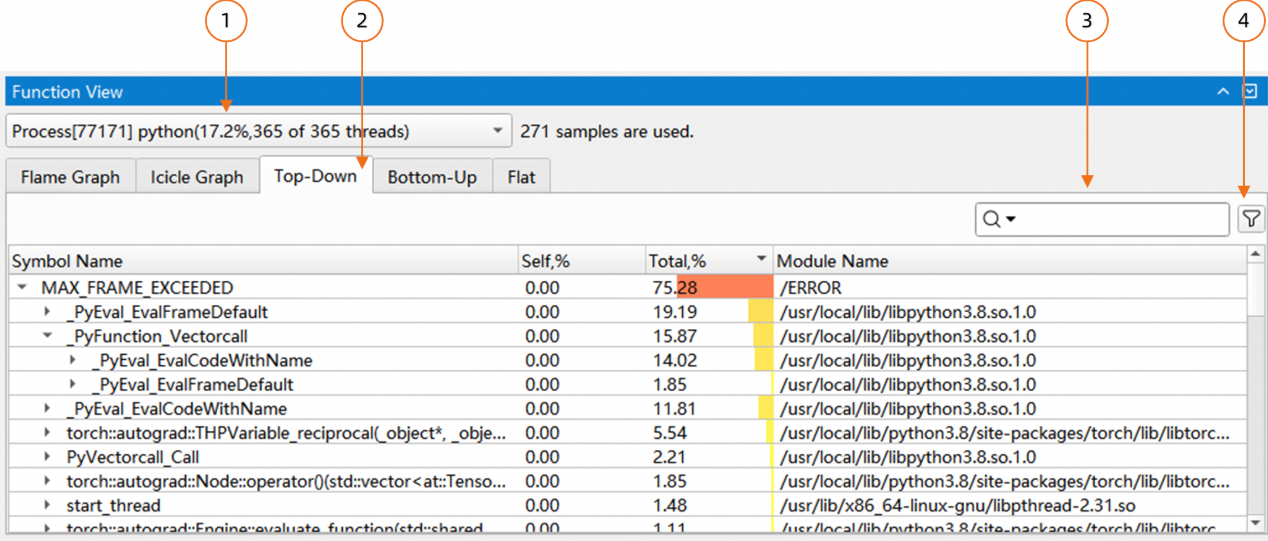
Select the target process to analyze.
Tab bar for switching to other sub-pages.
Search box
Filter Dialog
The Function tables display the following information:
Symbol Name: The function name.
Self: The percentage of time spent in the function itself.
Total: The percentage of time spent in the function and the functions it calls.
Module Name: The name of the module to which the function belongs.
The Function tables support sorting. Clicking a column header sorts the data in ascending or descending order.
The Function tables support searching, which queries both the Symbol Name and Module Name simultaneously. The Case Sensitive option is also supported. The search results are similar to those in the Events View and include the following:
Matching items are highlighted.
The number of matching items is displayed.
Navigation buttons allow you to jump to the previous or next match.
The Function tables support filtering, including:
Hiding functions with a time percentage below a specified threshold (not hidden by default).
Specifying the number of decimal places for the time percentage display.
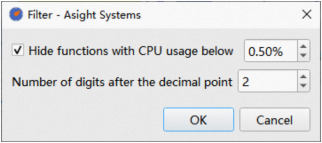
The Function tables support the following context menu functions:
Expand: Expands the selected row and all its child rows.
Collapse: Collapses the selected row and all its child rows.
Expand All: Expands all rows and their child rows in the table.
Collapse All: Collapses all rows and their child rows in the table.
Copy: Copies the content of the selected function to the clipboard.
Export All to CSV: Exports all functions in the table (including hidden rows) to a CSV file.
Top-Down table
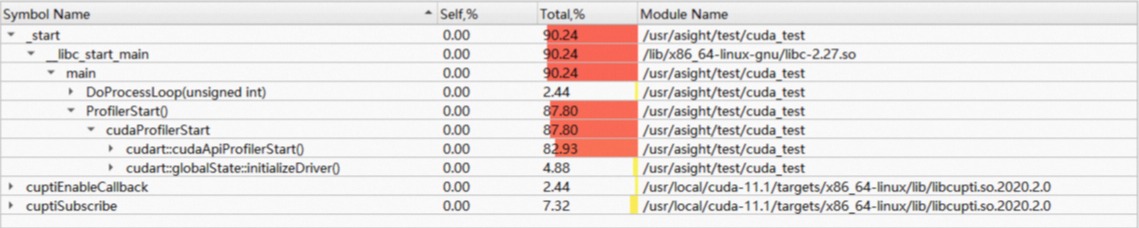
The Top-Down view displays functions in a tree structure based on their call relationships, from the top-level callers down to the callees. In the preceding figure, both the DoProcessLoop and ProfilerStart functions are called within the main function, so they both belong to the main node.
The Self value for the main function is 0, indicating that the logic within the main function itself is very simple. The Total value is 90.24%, indicating that functions called by main consume most of the execution time.
Tip: The maximum backtrace depth set during collection determines the call stack's depth. If a function's call depth exceeds this maximum, the top-most function reached during the backtrace is used as the root node.
If a symbol's name cannot be obtained, the function's address is displayed instead.
Bottom-Up table
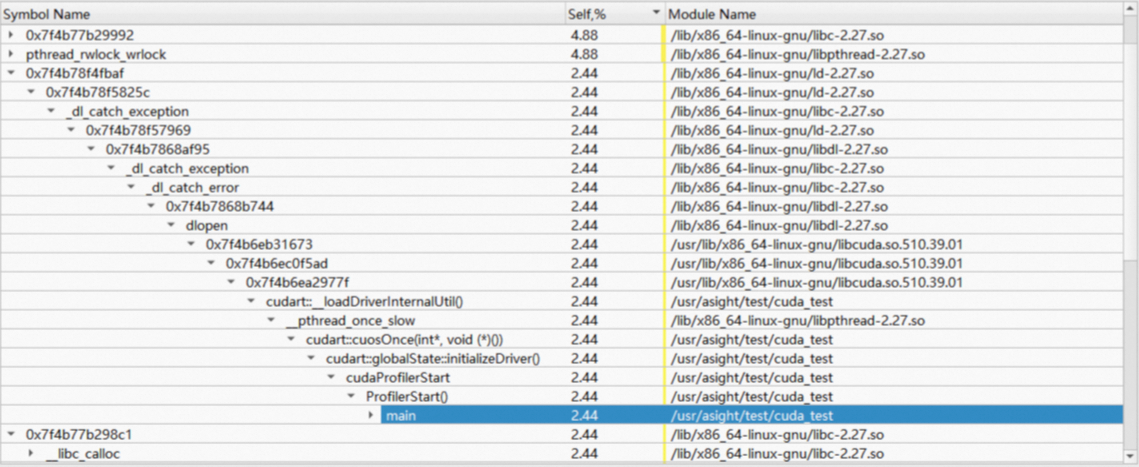
The Bottom-Up view is the reverse of the Top-Down view, with the most deeply nested function as the root node and the top-level caller as a leaf node. For example, in the preceding figure, the main function is a leaf node. The Bottom-Up view does not display the Total column.
Flat table
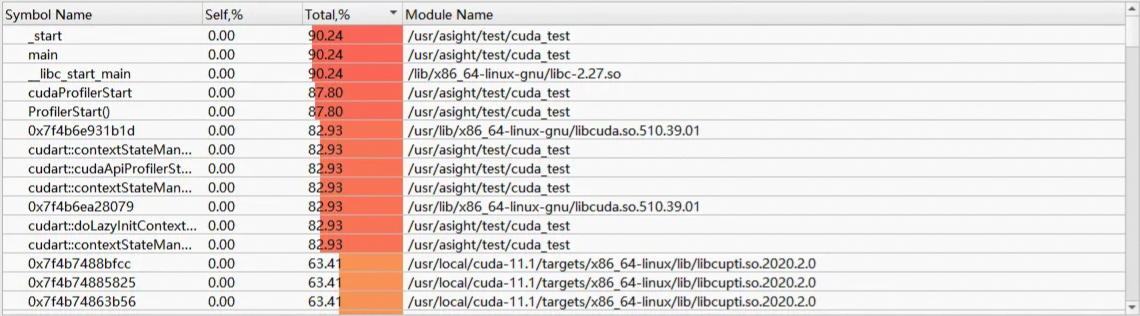
The Flat view displays all functions in a simple list. In scenarios where call relationships are not important, you can use this view to quickly find the functions with the highest Self and Total time consumption.
3.11 Device memory view
Use the Device Memory View to analyze device memory allocation and deallocation across all functions.
The Device Memory View supports four viewing modes, which can be selected from the drop-down list:

Unreleased Malloc Size: View the size of allocated but not yet released memory for each function.
Total Malloc Size: View the total size of memory allocated by each function.
Unreleased Malloc Count: The count of unreleased memory allocations for each function.
Total Malloc Count: The total number of memory allocations for each function.
The Device Memory View also supports flame graphs, icicle graphs, and the three table formats: Top-Down, Bottom-Up, and Flat. It also supports sorting, searching, and filtering to help you quickly find hotspot functions. To use the Device Memory View, you must enable device memory sampling when collecting the report. See Track Memory Usage for details.
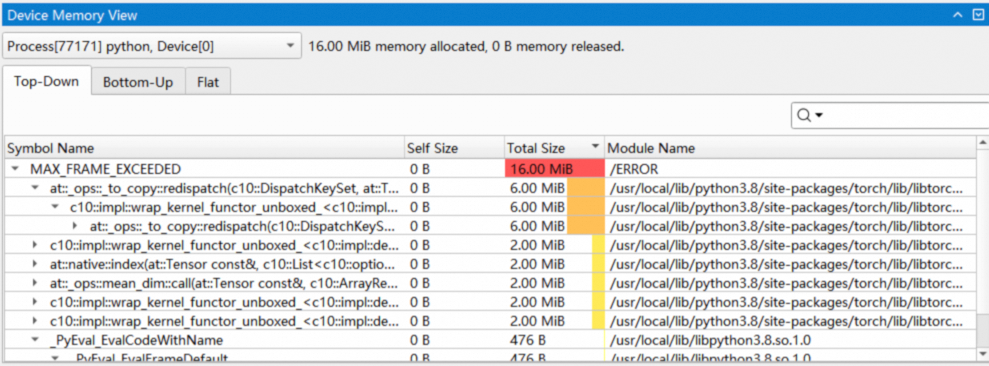
The table displays the following information:
Symbol Name: The function name.
Self: The amount of device memory allocated or freed by the function itself. Positive values (allocations) are shown in red, and negative values (frees) are shown in blue.
Total: The total amount of device memory allocated or freed by the function and the functions it calls.
Module Name: The name of the module to which the function belongs.
3.12 Host pinned memory view
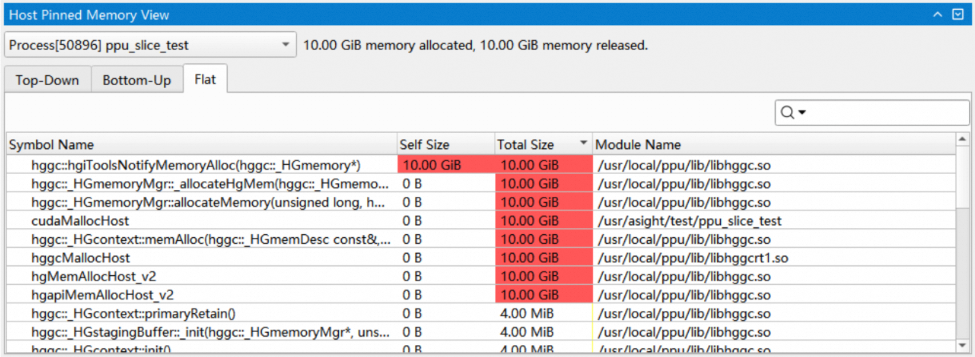
Use the Host Pinned Memory View to analyze pinned memory allocations and deallocations by function. Like the Device Memory View, it supports four viewing modes, flame graphs, icicle graphs, and the three table formats: Top-Down, Bottom-Up, and Flat. It also supports sorting, searching, and filtering to help you quickly find hotspot functions. To use the Host Pinned Memory View, you must enable pinned memory sampling when collecting the report. See Analyze Pinned Memory Usage for details.
3.13 Heap memory view
Use the Heap Memory View to analyze CPU-side dynamic memory allocation (heap memory) usage by function. Like the Device Memory View, it supports four viewing modes, flame graphs, icicle graphs, and the three table formats: Top-Down, Bottom-Up, and Flat. It also supports sorting, searching, and filtering to help you quickly find hotspot functions. To use the Heap Memory View, you must enable heap memory sampling when collecting the report. See Track Heap Memory Usage for details. Clicking a time block in the Heap memory usage row in the Timeline View shows the process's memory usage information up to that point in time.

4. Analysis summary
The Analysis Summary page displays a summary of the report in several tables, including the data collection settings used to generate it. You can select and copy information from the tables.
In the Page drop-down list, select Analysis Summary View:
The following image shows the Analysis Summary view:
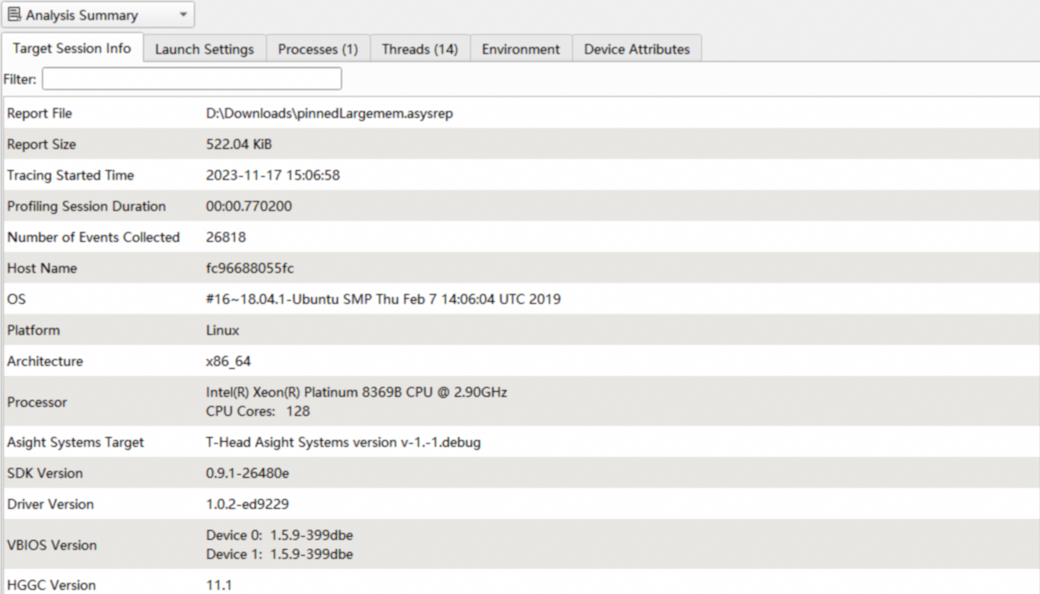
The Analysis Summary view contains the following sections:
Launch settings
Session info
Processes
Threads
Environment
Device attributes
4.1 Launch settings
The Launch settings table displays the configuration used to collect the report:
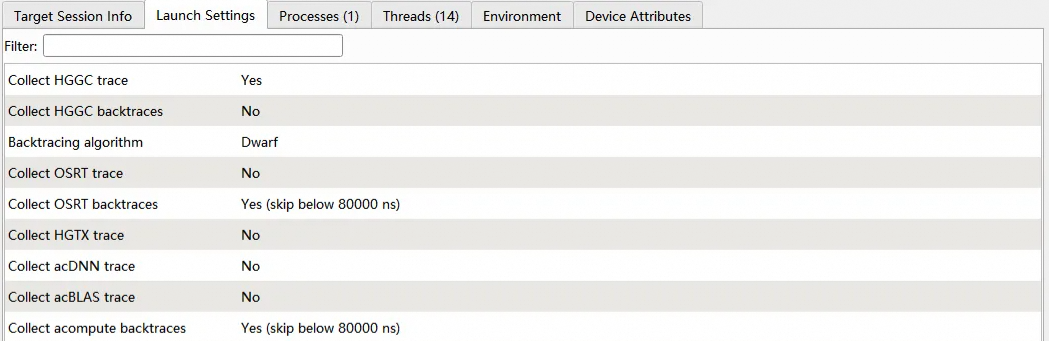
Parameter | Description |
Collect HGGC trace | Whether HGGC trace information was collected. |
Collect HGGC backtraces | Whether HGGC backtraces were collected. |
Backtracing algorithm | The algorithm used for backtrace collection. |
Collect OSRT trace | Whether OSRT trace information was collected. |
Collect OSRT backtraces | Whether OSRT backtraces were collected. |
Collect HGTX trace | Whether HGTX trace information was collected. |
Collect acDNN trace | Whether acDNN trace information was collected. |
Collect acBLAS trace | Whether acBLAS trace information was collected. |
Collect CPU samples | Whether CPU sampling was performed. |
Delay | The delay before the collection started. |
4.2 Session info
The Session info table lists metadata about the collection session:
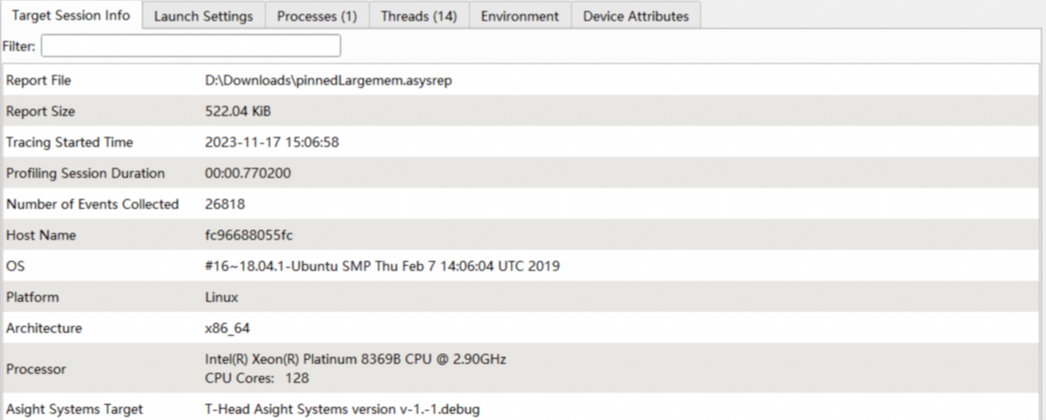
Item | Description |
Report file | Path to the generated report file. |
Report size | Size of the report file. |
Tracing started time | Start time of the data collection. |
Target name | Name of the target. |
Target OS | Operating system of the target. |
Platform | The operating system platform. |
Target architecture | Architecture of the target. |
Target processor | Processor of the target. |
Asight Systems target | Version of the asys CLI on the target. |
CLI command used | The command and arguments used with the asys CLI tool. |
4.3 Other information
The Analysis Summary view also contains the following tables:
Item | Description |
Processes | Lists the processes included in the report. |
Threads | Lists the threads included in the report. |
Environment | Environment variables of the PPU application. |
Device attributes | Device attributes of the PPU. |
5. Diagnostics summary
Use this page to view all diagnostic information in the report, including severity, source, process ID, relative event time, and description. The Timeline View displays an aggregated summary of diagnostic information in its upper-right corner. Click the summary to open the Diagnostics Summary View.


6. Files
Use the Files page to view application log files in the report to help identify and troubleshoot issues. You can currently view three types of logs: stdout, stderr, and python functions trace json.
Note: By default, the asys command line saves stdout and stderr to the report. To display the python functions trace json content, you must specify collection using json.
7. Options
The Asight Systems GUI includes an Options dialog that lets you customize the interface. To open the Options dialog, select Tools > Options... from the menu bar, as shown in the following figure:
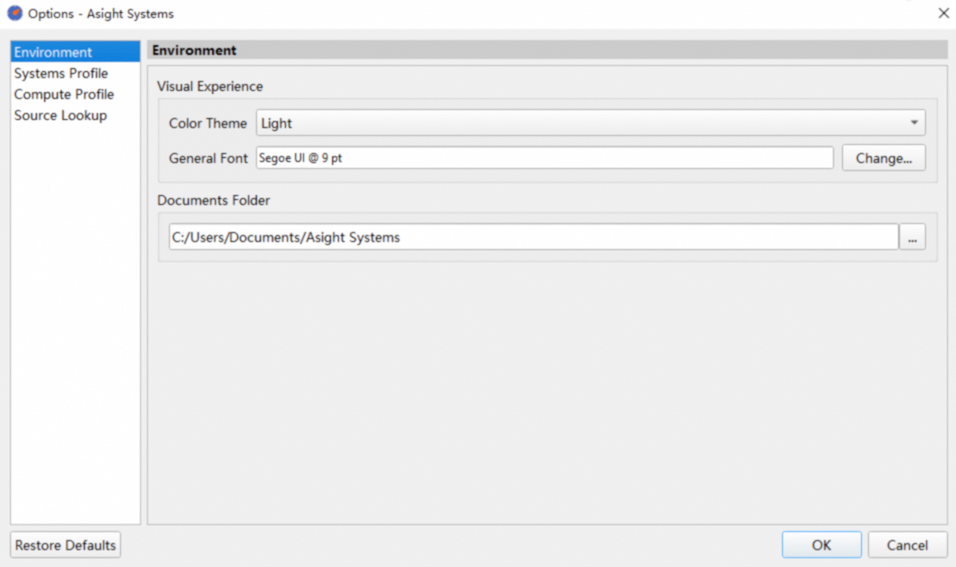
The Options dialog contains two tabs for Asight Systems:
Environment
Systems Profile
Modified options are shown in bold. Click the Restore Defaults button to revert to the default settings.
8.1 Environment
The Environment page lists the global settings for the Asight Systems GUI:
Parameter | Description |
Color theme | Sets the application theme. Supported themes: Light and Dark. |
General font | Sets the font used throughout the GUI. |
Documents folder | Sets the directory where reports are saved during remote data collection. |
8.2 Systems Profile
The options on the Systems Profile page control how reports are displayed:
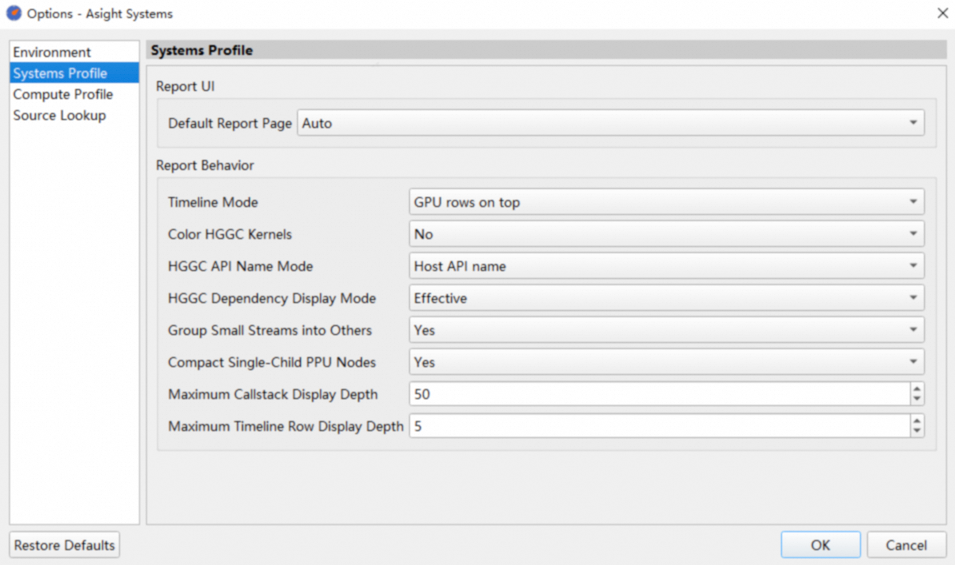
Parameter | Description |
Default report page | Sets the initial page displayed when a report is opened. The default is Auto, which lets Asight Systems determine the initial page. |
Color HGGC kernels | Displays different kernels in different colors in the timeline view. Default: No. |
HGGC API name mode | When enabled, this option displays HGGC launch APIs with their corresponding kernel names. Default: Host API name. |
HGGC dependency display mode | Determines the start point for calculating PPU activity dependencies, which can be either the start of the report or the start of the corresponding host API. Default: Effective (starts from the host API start time). |
Group small streams into others | Groups streams with low time occupancy and displays them as 'other streams'. Default: Yes. |
Compact single-child PPU nodes | When enabled, this option compacts PPU nodes with a single child to simplify the view. For example, if a Device node has only one Context node, the Context node is hidden, and its children are shown directly under the Device node. The same logic applies to Stream nodes. Default: Yes. |
Timeline mode | Determines the layout of PPU and CPU information in the timeline view. |
Maximum call stack display depth | Sets the maximum display depth for call stacks. |
Maximum timeline row display depth | Sets the maximum display depth for timeline rows. Rows deeper than this limit are collapsed. Click the |
 button to expand them.