FAQ & known issues
FAQ
1. Minimize test environment variance
To minimize environmental variance between collection runs when profiling with acu, set the device to exclusive mode. This prevents other applications from running while acu is sampling data.
# Set the device to exclusive mode
ppu-smi -c EXCLUSIVE_PROCESS

# Restore the device to default mode
ppu-smi -c DEFAULT
You can also lock the device frequency to reduce the impact of dynamic frequency scaling on acu sampling:
# Lock the device frequency to 1.5 GHz
ppu-smi -lpc 1500

# Unlock the frequency
ppu-smi -rpc
2. acu hangs after the target application exits
Some applications fork multiple child processes. If these child processes continue to run after the main process exits, acu will wait for them to terminate. This may cause the acu process to appear to hang.
To verify this scenario:
Install the
pstreeutility.If
acuappears to hang, open another terminal and run the command:pstree <acu_pid>. Check the output for any child processes forked from the target application. The presence of such processes confirms that they have not exited.
Workaround:
Use the --wait primary argument in your acu command. This instructs acu to wait only for the main process of the target application to exit.
3. Error: device is not ready for profiling
This error usually indicates that the PPU's performance collection resource, PCM, is being used by another application, which prevents acu from starting a collection. The resource might be occupied by another asys or acu instance, or by a background monitoring program that collects PPU runtime metrics.
Run the
sudo lsof /dev/alixpuanddmesg --level=err,crit,alert,emergcommands to identify which application is using the PPU PCM.Run
ppu-smito find your KMD version by checking theDriver Versionin the output.If your KMD version is earlier than 1.4.0, you must manually stop the application that is using the PCM resource (identified in step 1), and then run
acuagain.If your KMD version is 1.4.0 or later, you can use
ppu-smito temporarily disable collection for other applications. Refer to the commands below. For more details, see Set performance monitoring output status.# Check the GPM stream status. If the PCM is in use and acu cannot collect data, this command should return ENABLED. ppu-smi gpm -g # Temporarily disable the GPM stream to allow acu to collect data. ppu-smi gpm -s DISABLED # Verify the status. The command should now return DISABLED. ppu-smi gpm -g # At this point, acu should work correctly. # After the acu collection is complete, restore the GPM stream status. ppu-smi gpm -s ENABLED # Verify the status. The command should now return ENABLED. ppu-smi gpm -g
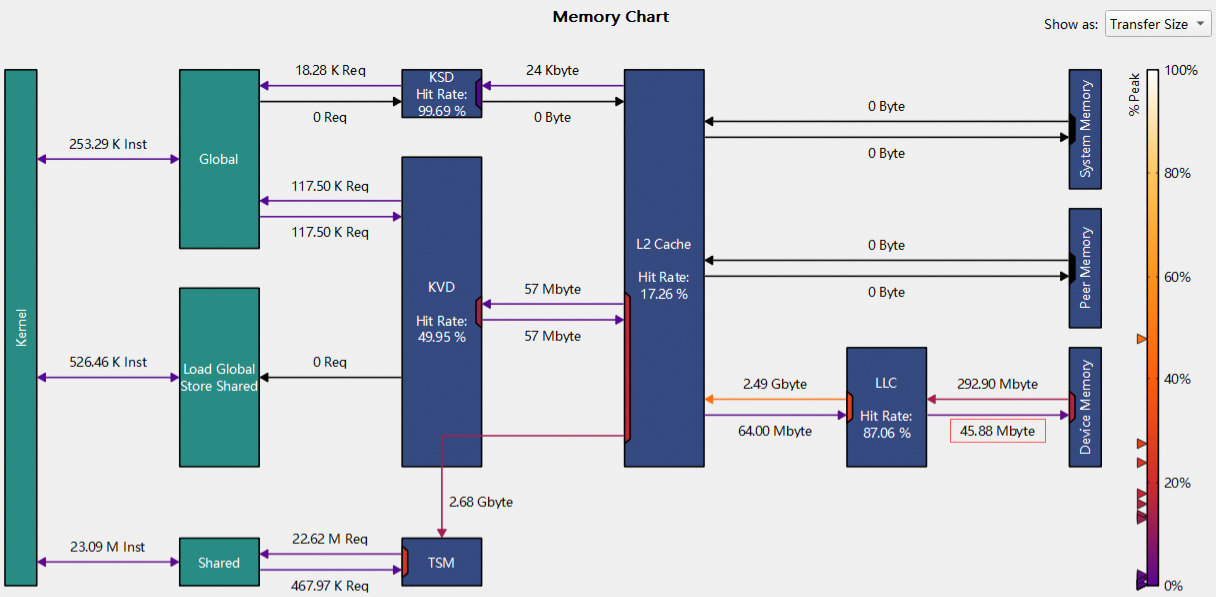
4. LLC writes less data to DRAM
You may observe a discrepancy in memory transfer metrics. For example, in a device-to-host (D2H) memory operation, 64 MB of data might be written from L2 cache to the Last-Level Cache (LLC), but the metrics show only 45.88 MB written from the LLC to DRAM.
This discrepancy occurs because the driver layer terminates the kernel execution as soon as data is written to the LLC. At this point, the performance counters stop. However, the actual data transfer from the LLC to DRAM is an asynchronous hardware operation that occurs later. Consequently, the counter for LLC-to-DRAM writes underreports the total amount of data transferred.
Known issues
PPU SDK v1.2.0:
acumight crash when profiling applications that subscribe tohgpti.Profiling applications that use
hggcLaunchCooperativeKernelMultiDeviceis not supported.If the file I/O throughput for the output path specified by the
acu -ooption is low,acumay generate an incomplete report.The
--profile-from-startoption does not support cross-process control of the profiling scope.Applications must be compiled with the
-pthreadoption. Otherwise,acumay crash at runtime.If the
acucollection process is interrupted, the collected trace information may not be displayed correctly.In Warp State Statistics, the Avg. Active Threads Per Warp [inst] value is relatively low.
In Range Replay mode, APIs related to memory capture and replay are unstable and may affect data accuracy. The affected APIs are listed below:
# HGGC runtime API
hggcMemcpy2D,
hggcMemcpy2DArrayToArray,
hggcMemcpy2DArrayToArray_ptds,
hggcMemcpy2DAsync,
hggcMemcpy2DAsync_ptsz,
hggcMemcpy2DFromArray,
hggcMemcpy2DFromArrayAsync,
hggcMemcpy2DFromArrayAsync_ptsz,
hggcMemcpy2DFromArray_ptds,
hggcMemcpy2DToArray,
hggcMemcpy2DToArrayAsync,
hggcMemcpy2DToArrayAsync_ptsz,
hggcMemcpy2DToArray_ptds,
hggcMemcpy2D_ptds,
hggcMemcpy3D,
hggcMemcpy3DAsync,
hggcMemcpy3DAsync_ptsz,
hggcMemcpy3DPeer,
hggcMemcpy3DPeerAsync,
hggcMemcpy3DPeerAsync_ptsz,
hggcMemcpy3DPeer_ptds,
hggcMemcpy3D_ptds,
hggcMemcpyArrayToArray,
hggcMemcpyArrayToArray_ptds,
hggcMemcpyAsync,
hggcMemcpyAsync_ptsz,
hggcMemcpyFromArray,
hggcMemcpyFromArrayAsync,
hggcMemcpyFromArrayAsync_ptsz,
hggcMemcpyFromArray_ptds,
hggcMemcpyFromSymbol,
hggcMemcpyFromSymbolAsync,
hggcMemcpyFromSymbolAsync_ptsz,
hggcMemcpyFromSymbol_ptds,
hggcMemcpyPeer,
hggcMemcpyPeerAsync,
hggcMemcpyToArray,
hggcMemcpyToArrayAsync,
hggcMemcpyToArrayAsync_ptsz,
hggcMemcpyToArray_ptds,
hggcMemcpyToSymbol,
hggcMemcpyToSymbolAsync,
hggcMemcpyToSymbolAsync_ptsz,
hggcMemcpyToSymbol_ptds,
hggcMemcpy_ptds,
hggcMemset,
hggcMemset2D,
hggcMemset2DAsync,
hggcMemset2DAsync_ptsz,
hggcMemset2D_ptds,
hggcMemset3D,
hggcMemset3DAsync,
hggcMemset3DAsync_ptsz,
hggcMemset3D_ptds,
hggcMemsetAsync,
hggcMemsetAsync_ptsz,
hggcMemset_ptds,
hggcStreamAttachMemAsync,
hggcStreamAttachMemAsync_ptsz,
hggcHostAlloc,
hggcMalloc,
hggcMalloc3D,
hggcMalloc3DArray,
hggcMallocArray,
hggcMallocHost,
hggcMallocManaged,
hggcMallocMipmappedArray,
hggcMallocPitch,
hggcFree,
hggcFreeArray,
hggcFreeHost,
hggcFreeMipmappedArray,
hggcLaunch,
hggcLaunch_ptsz,
hggcLaunchKernel_ptsz,
hggcLaunchCooperativeKernel_ptsz,
hggcLaunchCooperativeKernelMultiDevice,

# Hggc Driver API
hgMemcpyHtoD,
hg64MemcpyHtoD,
hgMemcpyDtoH,
hg64MemcpyDtoH,
hgMemcpyDtoD,
hg64MemcpyDtoD,
hgMemcpyDtoA,
hg64MemcpyDtoA,
hgMemcpyAtoD,
hg64MemcpyAtoD,
hgMemcpyHtoA,
hgMemcpyAtoH,
hgMemcpyAtoA,
hgMemcpy2D,
hgMemcpy2DUnaligned,
hgMemcpy3D,
hg64Memcpy3D,
hgMemcpyHtoDAsync,
hg64MemcpyHtoDAsync,
hgMemcpyDtoHAsync,
hg64MemcpyDtoHAsync,
hgMemcpyDtoDAsync,
hg64MemcpyDtoDAsync,
hgMemcpyHtoAAsync,
hgMemcpyAtoHAsync,
hgMemcpy2DAsync,
hgMemcpy3DAsync,
hg64Memcpy3DAsync,
hg64Memcpy2D,
hg64Memcpy2DUnaligned,
hg64Memcpy2DAsync,
hgMemcpy_v2,
hgMemcpyHtoD_v2,
hgMemcpyHtoDAsync_v2,
hgMemcpyDtoH_v2,
hgMemcpyDtoHAsync_v2,
hgMemcpyDtoD_v2,
hgMemcpyDtoDAsync_v2,
hgMemcpyAtoH_v2,
hgMemcpyAtoHAsync_v2,
hgMemcpyAtoD_v2,
hgMemcpyDtoA_v2,
hgMemcpyAtoA_v2,
hgMemcpy2D_v2,
hgMemcpy2DUnaligned_v2,
hgMemcpy2DAsync_v2,
hgMemcpy3D_v2,
hgMemcpy3DAsync_v2,
hgMemcpyHtoA_v2,
hgMemcpyHtoAAsync_v2,
hgMemcpy,
hgMemcpyAsync,
hgMemcpyPeer,
hgMemcpyPeerAsync,
hgMemcpy3DPeer,
hgMemcpy3DPeerAsync,
hgMemcpyHtoD_v2_ptds,
hgMemcpyDtoH_v2_ptds,
hgMemcpyDtoD_v2_ptds,
hgMemcpyDtoA_v2_ptds,
hgMemcpyAtoD_v2_ptds,
hgMemcpyHtoA_v2_ptds,
hgMemcpyAtoH_v2_ptds,
hgMemcpyAtoA_v2_ptds,
hgMemcpy2D_v2_ptds,
hgMemcpy2DUnaligned_v2_ptds,
hgMemcpy3D_v2_ptds,
hgMemcpy_ptds,
hgMemcpyPeer_ptds,
hgMemcpy3DPeer_ptds,
hgMemcpyAsync_ptsz,
hgMemcpyHtoAAsync_v2_ptsz,
hgMemcpyAtoHAsync_v2_ptsz,
hgMemcpyHtoDAsync_v2_ptsz,
hgMemcpyDtoHAsync_v2_ptsz,
hgMemcpyDtoDAsync_v2_ptsz,
hgMemcpy2DAsync_v2_ptsz,
hgMemcpy3DAsync_v2_ptsz,
hgMemcpyPeerAsync_ptsz,
hgMemcpy3DPeerAsync_ptsz,
hgMemsetD8,
hg64MemsetD8,
hgMemsetD16,
hg64MemsetD16,
hgMemsetD32,
hg64MemsetD32,
hgMemsetD2D8,
hg64MemsetD2D8,
hgMemsetD2D16,
hg64MemsetD2D16,
hgMemsetD2D32,
hg64MemsetD2D32,
hgMemsetD8Async,
hg64MemsetD8Async,
hgMemsetD16Async,
hg64MemsetD16Async,
hgMemsetD32Async,
hg64MemsetD32Async,
hgMemsetD2D8Async,
hg64MemsetD2D8Async,
hgMemsetD2D16Async,
hg64MemsetD2D16Async,
hgMemsetD2D32Async,
hg64MemsetD2D32Async,
hgMemsetD8_v2,
hgMemsetD16_v2,
hgMemsetD32_v2,
hgMemsetD2D8_v2,
hgMemsetD2D16_v2,
hgMemsetD2D32_v2,
hgMemsetD8_v2_ptds,
hgMemsetD16_v2_ptds,
hgMemsetD32_v2_ptds,
hgMemsetD2D8_v2_ptds,
hgMemsetD2D16_v2_ptds,
hgMemsetD2D32_v2_ptds,
hgMemsetD8Async_ptsz,
hgMemsetD16Async_ptsz,
hgMemsetD32Async_ptsz,
hgMemsetD2D8Async_ptsz,
hgMemsetD2D16Async_ptsz,
hgMemsetD2D32Async_ptsz,
hgMemSetAccess,
hgStreamAttachMemAsync,
hgStreamAttachMemAsync_ptsz,
hgMemAlloc,
hg64MemAlloc,
hgMemAllocPitch,
hg64MemAllocPitch,
hgMemAllocHost,
hgMemHostAlloc,
hg64MemHostAlloc,
hgMemAlloc_v2,
hgMemAllocPitch_v2,
hgMemHostAlloc_v2,
hgMemAllocHost_v2,
hgMemAllocAsync,
hgMemAllocAsync_ptsz,
hgMemAllocFromPoolAsync,
hgMemAllocFromPoolAsync_ptsz,
hgMemFree,
hg64MemFree,
hgMemFreeHost,
hgMemFree_v2,
hgMemAddressFree,
hgMemFreeAsync,
hgMemFreeAsync_ptsz
In a multi-card scenario, enabling instruction statistics in App-Range Replay mode limits profiling to a single thread. This prevents multi-threaded acceleration, resulting in slower performance.
The
logical icnlink throughputmetric in the ICNlink Section is measured at the MAC layer. Therefore, its value will be higher than the actual user data transmitted and received over the ICNlink.On macOS, force-quitting the GUI while a report is opening may cause the application to crash or hang.
When you open a report collected with Asight Compute 1.5 or 1.6, the
IssueSlotUtilizationrule fails because thews__we_warps_active.avg.per_cycle_activemetric is missing from these reports.