This feature is available only to paid customers and is no longer sold to new customers.
Omnichannel Analysis works with Omnichannel Tags to provide rich and flexible insights into your existing users. It supports multi-dimensional analysis of all users and user segments. This helps your business team gain a comprehensive understanding of your users.
User overview
The top of the page displays the following information:
Total connected user assets: The number of existing users. This value is the count of unique user IDs in the current workspace that are pushed from the User Insights module and then identified and deduplicated by the Omnichannel Insights module.
Omnichannel Tags: The number of active omnichannel tags. Click the number to go to the Omnichannel Tags page.
Audience Management: The number of audiences created using the Audience Filter feature in Omnichannel Insights. Click the number to go to the Audience Management page.
Insight Management: The number of insight reports created in Insight Management under Omnichannel Analysis. Click the number to go to the Insight Management page.
Significant feature insights
You can analyze the overall feature distribution of all existing users in the current workspace to understand their significant features.
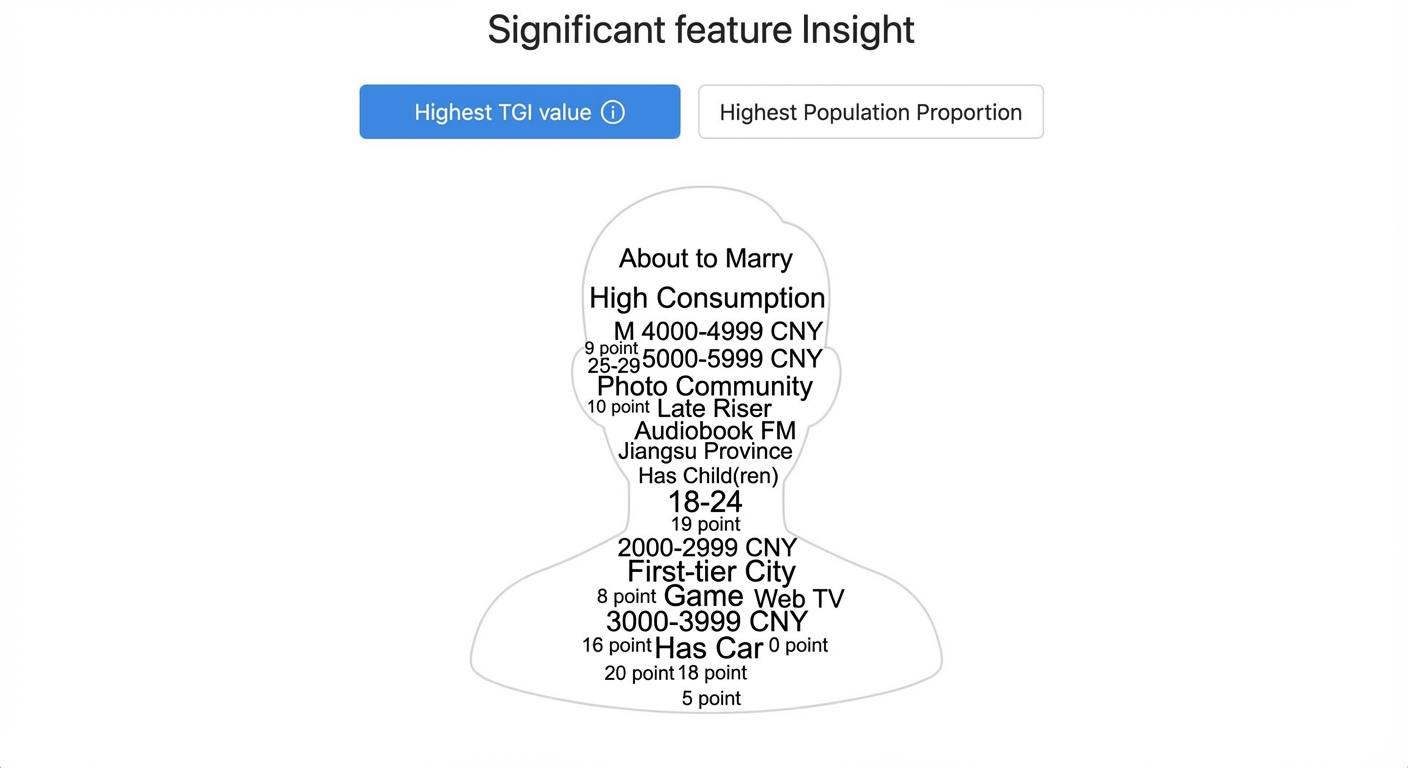
Switch between Highest TGI Value and Highest User Percentage to view the results of the Target Group Index (TGI) analysis and coverage analysis:
TGI analysis
Note: TGI stands for Target Group Index.
TGI = A / B * 100 (rounded).
A = The proportion of users in the "Target Audience" with a specific feature.
B = The proportion of users in the 'All Users' group with the specified feature.
A TGI of 100 represents the average.
A TGI of 100 is the average. A higher TGI means the feature is more pronounced in the target audience. A lower TGI means it is less pronounced.
This analysis helps you understand the significant features of your existing users compared to all users. The higher the TGI, the more prominent the tag value. The top 20 results are shown in the chart, and a full list is displayed on the right. (Only omnichannel tags are used for this calculation and sorting.)
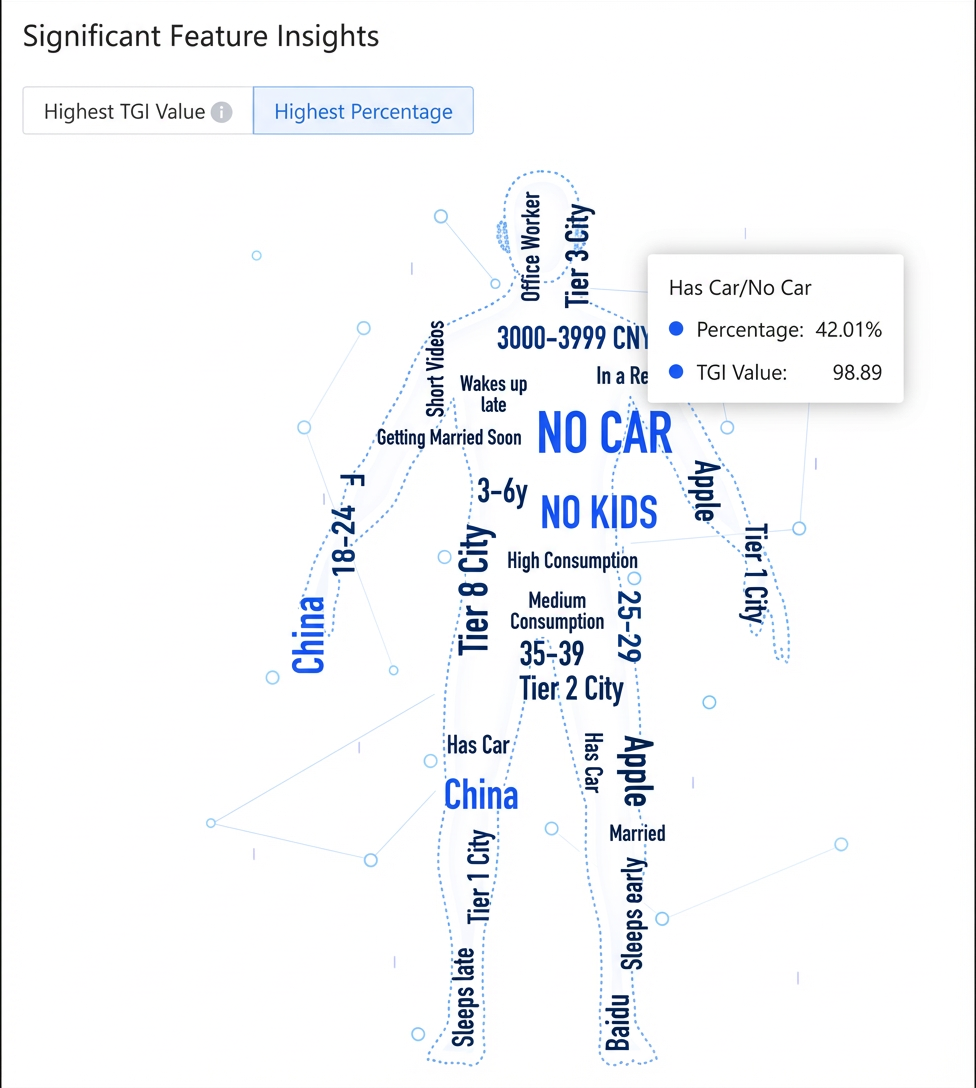
Coverage analysis
Note: Coverage is the number of users who have a specific tag value.
This analysis helps you understand the feature distribution of your existing users. The larger the coverage, the more prominent the tag value. The top 40 results are shown in the chart, and a full list is displayed on the right. (Only omnichannel tags are used for this calculation and sorting.)
Hover over a tag value to view its TGI value and user percentage, as shown in the following figure.
Extract an audience
You can use the Fetch Audience feature to quickly fetch features and generate audiences.
In the list, select one or more user features and click Extract Audience.
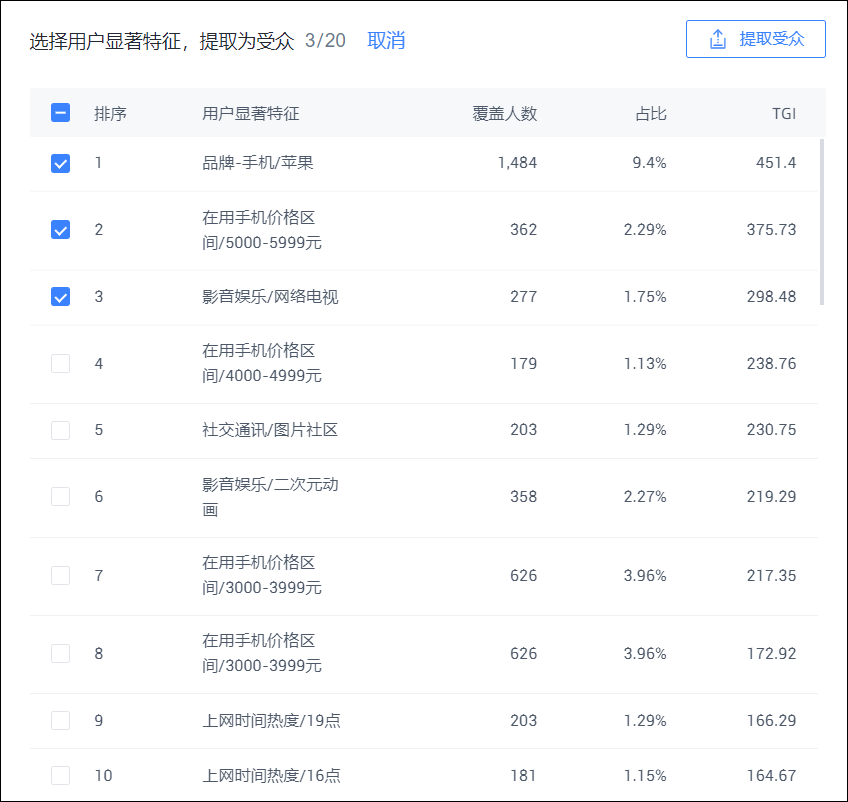
In the pop-up window, enter an audience name. If you selected multiple features, set the relationship to an intersection (users must have all features) or a union (users must have at least one feature). Configure whether to update the audience daily and whether to make it public. Click Create Audience. The new audience is added to the Audience Management list in Omnichannel Insights.
Insight Analysis
You can use Insight Analysis with omnichannel tags to perform multi-dimensional analysis on selected audiences and understand their complete profiles.
You can analyze audiences from both the Omnichannel Insights and User Insights modules.
You can add a comparison audience to compare features. The analysis results for the main audience and the comparison audience are displayed together in different colors.
Significant feature analysis
Select an audience and click the Significant Features tab. The page displays the significant feature distribution for the selected audience.
For more information, see the description in the Significant feature insights section of the user overview.
Feature distribution
Select an audience and click the Feature Distribution tab. Click Select Tags. In the pop-up window, select one or more omnichannel tags. The page then displays the feature distribution for the selected audience.
Cross analysis
You can use cross analysis to analyze the distribution of tag value combinations from two omnichannel tags within an audience.
Select an audience and click the Cross Analysis tab. Select a row variable tag and a column variable tag. The page displays the cross-distribution of the two tags for the selected audience.
Click the ![]() icon to swap rows and columns. Click the
icon to swap rows and columns. Click the  icon to filter and include only specific tag values in the analysis.
Save as insight report
After running an analysis, click Save as Insight Report in the upper-right corner to save the analysis charts as an insight report.
Enter a name for the report, specify whether to make it public, and click Save. The new report is added to the My Insight Reports list on the Insight Management page.
By default, charts for Significant Feature Analysis, Feature Distribution, and Cross Analysis are included in the report. To exclude charts, click Report Content Management in the upper-right corner, deselect the charts that you do not need, and then click Save as Insight Report.
Insight management
The Insight Management page contains the My Insight Reports list. This list shows the insight reports that you created and public reports created by other users in the same workspace.
Click a report name or Enter to view the report.
Click Delete to delete a report that you created.