Performance Reports
This feature is available only to paid customers and is no longer offered to new customers.
You can use performance reports to view the results of your ad placements.
Navigate to Media Placement > your workspace > Marketing Report > Performance Reports to view ad performance. The data includes total spend, media resource spend, media placement spend, impressions, CPM, clicks, click-through rate (CTR), and CPC.
The report provides statistics categorized by account, marketing contract, ad campaign, ad order, media, ad slot, and ad creative. It also provides charts to compare multiple projects or show a project's share of the total.
Statistics are available by day, hour, week, or month.
The page has four main sections: filter conditions, key metrics, analysis charts, and data reports.
1. Filter conditions:
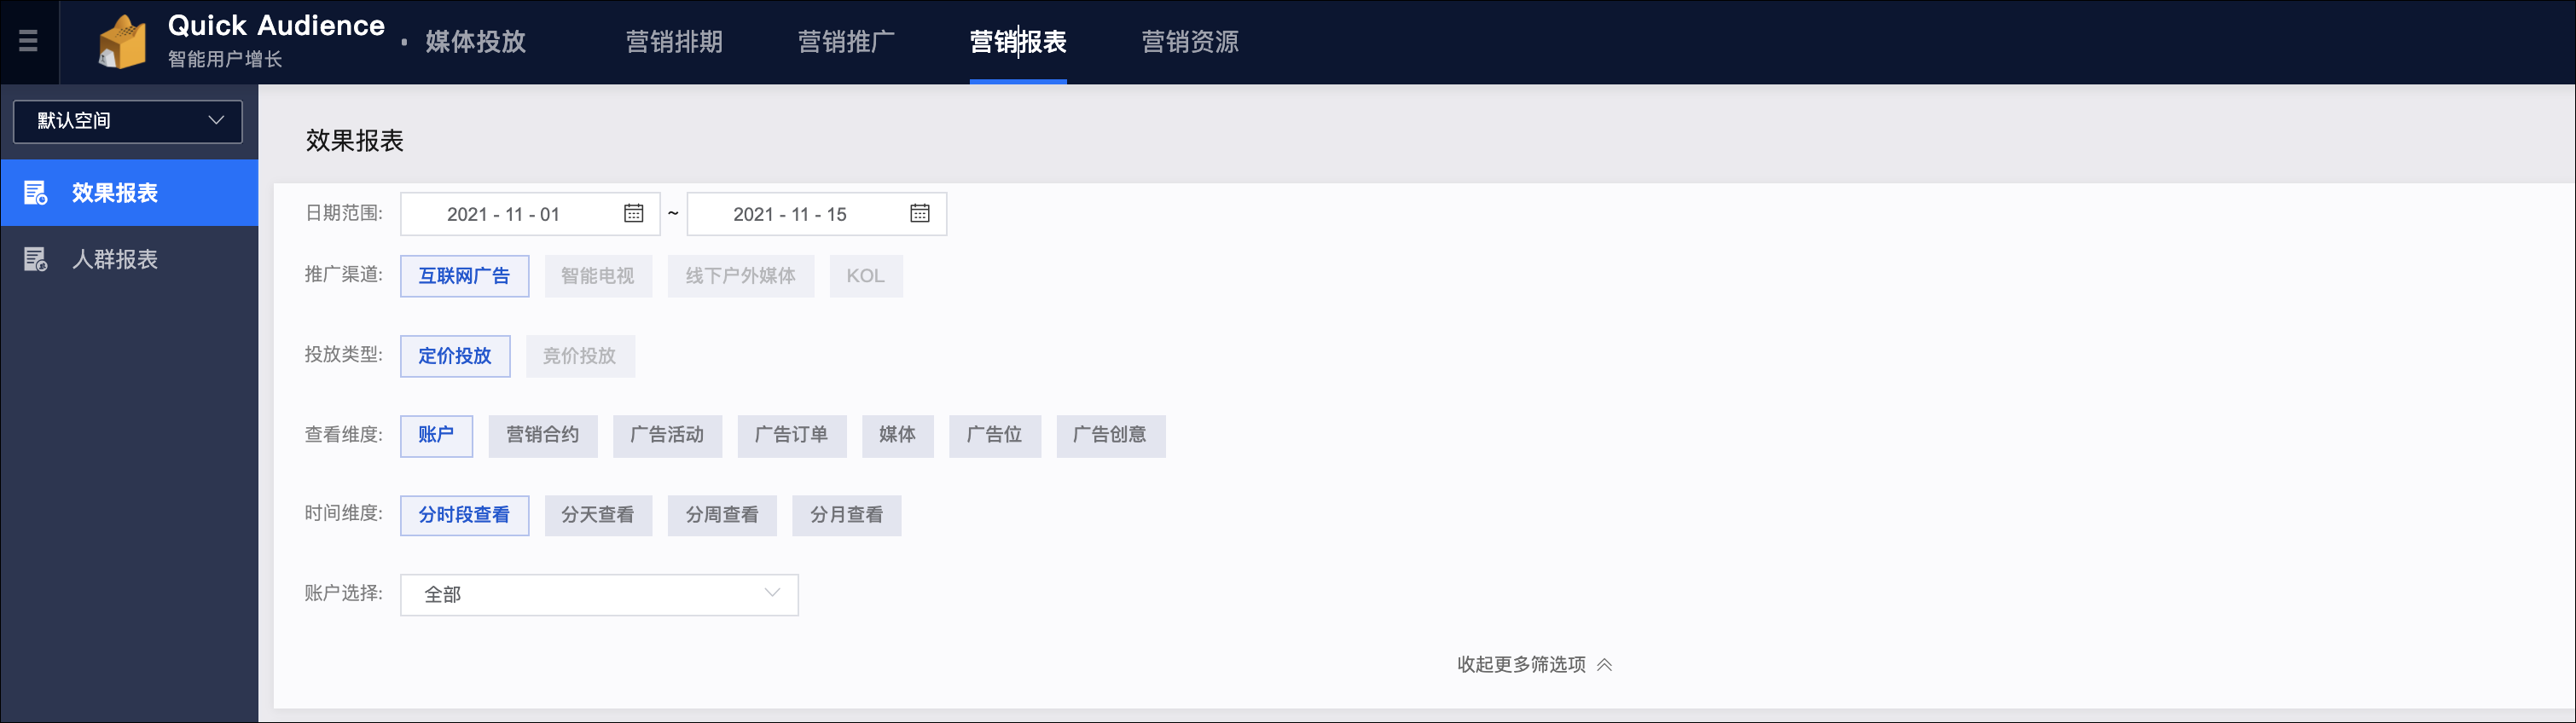
Date range: By default, the range is set to the current month. You can set a custom range, but it cannot exceed 180 days.
Promotion channel: Currently, only Internet ads are supported.
Placement type: Currently, only fixed-price placements are supported.
View by dimension: For fixed-price placements, the supported dimensions include account, marketing contract, ad campaign, ad order, media, ad slot, and ad creative. You can select one dimension to control how the data is aggregated.
After you select a dimension, a corresponding drop-down list appears below the time dimension option. All items are selected by default. You can select multiple items. If you select specific items, the charts below compare the selected items and show their respective shares of the total data.
Time dimension: By default, data is displayed by day. You can also view data by hour, week, or month. This setting controls the statistical period. For example, selecting 'by week' sets the statistical period to a calendar week, and selecting 'by month' sets it to a calendar month.
2. Key metrics:
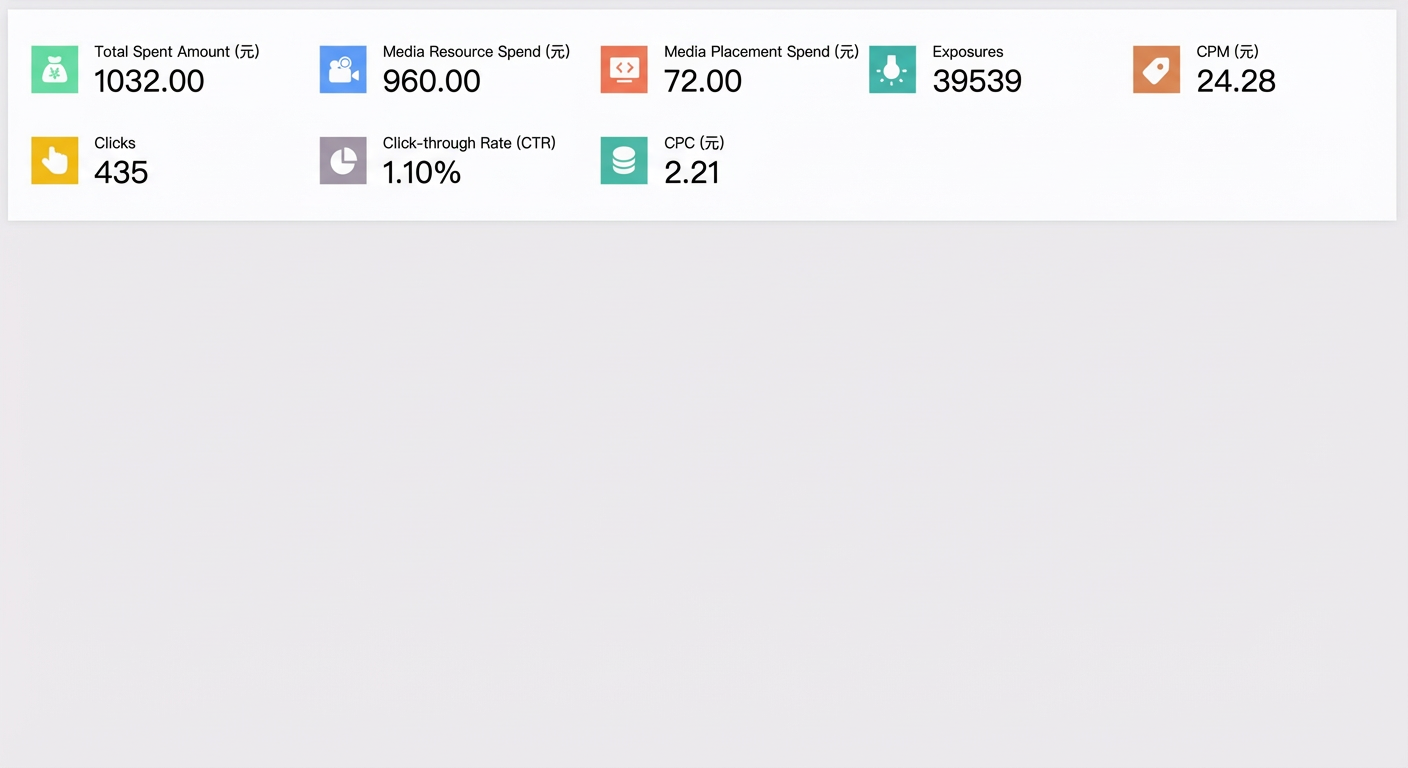
This section shows key metrics for the selected date range, including total spend, media resource spend, media placement spend, impressions, CPM, clicks, CTR, and CPC.
3. Analysis charts:
This section provides three types of charts: time trend, comparison analysis, and percentage analysis.
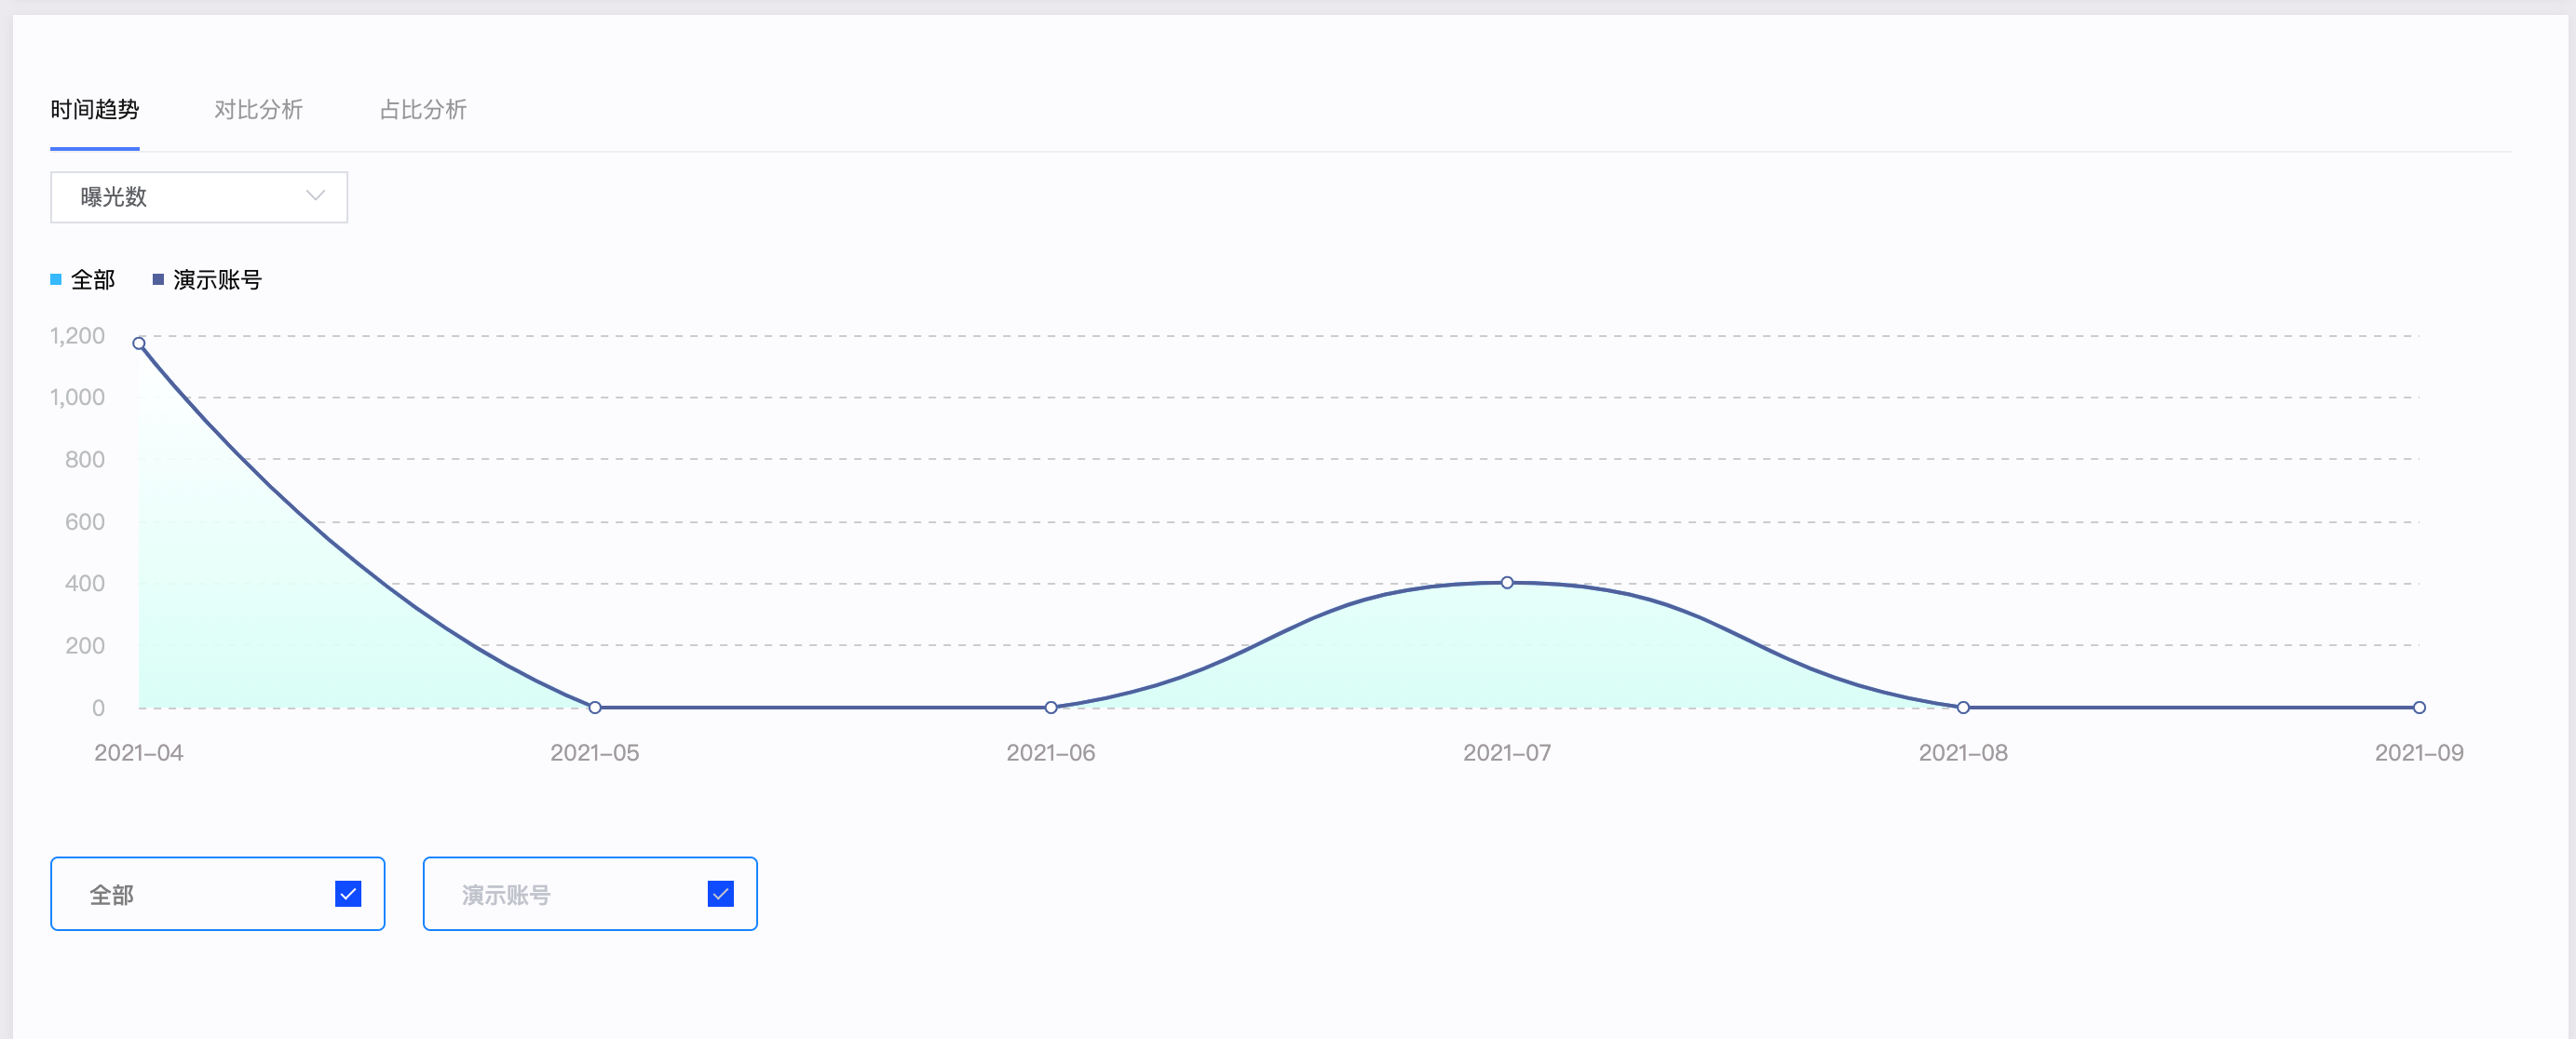
Time trend: You can select the data to view from the drop-down list. The chart then displays the time trend for the selected dimension items and the total data.
The horizontal axis corresponds to the time dimension you selected in the filters.
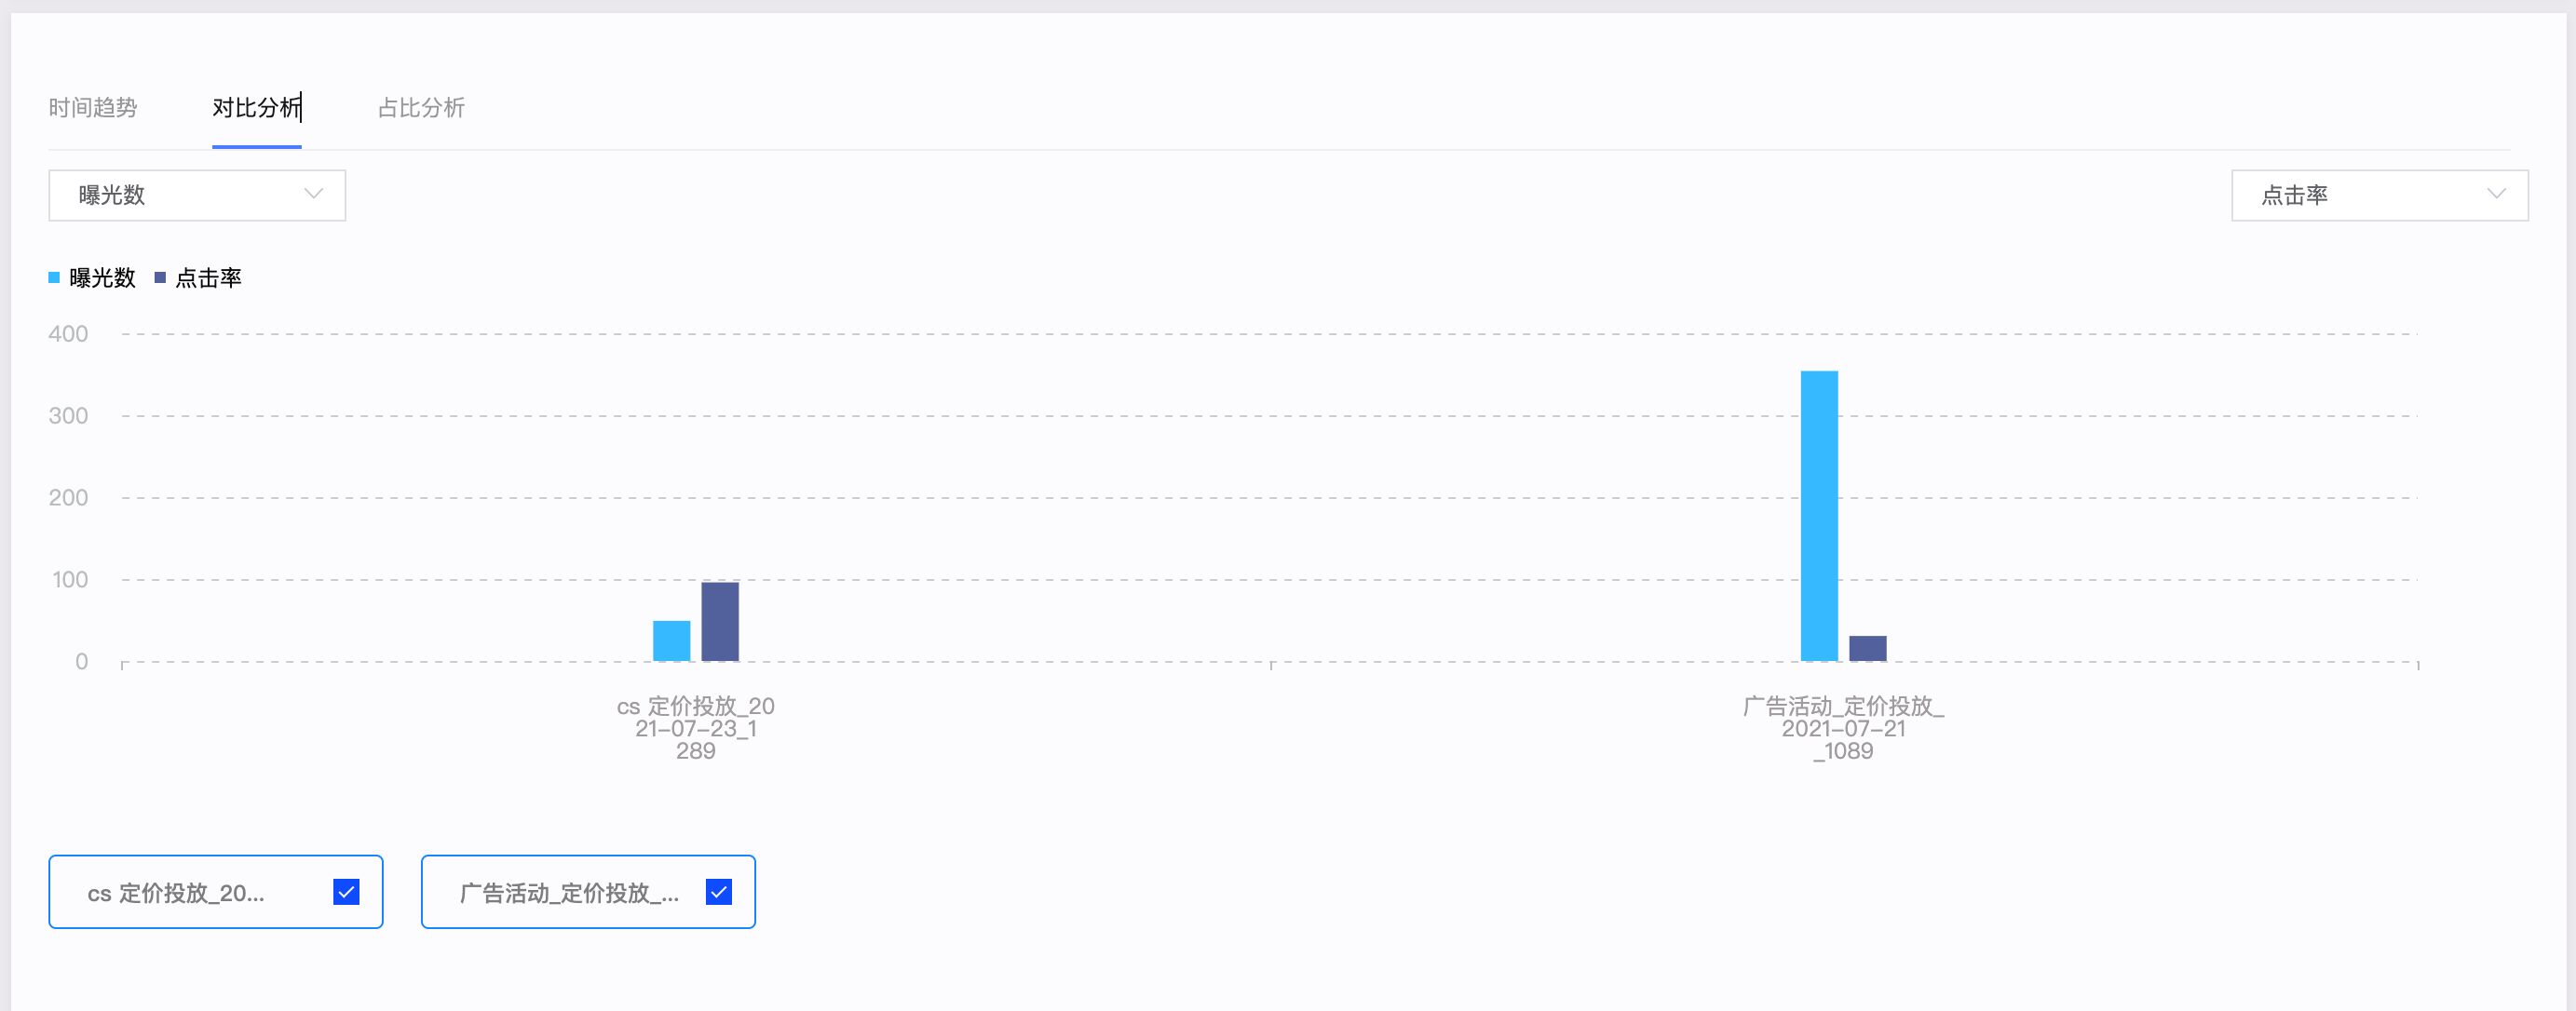
Comparison analysis: You can select data from the drop-down list to compare it across multiple dimension items.
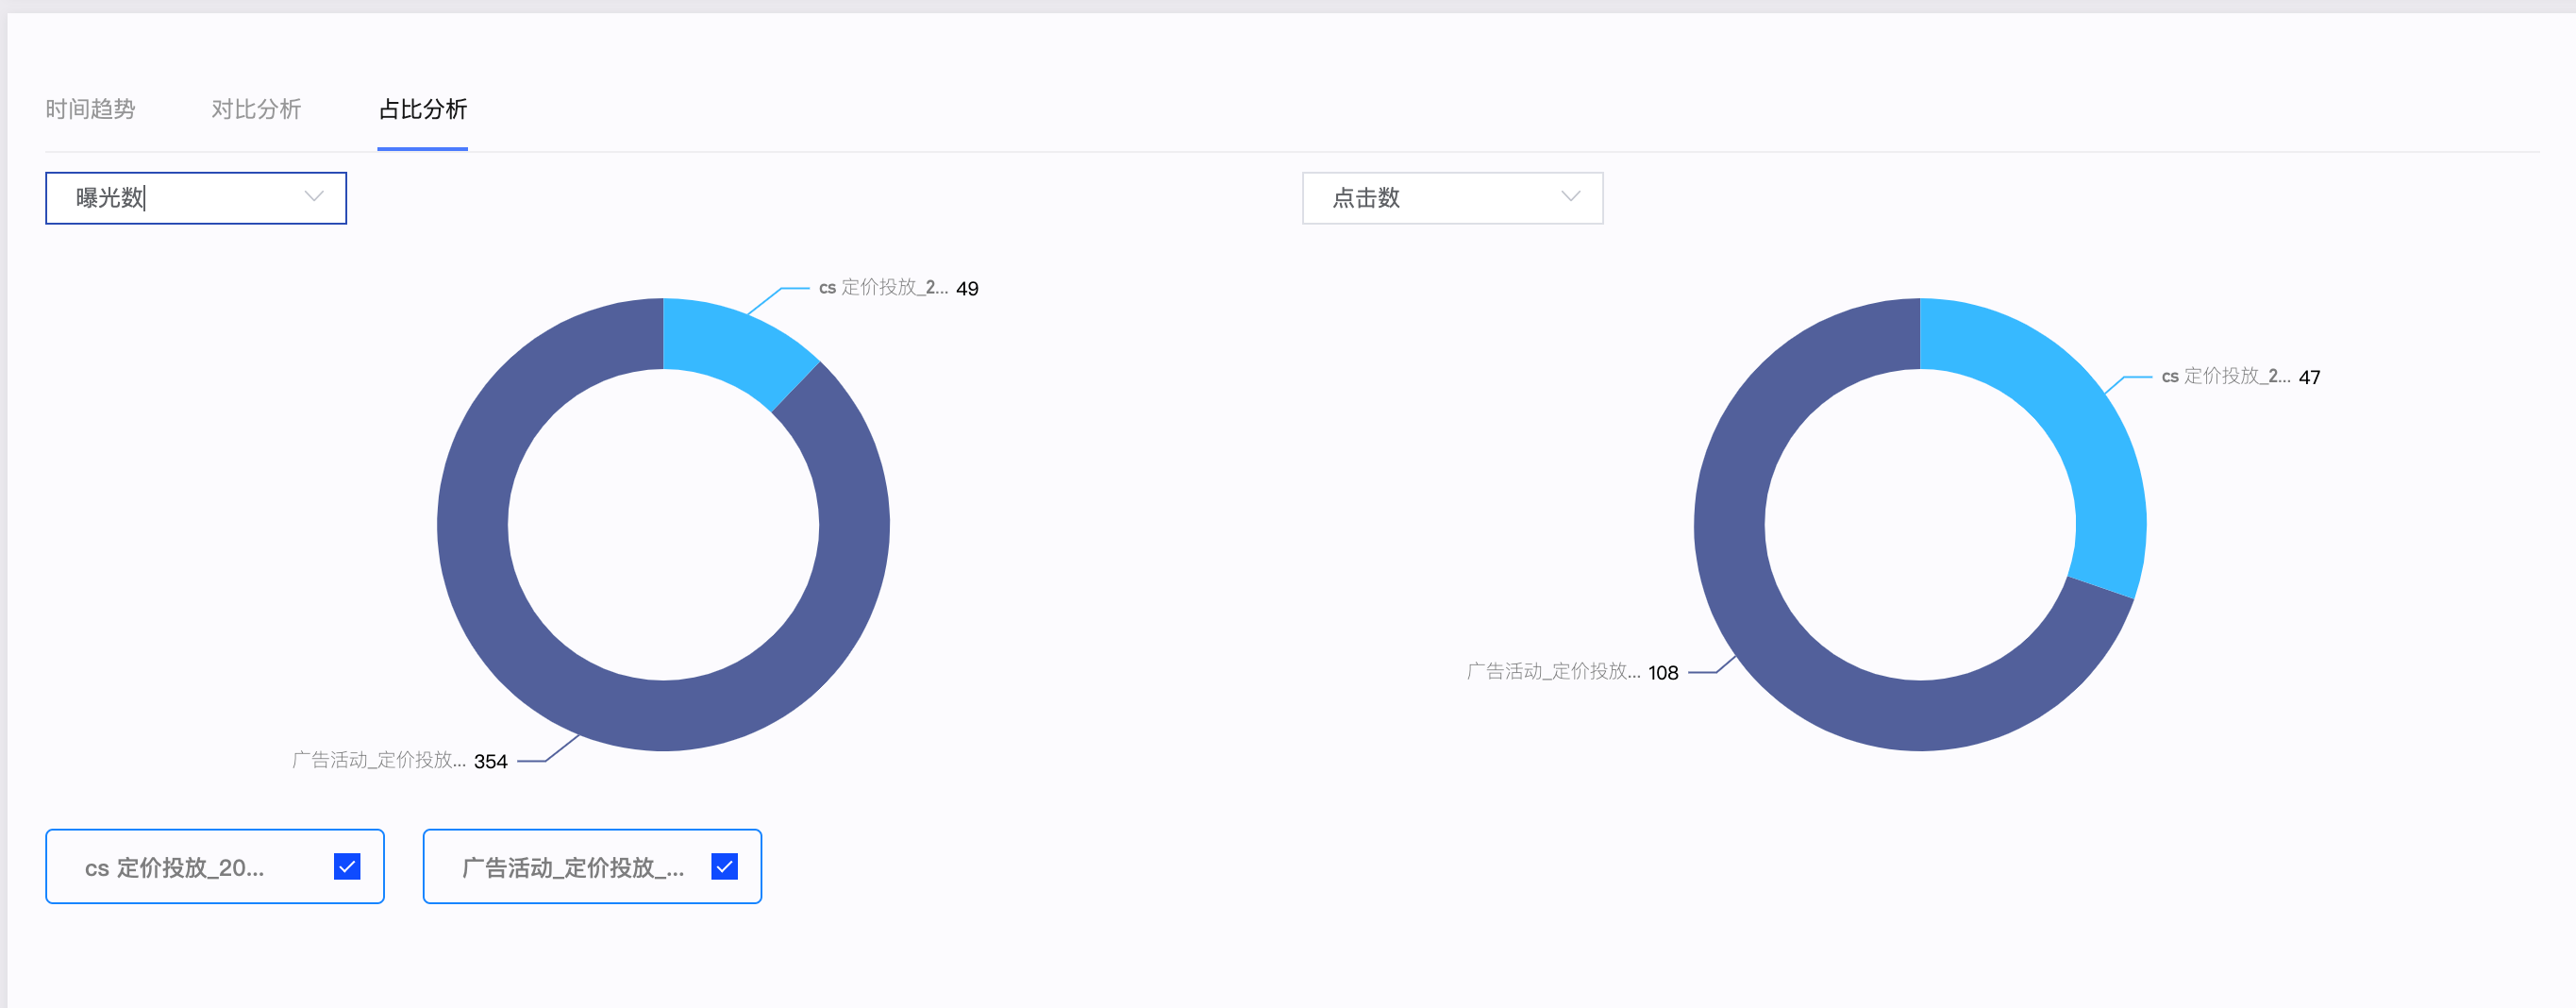
Percentage analysis: You can select data from the drop-down list to view the percentage that each selected dimension item contributes to the total.
4. Data reports:
This section provides reports organized by dimension type or by date.
View by dimension type:
This report is organized by the dimension you selected in the filters and shows data for each item.
Click the
 icon next to a dimension item to see its data broken down by the selected time dimension.
In the figure below, the view dimension is 'account' and the time dimension is 'time period'.
View by date:
This report is organized by the time dimension you selected in the filters and shows data for each time period.
Click the
icon next to a time period to see its data broken down by the selected view dimension.In the figure below, the time dimension is 'time period' and the view dimension is 'account'.
 icon next to a dimension item to see its data broken down by the selected time dimension.