Cloud Native Kit (CNKIT) is suitable for application development, testing, and online O&M. This topic describes typical scenarios in which you can use CNKIT, for example, to view and download pod logs, to audit commands in the terminal, and to develop and debug applications.
View and download pod logs
Pod logs can be categorized into standard output logs of pods and logs in pods. To view and download pod logs, perform the following operations:
-
Log on to the EDAS consoleEDAS console.
-
In the left-side navigation pane, choose . In the top navigation bar, select a region. In the upper part of the Applications page, select a microservices namespace from the Microservices Namespace drop-down list. Then, click the name of the application that you want to manage.
- In the left-side navigation pane of the Application Overview page, click Cloud Native Toolbox.
- In the Step 3: Service access configuration section below Opening steps, click A key to access to go to the PodList page.
To view and download the standard output log of a pod, perform the following operations:
- On the PodList page, click Pod Monitoring under the desired pod.
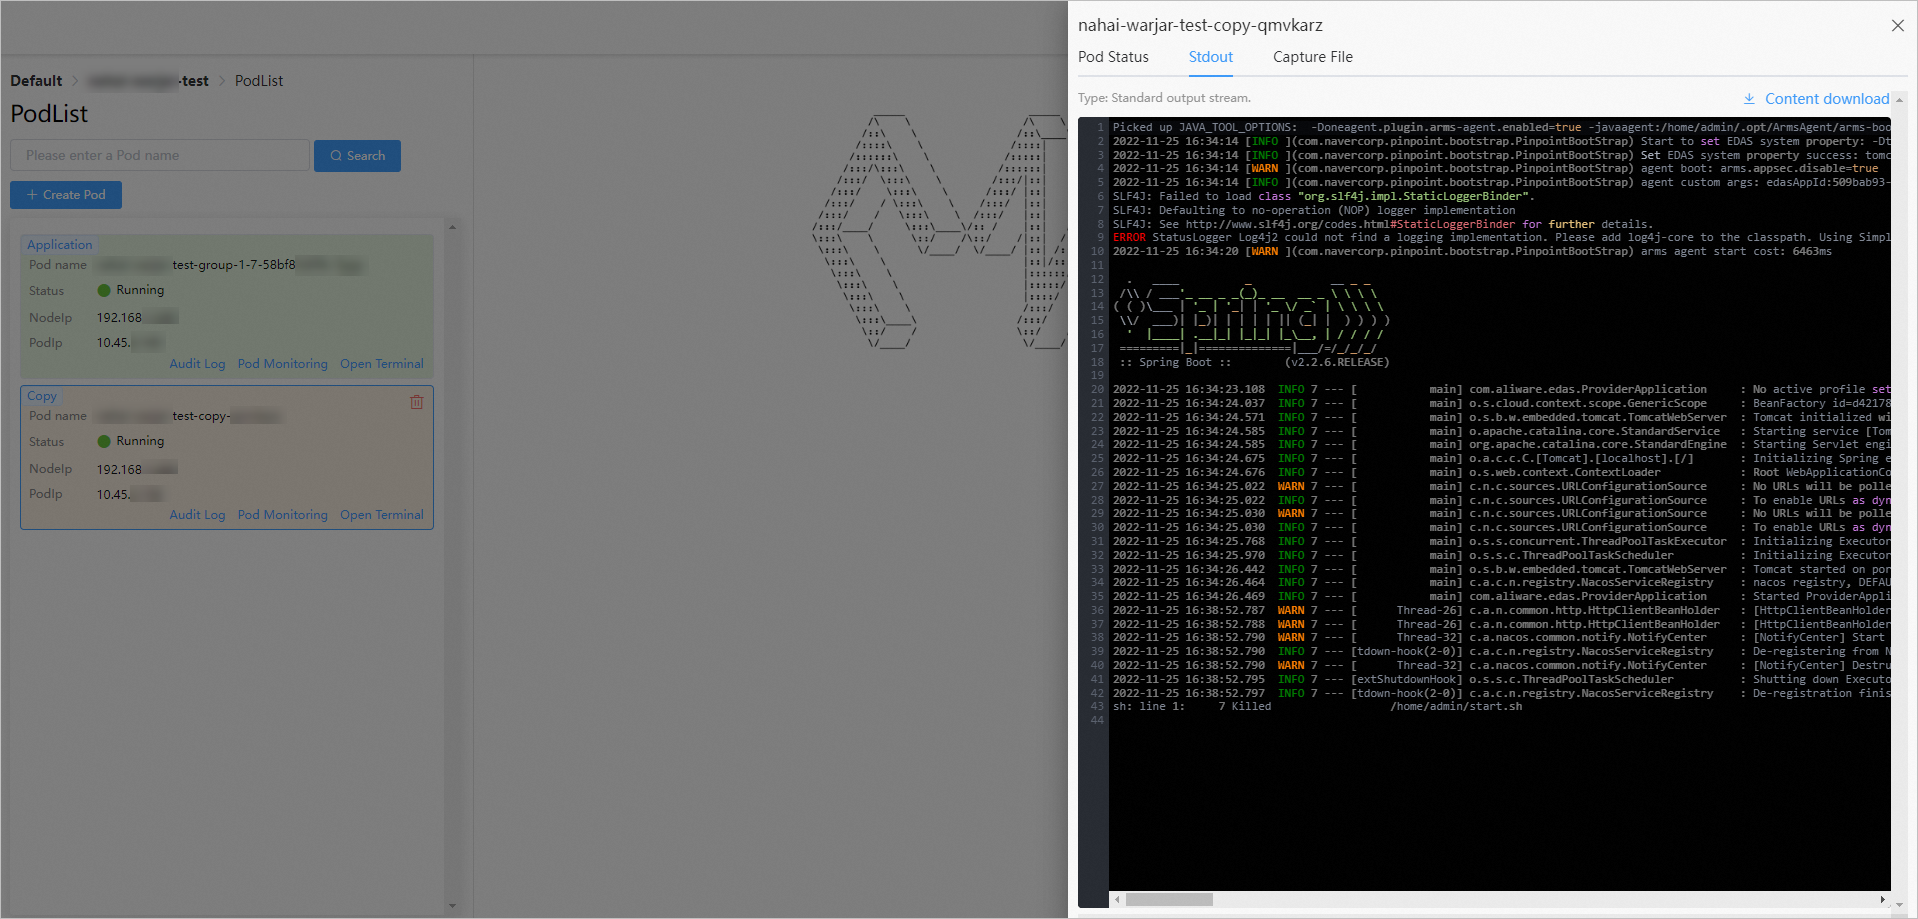
- In the panel that appears, click Stdout to view the standard output log of the pod and click Content download to download the log.
To view and download log files in a pod, perform the following operations:
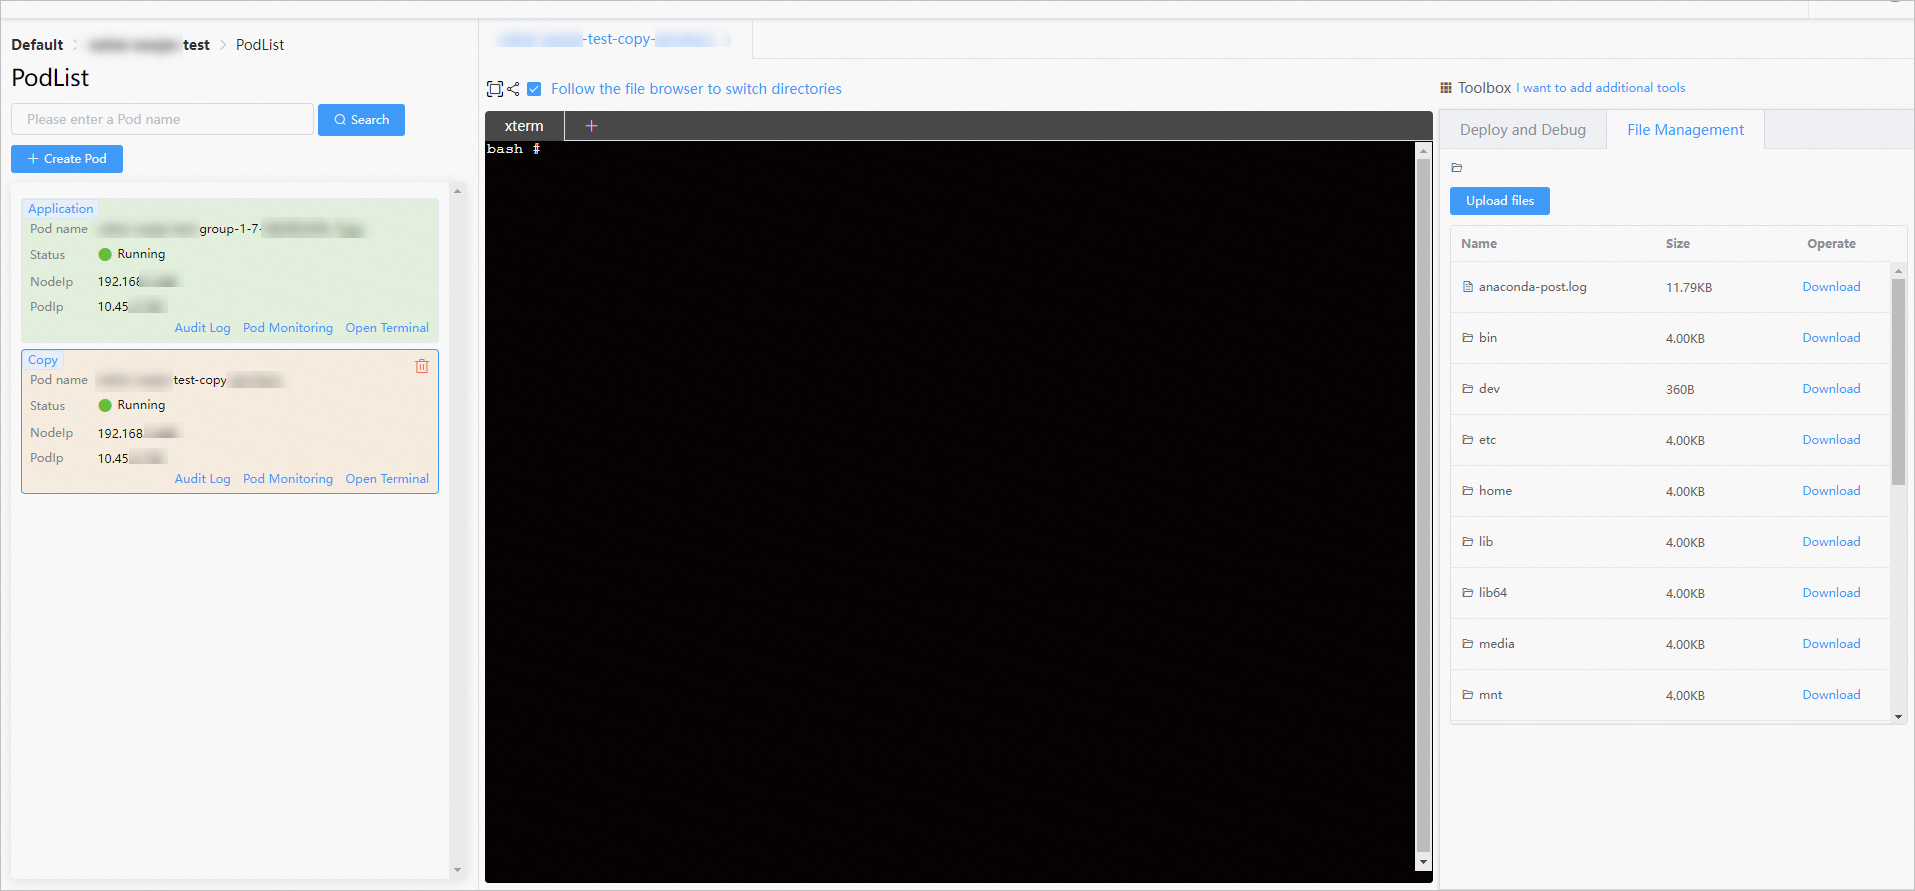
- On the PodList page, click Open Terminal under the desired pod.
- In the upper-right corner of the page that appears, click the File Management tab, and then click Download in the Operate column to view and download desired files in the pod.
Audit commands in the terminal
CNKIT allows you to use the terminal to audit commands. To view the details about the commands that were executed, perform the following operations:
-
Log on to the EDAS consoleEDAS console.
-
In the left-side navigation pane, choose . In the top navigation bar, select a region. In the upper part of the Applications page, select a microservices namespace from the Microservices Namespace drop-down list. Then, click the name of the application that you want to manage.
- In the left-side navigation pane of the Application Overview page, click Cloud Native Toolbox.
- In the Step 3: Service access configuration section below Opening steps, click A key to access to go to the PodList page.
- On the PodList page, click Audit Log under the desired pod to view the details about the commands that were executed.

Develop and debug an application
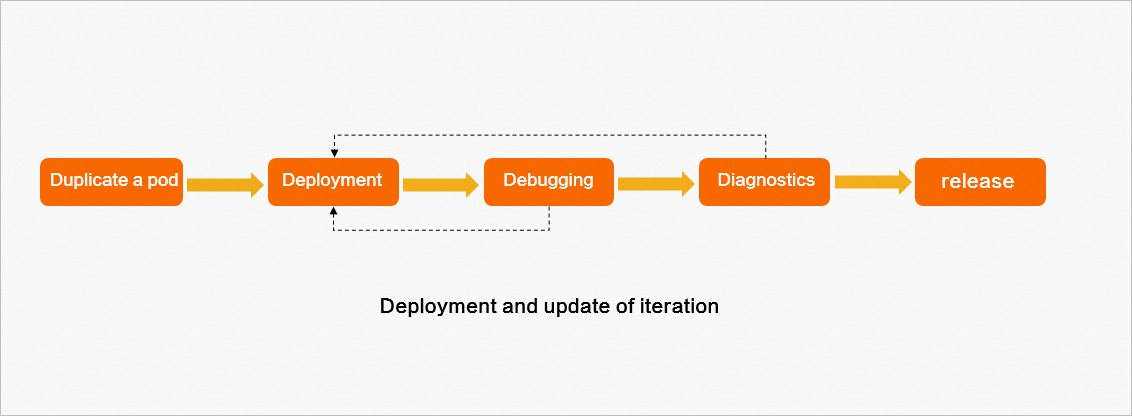
You can use CNKIT to create a temporary workspace, which is essentially a pod. You can develop, deploy, debug, and diagnose applications in this pod. After debugging, you can delete the temporary workspace with a few clicks. The following figure shows the entire process.
Duplicate a pod
Perform the following operations to duplicate a pod:
-
Log on to the EDAS consoleEDAS console.
-
In the left-side navigation pane, choose . In the top navigation bar, select a region. In the upper part of the Applications page, select a microservices namespace from the Microservices Namespace drop-down list. Then, click the name of the application that you want to manage.
- In the left-side navigation pane of the Application Overview page, click Cloud Native Toolbox.
- In the Step 3: Service access configuration section below Opening steps, click A key to access to go to the PodList page.
- On the PodList page, click Create Pod.
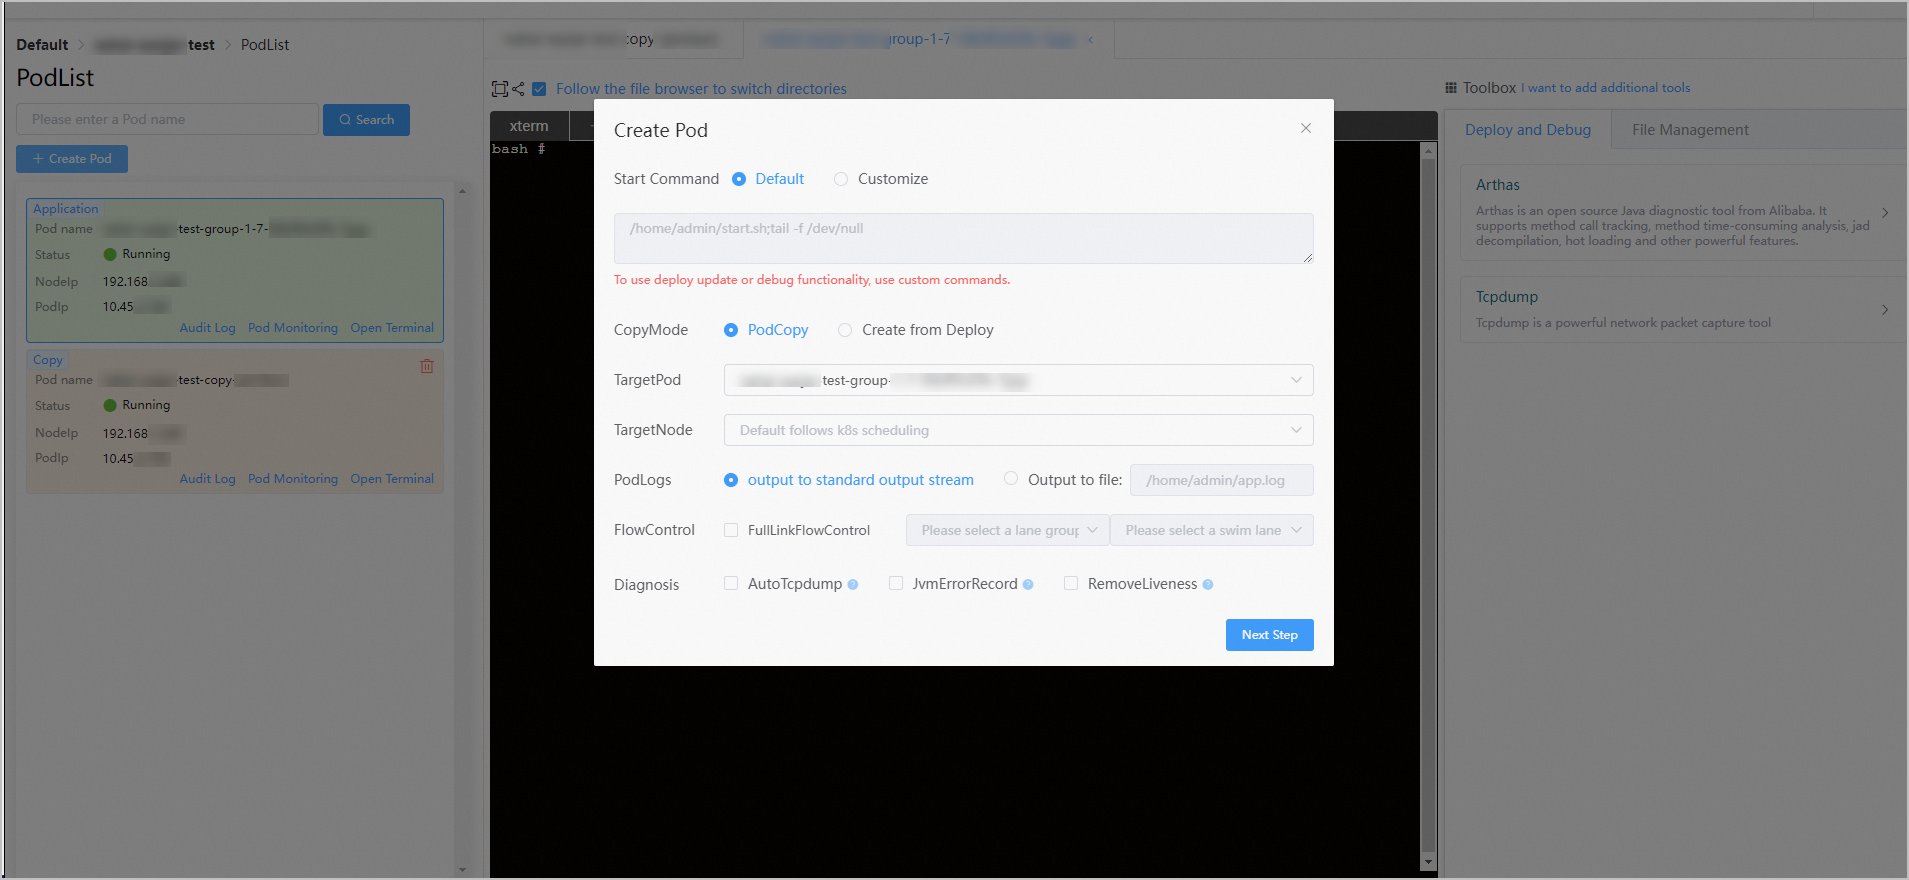
| Parameter | Description |
| Start Command | The command that starts the application in the pod. By default, use the startup command of the original image for this parameter. If you want to use iterative deployment or enable debugging for the application, you must specify a custom startup command. This is because the startup command of the original image uses the application process as the first process. After the application exits or restarts, the pod is released. Therefore, you need to set a different startup command to prevent the pod from being released when the application exits. |
| CopyMode | You can duplicate an existing pod or create a pod by using the spec of a Deployment. |
| TargetNode | The cluster node on which the pod runs. By default, the node on which a pod runs is selected according to the Kubernetes scheduling rule. You can also directly specify a cluster node to run the pod. |
| PodLogs | Valid values: output to standard output stream and Output to file. |
| FlowControl | You can use the end-to-end throttling feature to admit only requests that meet specific rules into the pod node. |
| Diagnosis | You can choose to run tcpdump to monitor traffic, enable the recording of Java Virtual Machine (JVM) errors, and remove the Liveness probe during application startup. |
Deploy an application
In pods that are created by using CNKIT, you can deploy application packages in the EDAS console or IntelliJ IDEA.
Deploy an application in the EDAS console
Perform the following operations to upload an application package to a pod and deploy the application:
-
Log on to the EDAS consoleEDAS console.
-
In the left-side navigation pane, choose . In the top navigation bar, select a region. In the upper part of the Applications page, select a microservices namespace from the Microservices Namespace drop-down list. Then, click the name of the application that you want to manage.
- In the left-side navigation pane of the Application Overview page, click Cloud Native Toolbox.
- In the Step 3: Service access configuration section below Opening steps, click A key to access to go to the PodList page.
- On the PodList page, click Open Terminal under the desired pod, and then click App Update on the Deploy and Debug tab.
- On the App Update tab, click Select File to select the file that you want to upload. Then, click Upload and Deploy to upload the package to the pod and deploy the application.

Deploy an application in IntelliJ IDEA
After you install Alibaba Cloud Toolkit in IntelliJ IDEA, you can create a CNKIT Deploy task to deploy the application.
- Start IntelliJ IDEA. Click
 in the upper-right corner and select Edit Configurations....
 - In the dialog box, click and choose . After you configure the parameters, click OK.
- After you save the configurations, click to deploy the application to the pod in IntelliJ IDEA.
 in the upper-right corner and select Edit Configurations....
  and choose
  to deploy the application to the pod in IntelliJ IDEA.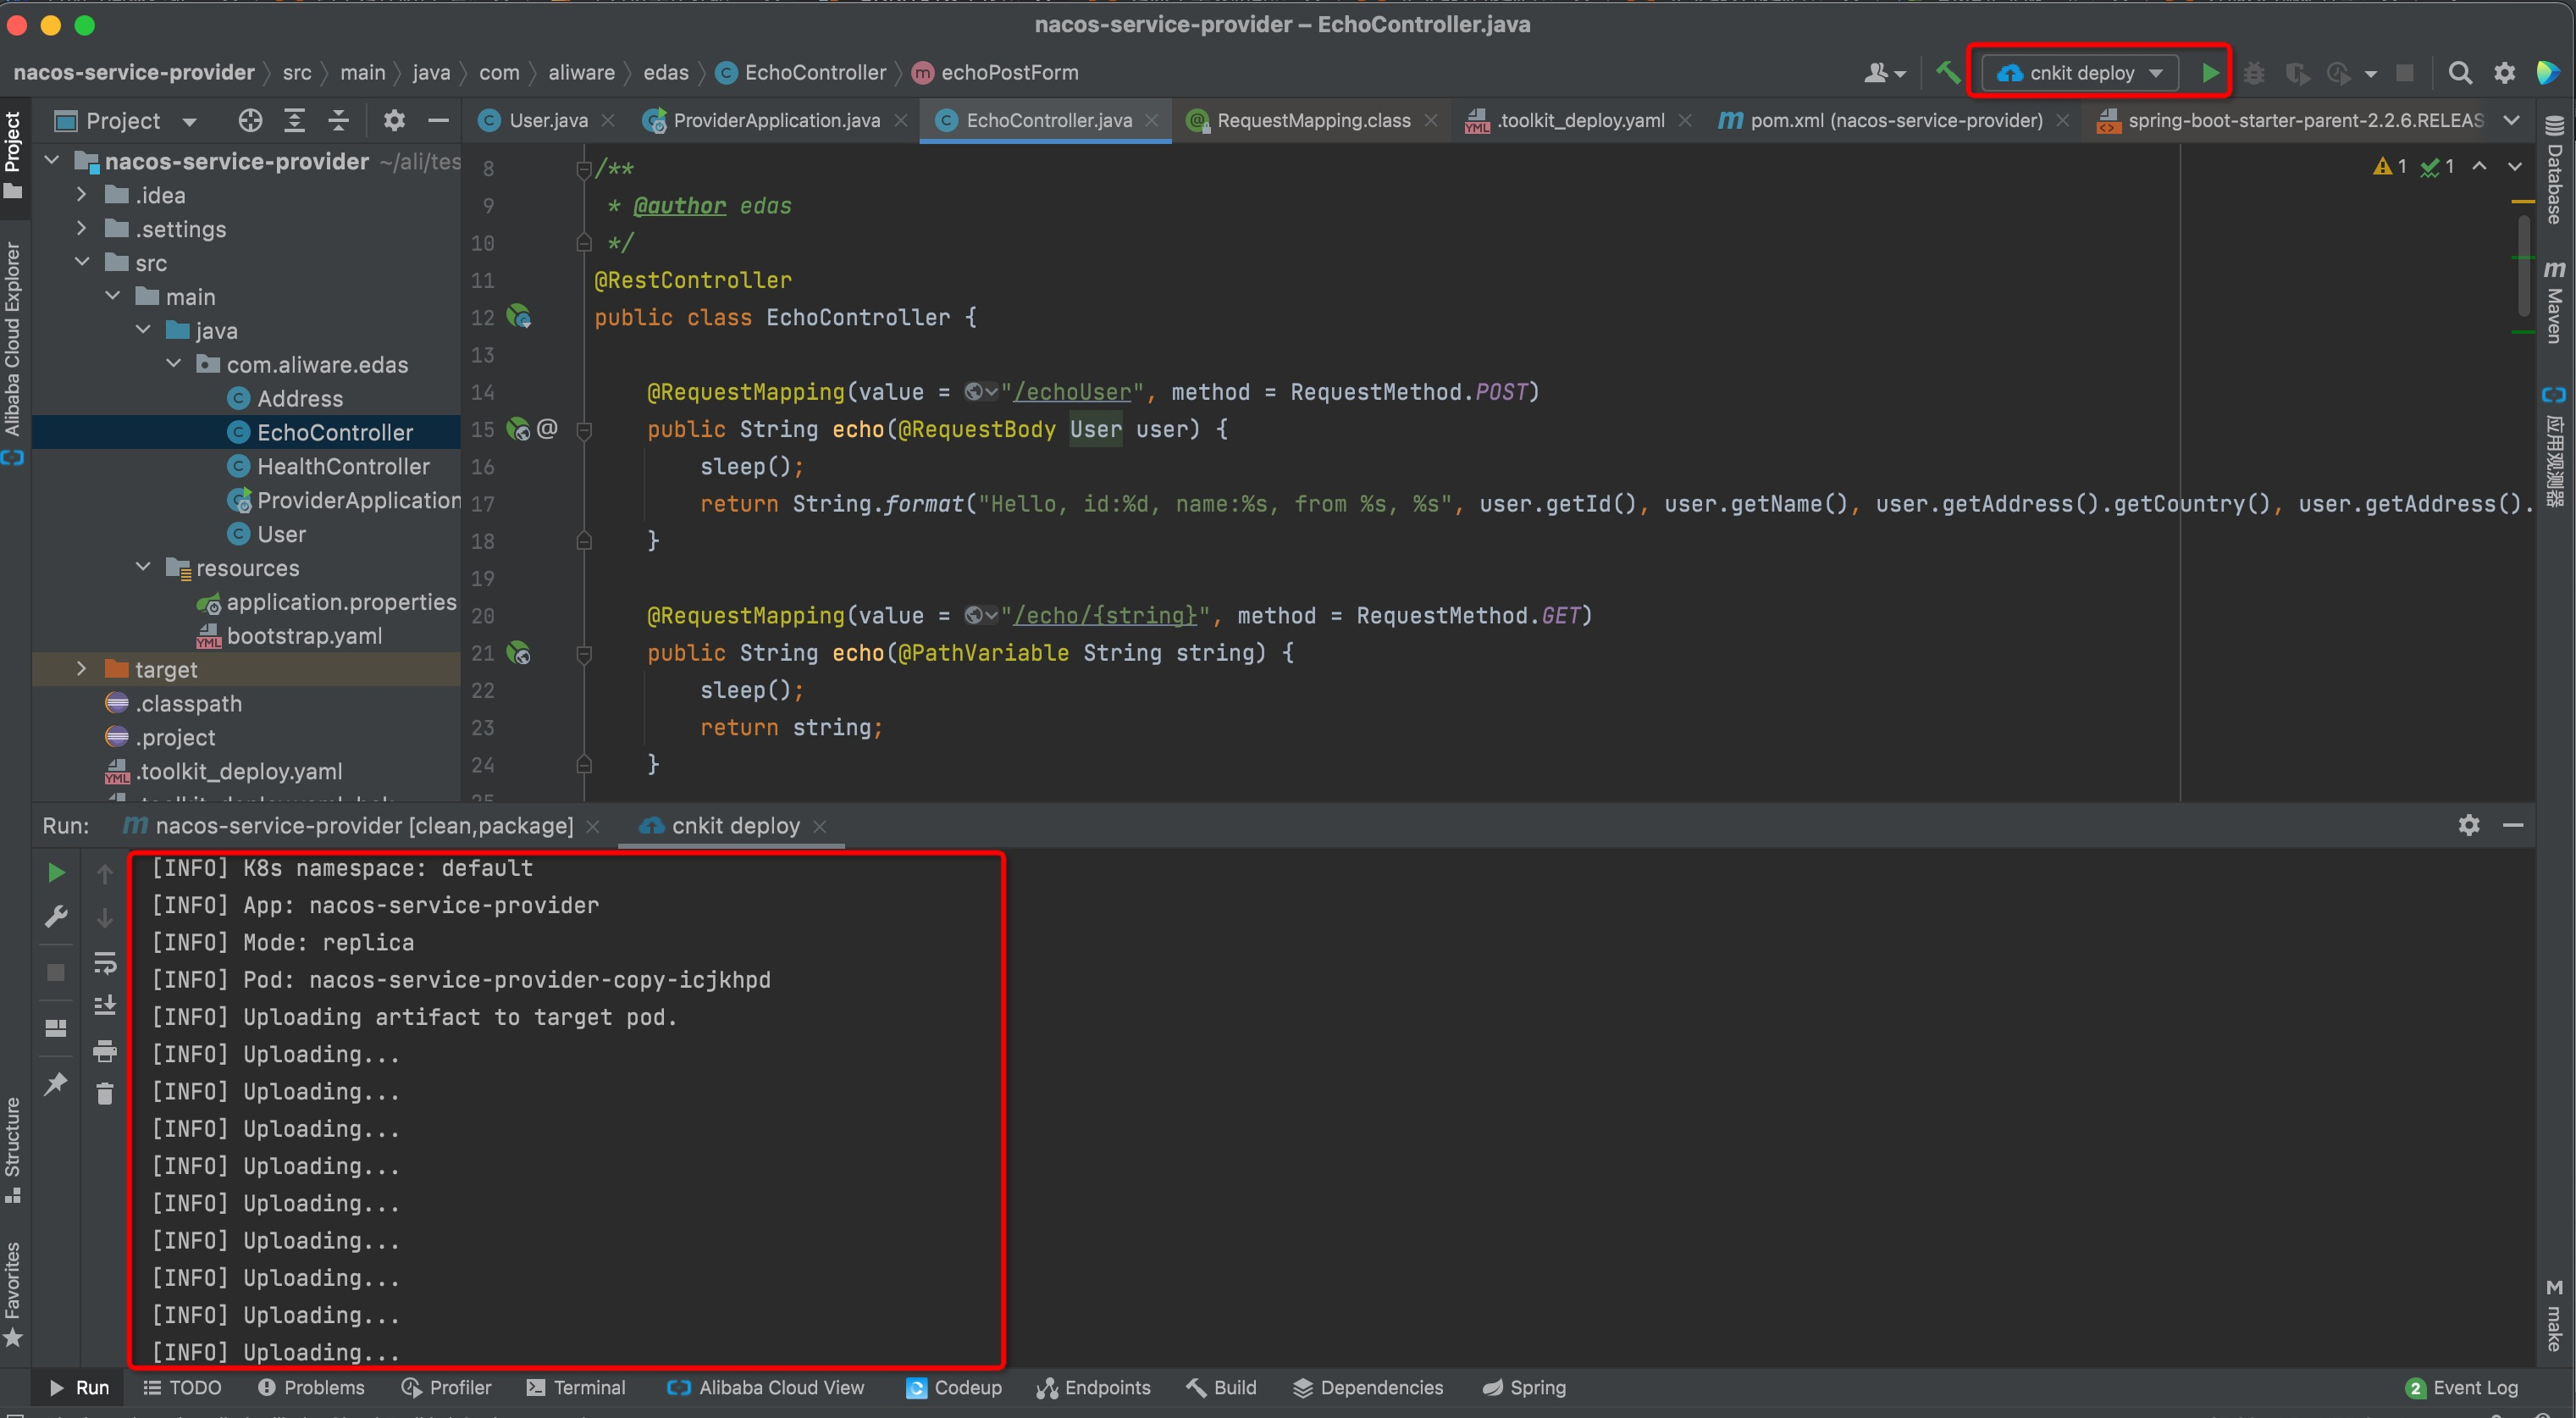
Debug an application
In a created pod, you can perform the following operations to enable the debugging port:
-
Log on to the EDAS consoleEDAS console.
-
In the left-side navigation pane, choose . In the top navigation bar, select a region. In the upper part of the Applications page, select a microservices namespace from the Microservices Namespace drop-down list. Then, click the name of the application that you want to manage.
- In the left-side navigation pane of the Application Overview page, click Cloud Native Toolbox.
- In the Step 3: Service access configuration section below Opening steps, click A key to access to go to the PodList page.
- On the PodList page, click Open Terminal under the desired pod, and then click Remote Debugging on the Deploy and Debug tab.
- On the Remote Debugging tab, click Enable Debugging.
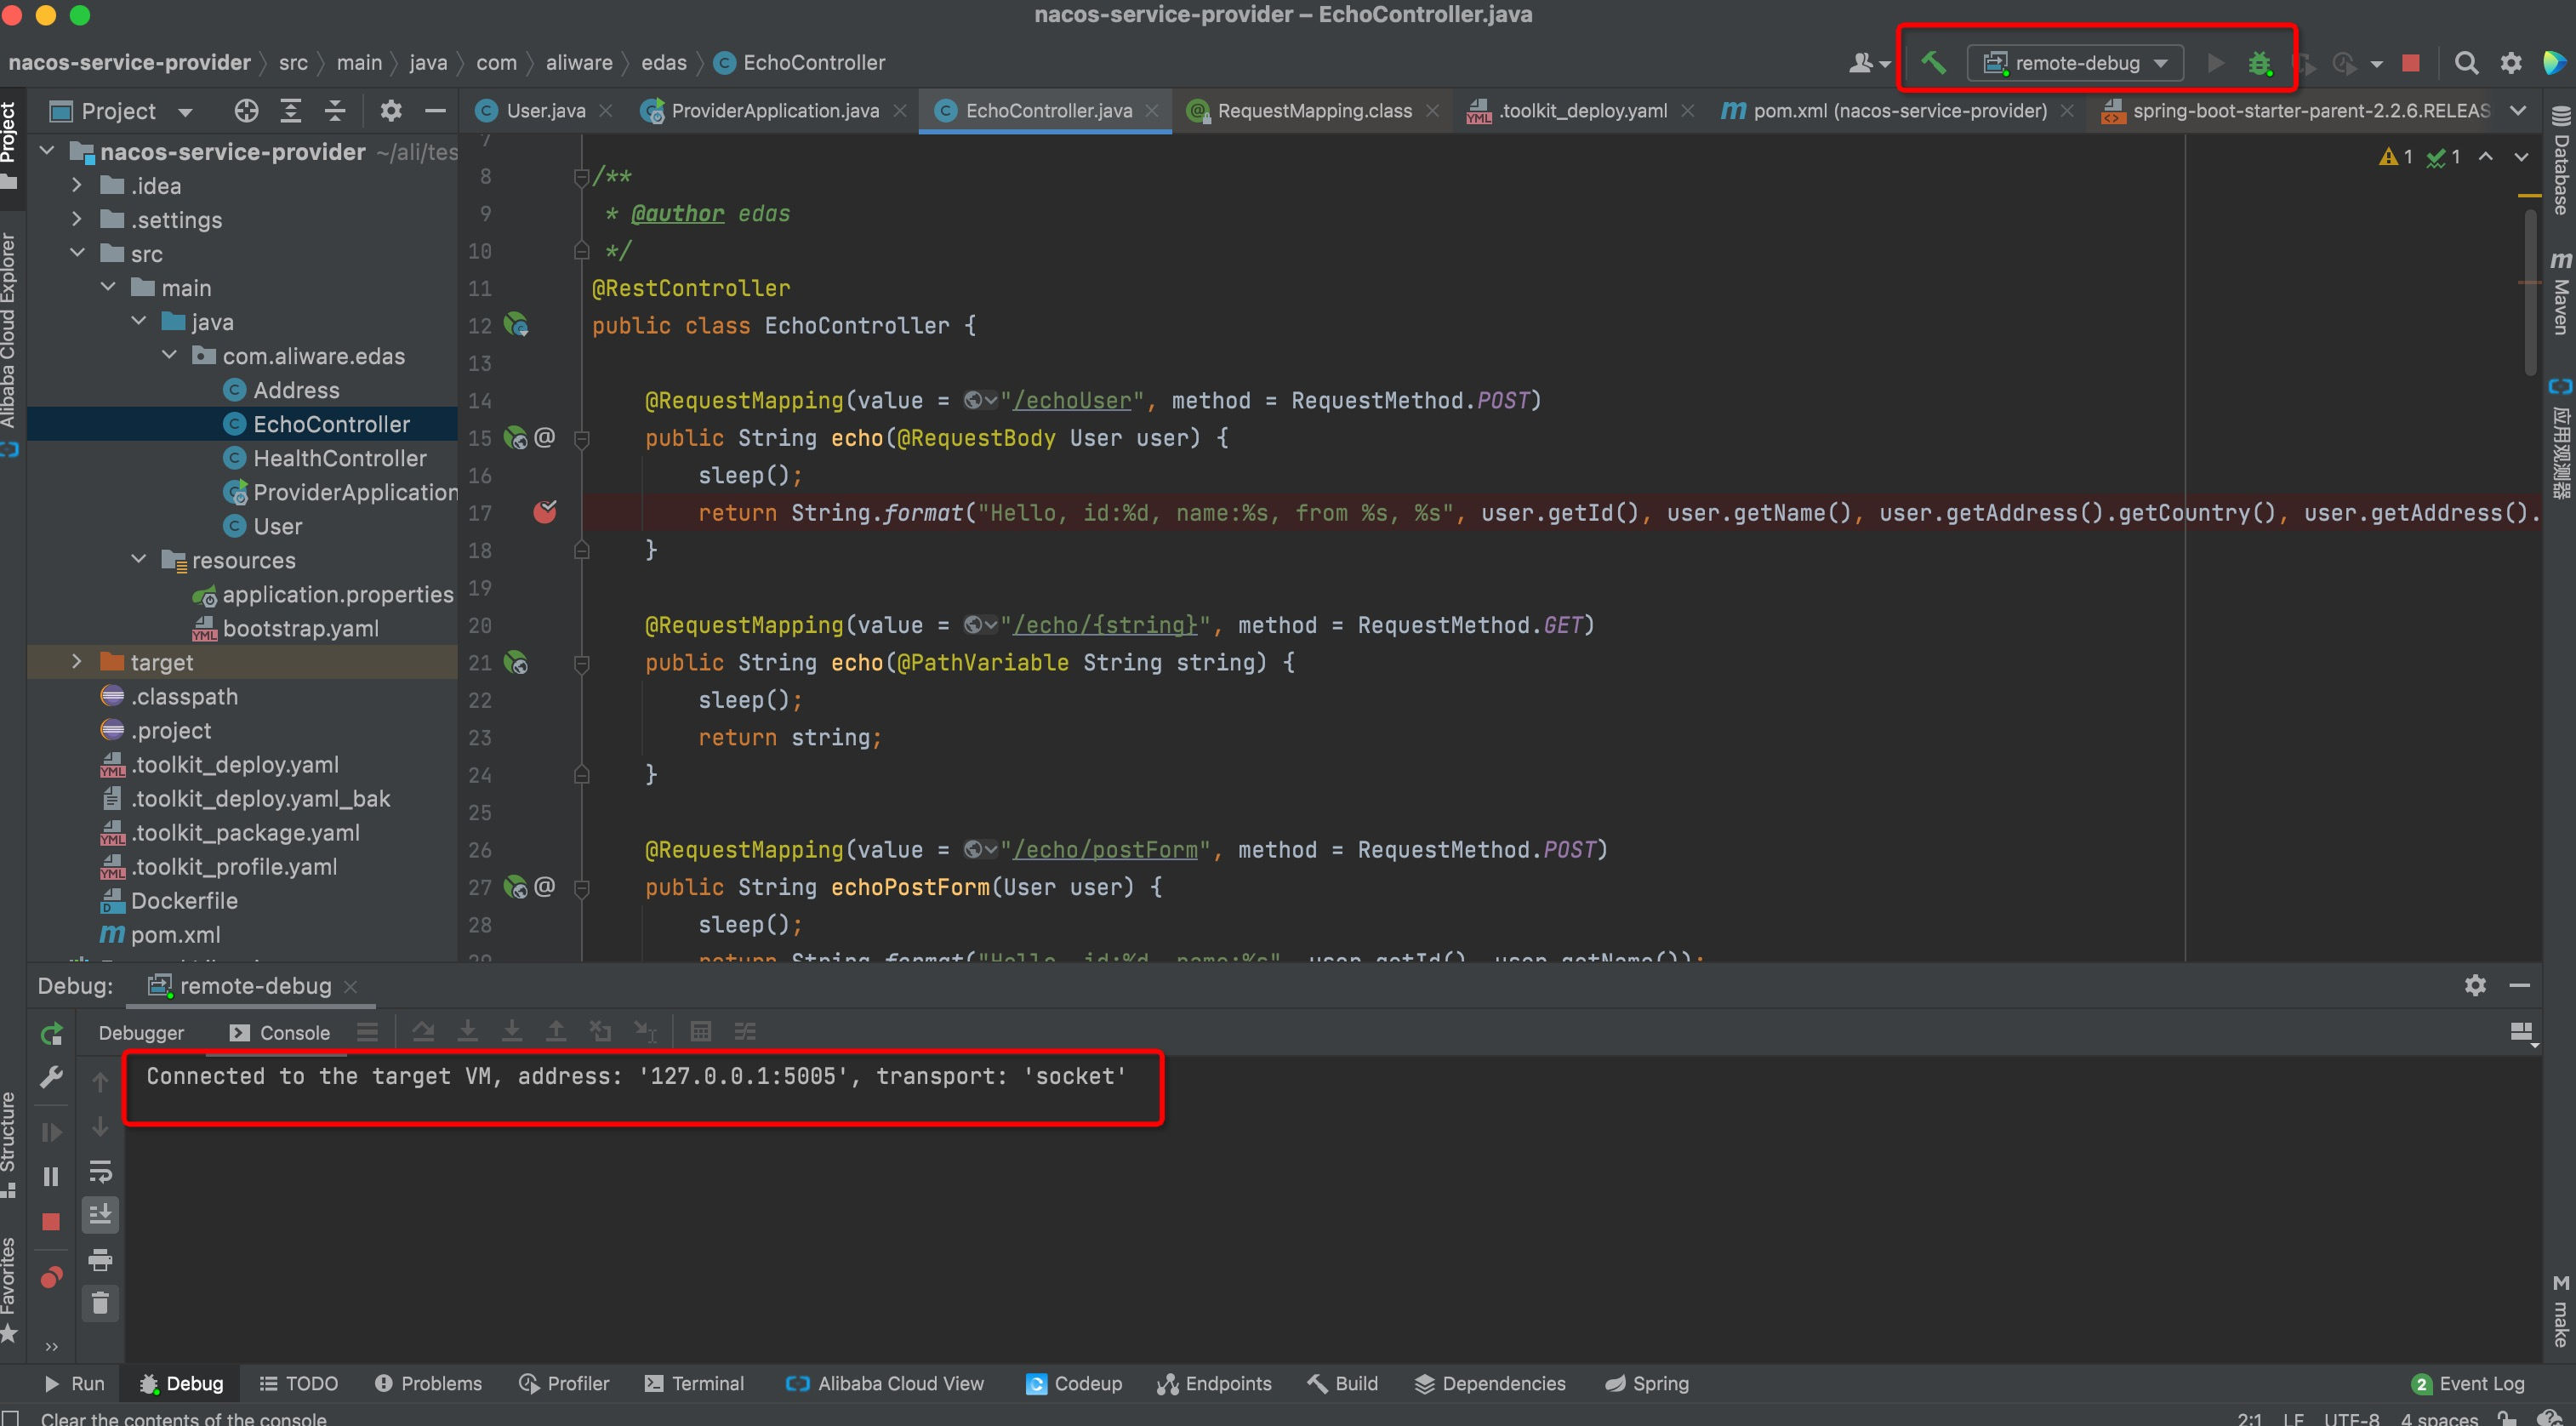
- Create Remote JVM Debug in IntelliJ IDEA and connect the local debugging port. (In this example, the port ID is 5005. You can connect IntelliJ IDEA to the application debugging port of the pod.)
- Start IntelliJ IDEA. Click in the upper-right corner and select Edit Configurations....
- In the dialog box, click and select Remote JVM Debug. After you configure the parameters, click OK.
- Start IntelliJ IDEA. Click
- Click to execute this configuration to perform remote debugging.


Diagnose application issues
CNKIT provides Kubernetes scheduling events, tcpdump, and Arthas to help you diagnose application issues.
-
Log on to the EDAS consoleEDAS console.
-
In the left-side navigation pane, choose . In the top navigation bar, select a region. In the upper part of the Applications page, select a microservices namespace from the Microservices Namespace drop-down list. Then, click the name of the application that you want to manage.
- In the left-side navigation pane of the Application Overview page, click Cloud Native Toolbox.
- In the Step 3: Service access configuration section below Opening steps, click A key to access to go to the PodList page.
- Use Kubernetes scheduling events, Arthas, and tcpdump to diagnose application issues.
- Kubernetes scheduling events
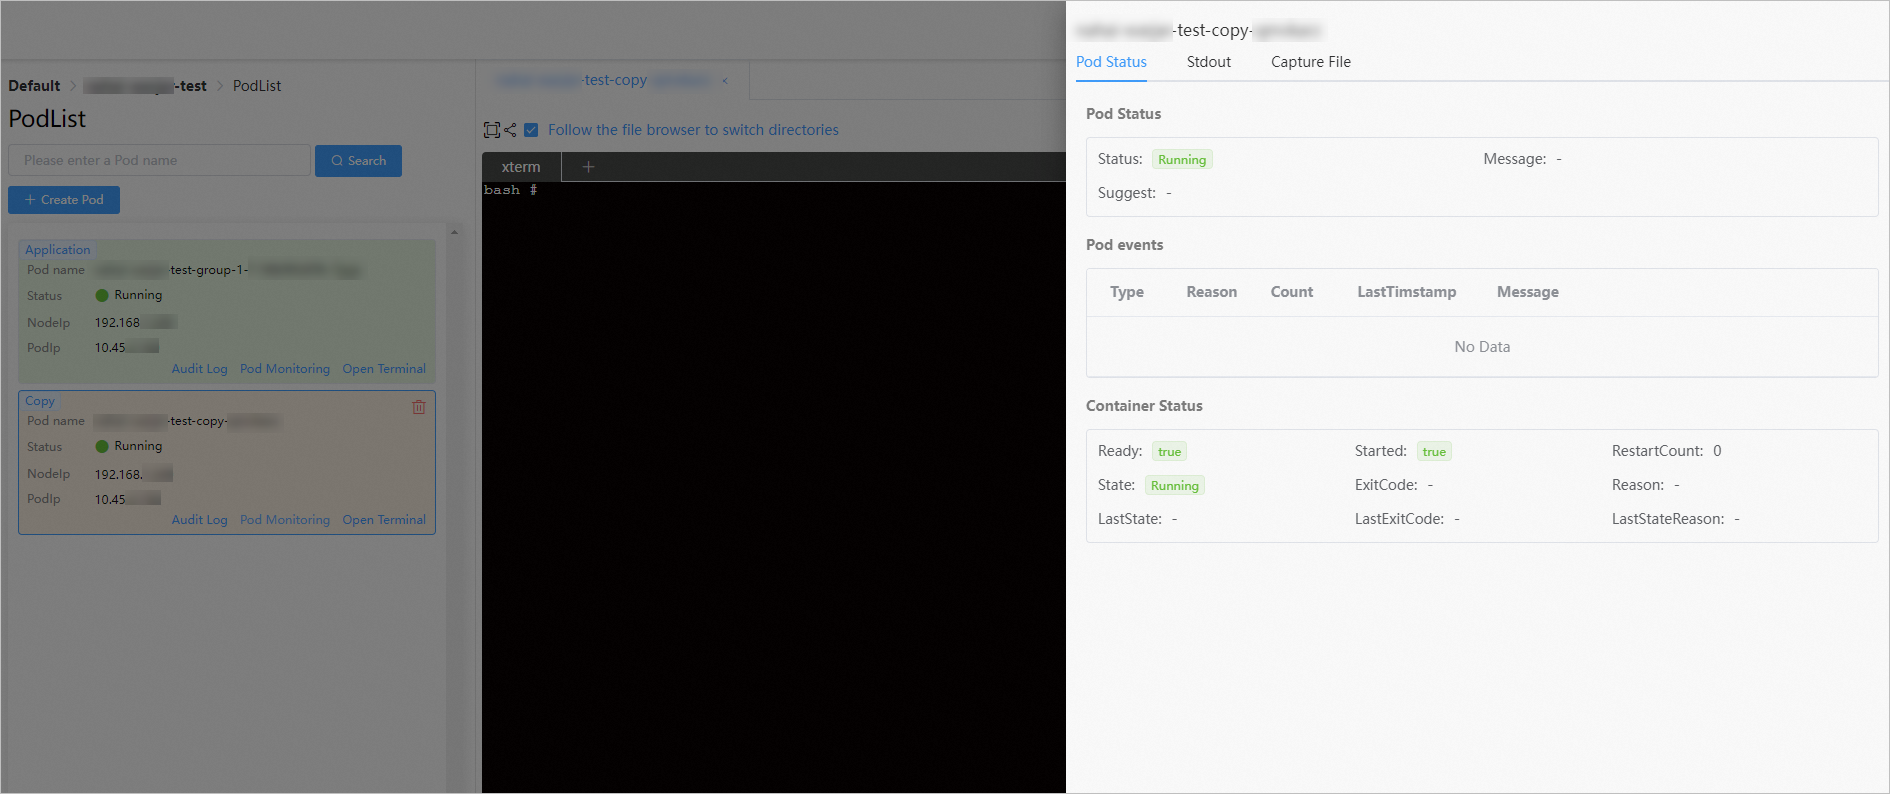
On the PodList page, click Pod Monitoring under the desired pod. On the Pod Status tab in the panel that appears, view Kubernetes scheduling events and the pod status.
- Arthas
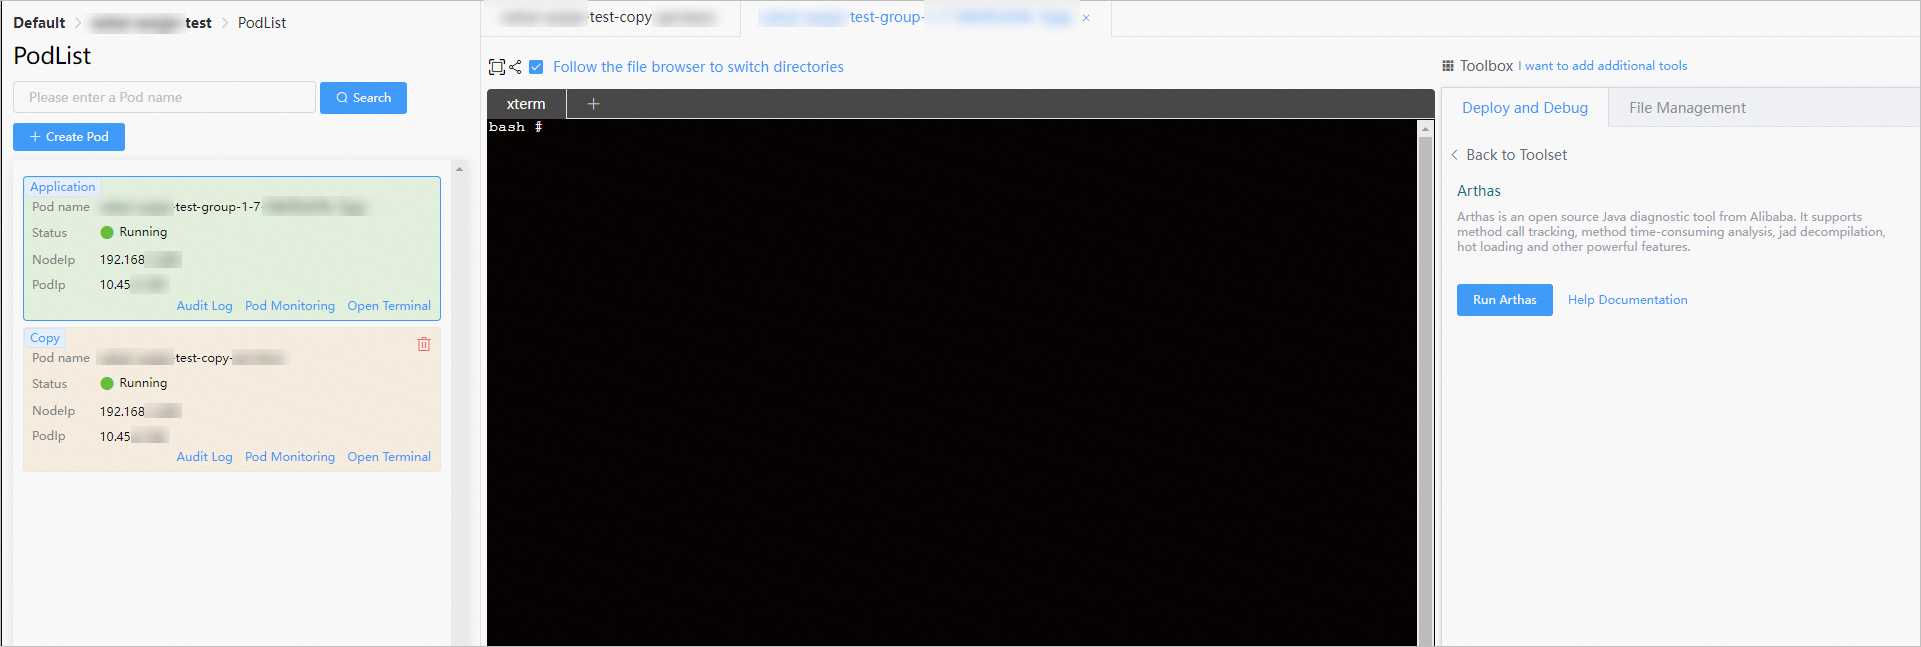
On the PodList page, click Open Terminal under the desired pod, click Arthas on the Deploy and Debug tab, and then click Run Arthas.
- tcpdump
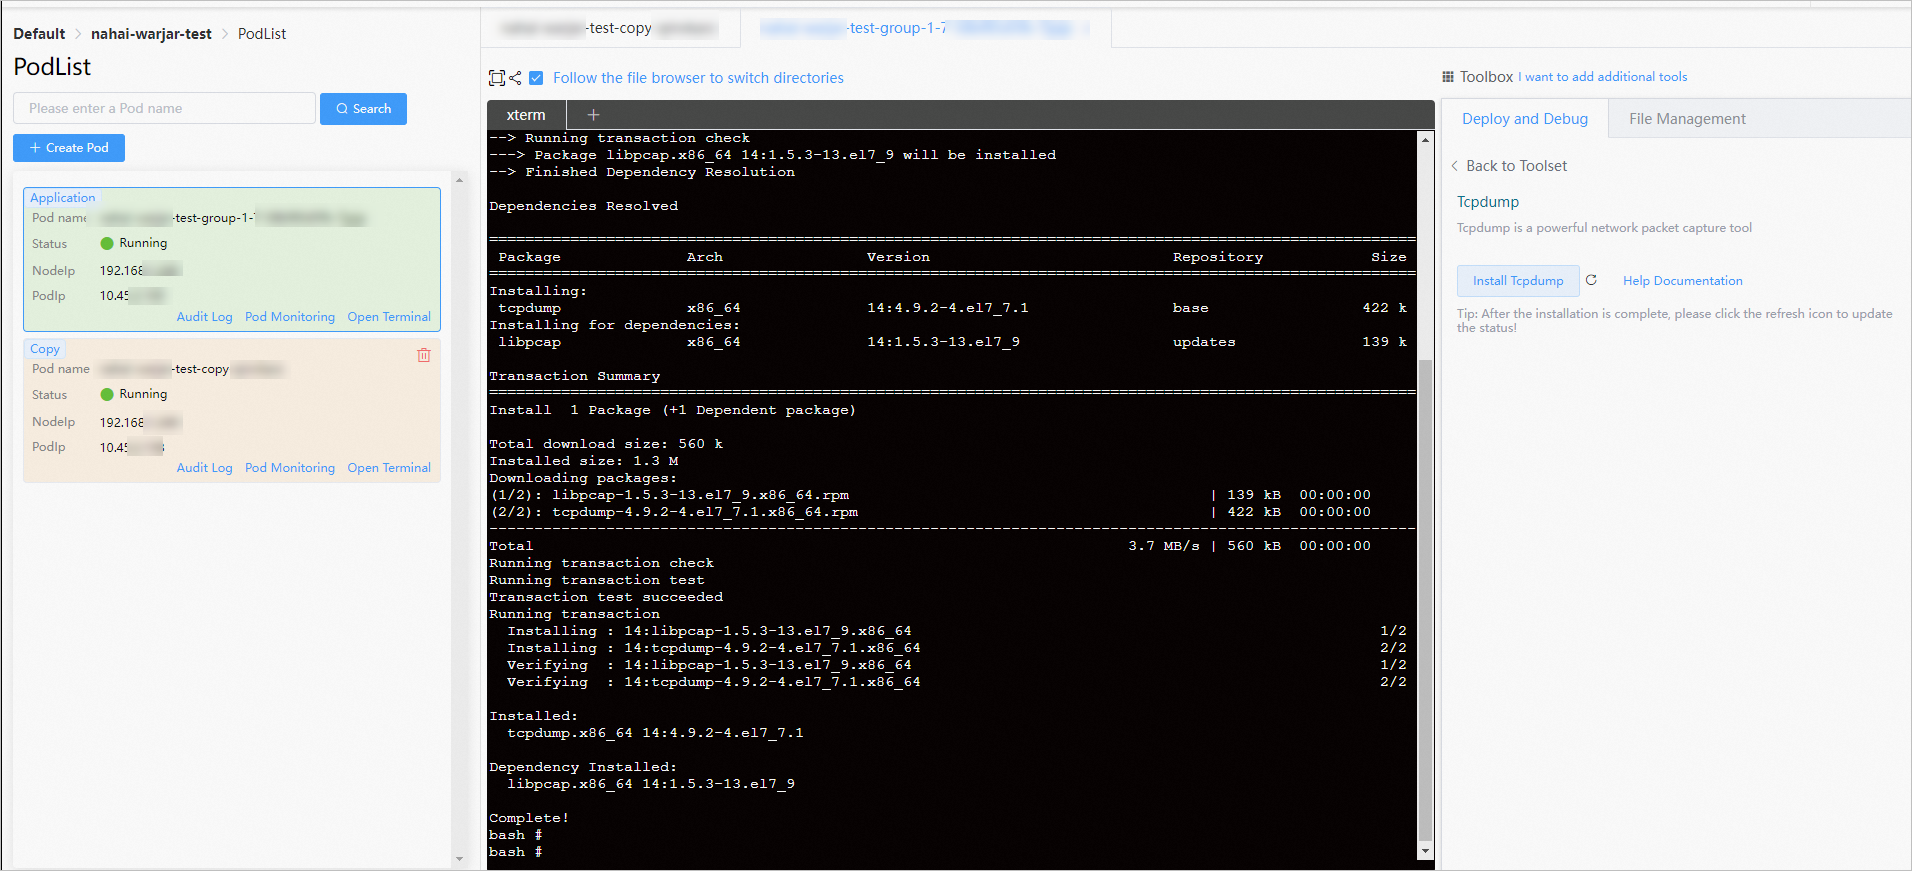
On the PodList page, click Open Terminal under the desired pod, click Tcpdump on the Deploy and Debug tab, and then click Install Tcpdump.
- Kubernetes scheduling events