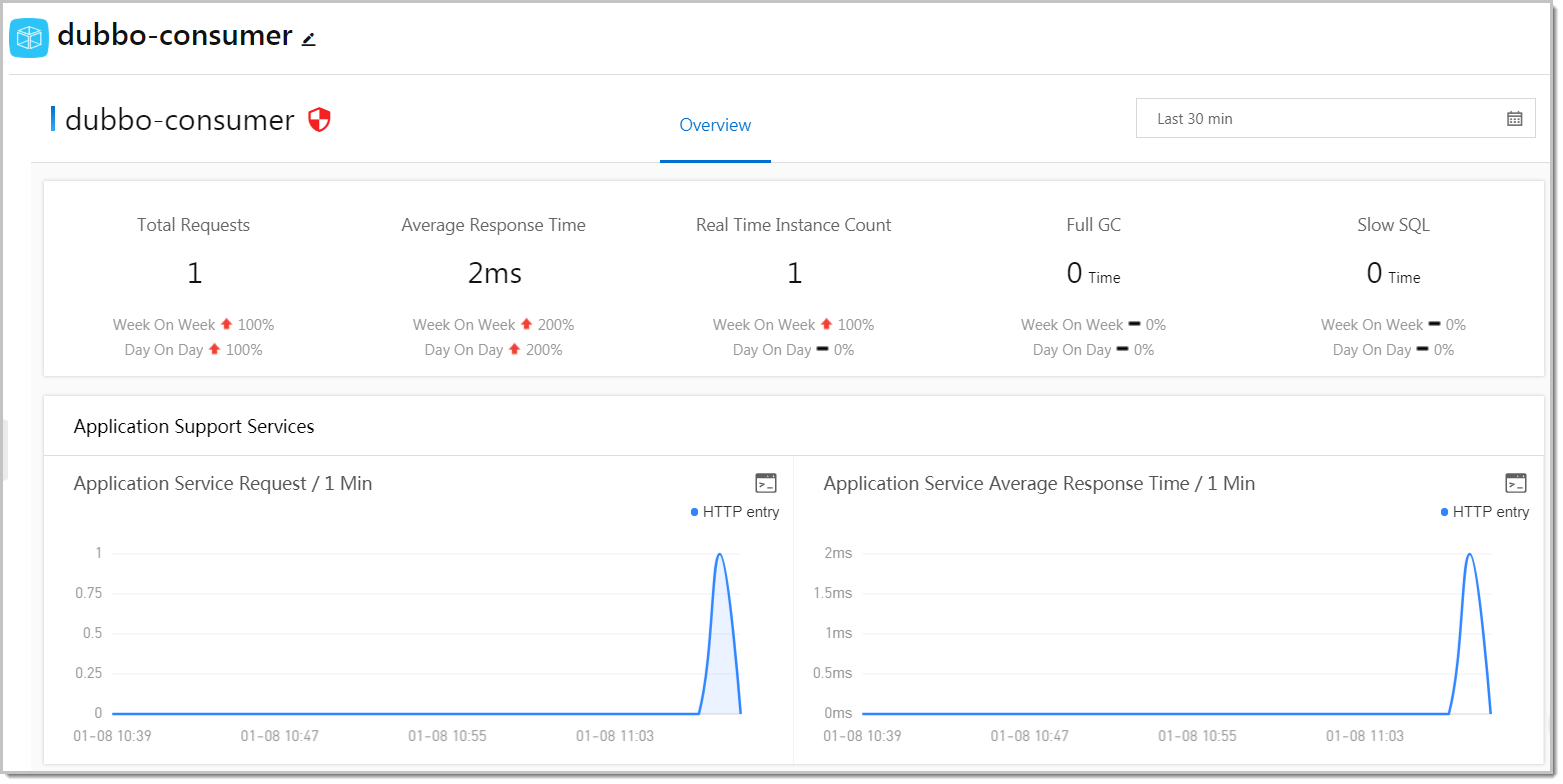
On the Application Overview page, you can view the key metrics of an application. This helps you check the status of your application.
Procedure
Log on to the Enterprise Distributed Application Service (EDAS) console. In the left-side navigation pane, choose .
On the Applications page, click an application. On the page that appears, choose in the left-side navigation pane.
Overview tab
On the Overview tab, you can view the following performance metrics:
Total Requests, Average Response Time, Instance Count, Full GC, and Slow SQL. You can also check how the values of these metrics have changed since the last week or last day on this tab.
Application Events: application events, such as 0-1 alerts, application monitoring alerts, and Kubernetes cluster events.
Application Support Services: time series curves for the number of requests to the services provided by the application and average response time.
Application Dependent Services: time series curves for the number of requests to the dependent services, average response time, number of instances within the application, and HTTP status codes.
System Info: time series curves for CPU utilization, memory usage, and load.