This topic describes the cluster inspection feature for Kubernetes (K8s) clusters in Enterprise Distributed Application Service (EDAS). You can learn how to manually trigger inspections, set up automatic periodic inspections, and view and download inspection reports.
Features
The cluster inspection feature includes the following:
You can manually trigger inspection tasks.
You can set up automatic periodic inspection tasks. The inspection schedule is controlled globally for each region.
You can download inspection reports for production applications that are managed by EDAS. These reports analyze application monitoring data to provide a comprehensive overview of your system's health. They help you identify potential risks and incorrect configurations, and offer suggestions for improvement to maintain system stability.
To use the cluster inspection feature, a Resource Access Management (RAM) user must be granted the View Namespace, View Cluster, and Cluster Management permissions. For more information, see Access policies.
Manually trigger an inspection task
Log on to the EDAS console.
In the left navigation pane, choose Resource Management > Cluster Inspection.
On the Cluster Inspection page, click Execute Inspection. In the Create Inspection Task window, select the cluster to inspect and click OK.
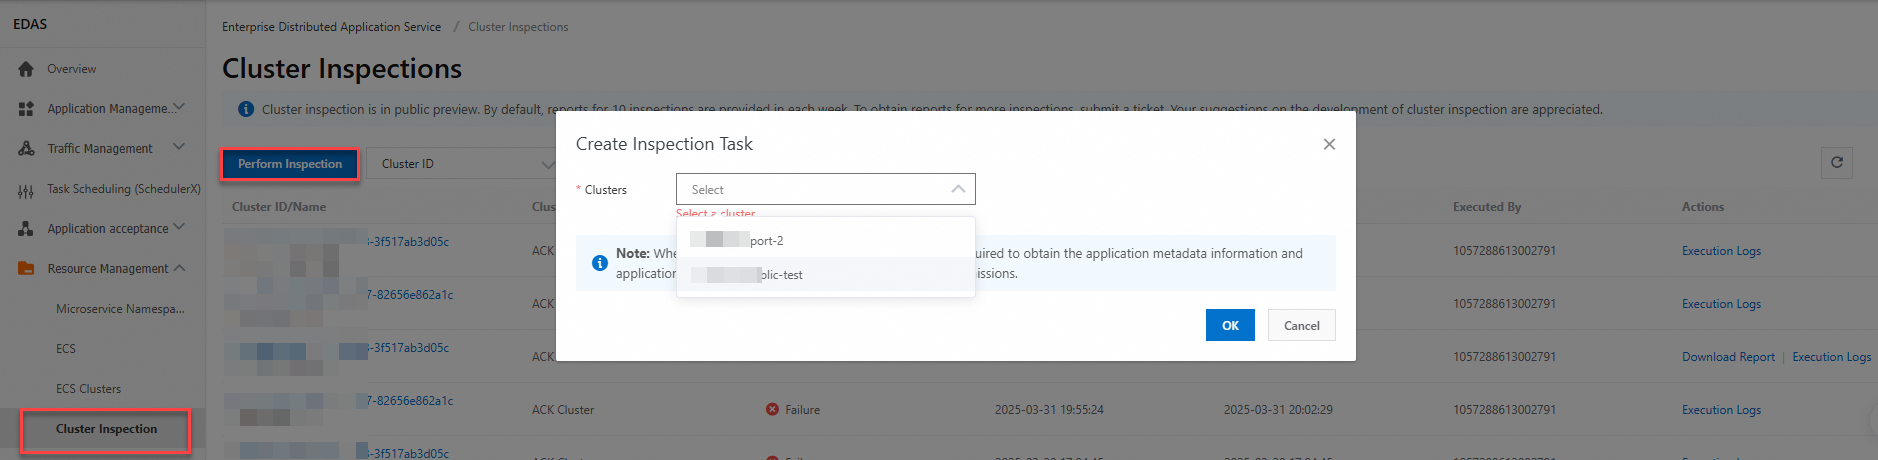
Running an inspection task requires permissions to read application metadata and application monitoring information. You must confirm the authorization before the inspection can start.
Only one inspection task can be in progress for each cluster at a time.
Only healthy K8s clusters that are imported into EDAS can be inspected.
You can run up to 10 inspection tasks per week. This count includes successful and manually canceled tasks. Failed tasks are not included in this count.
Set up automatic periodic inspection tasks
Log on to the EDAS console.
In the left navigation pane, choose Resource Management > Cluster Inspection.
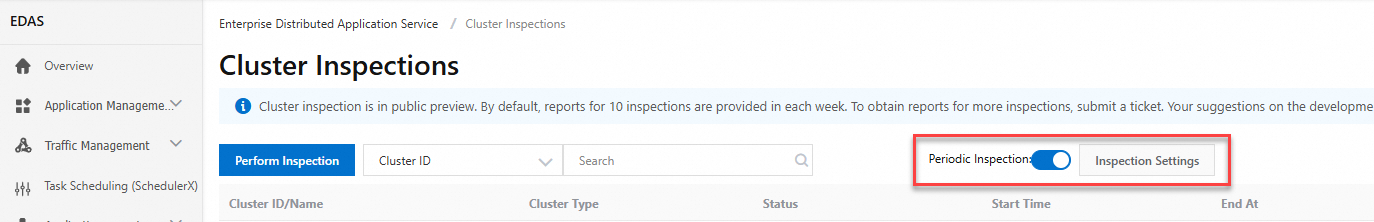
On the Cluster Inspection page, turn on the Periodic Inspection switch, and then click Inspection Settings to configure the task.
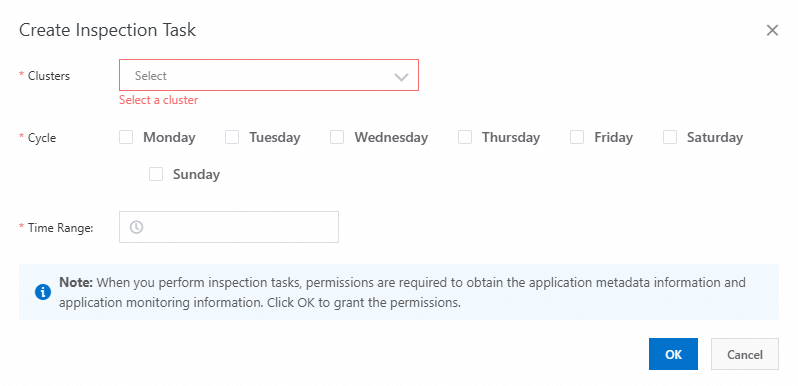
In the Create Inspection Task window, select the Cluster, set the Period and Time Range, and then click OK.
View inspection records and logs
Log on to the EDAS console.
In the navigation pane on the left, choose Resource Management > Cluster Inspection.
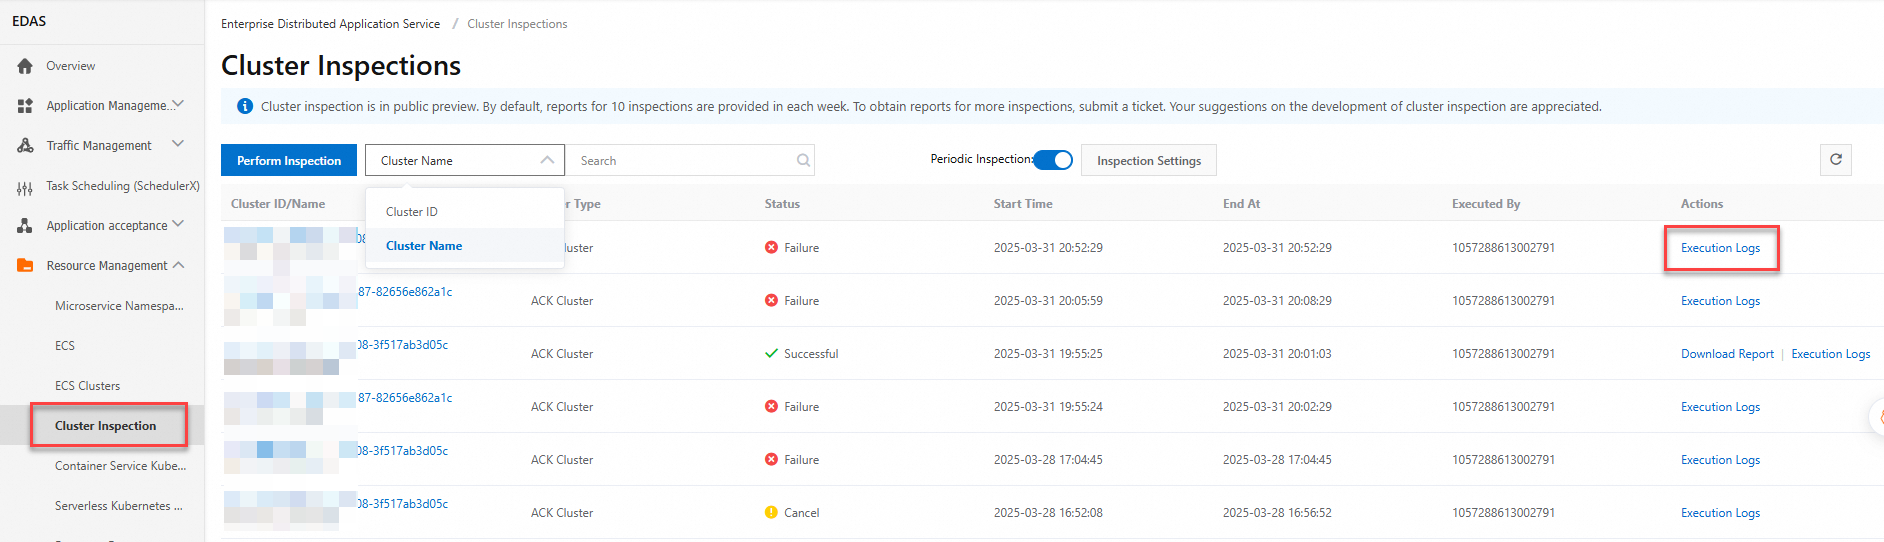
On the Cluster Inspection page, you can view the records for current cluster inspection tasks. These records include information such as Status (Successful, Canceled, or Failed), Start Time, End Time, and Executor. In the search box, you can perform a fuzzy search by Cluster ID or Cluster Name.
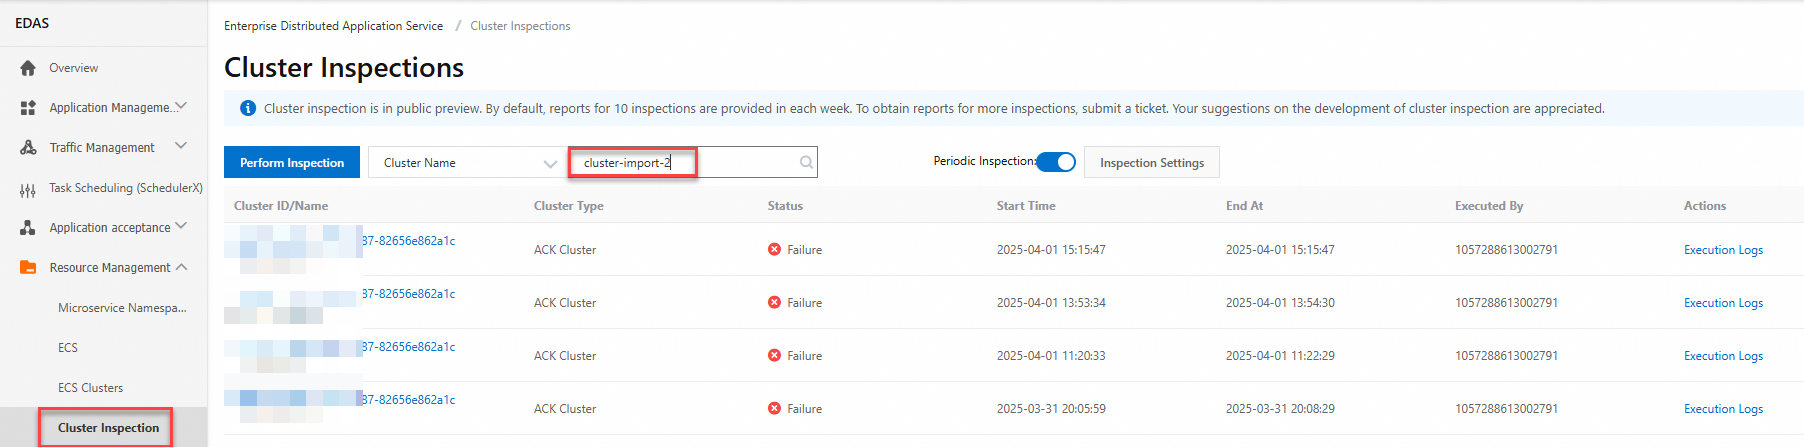
On the Cluster Inspection page, find the target inspection record and click Execution Log in the Operation column to view the log.
View and download inspection reports
Log on to the EDAS console.
In the navigation pane on the left, choose Resource Management > Cluster Inspection.
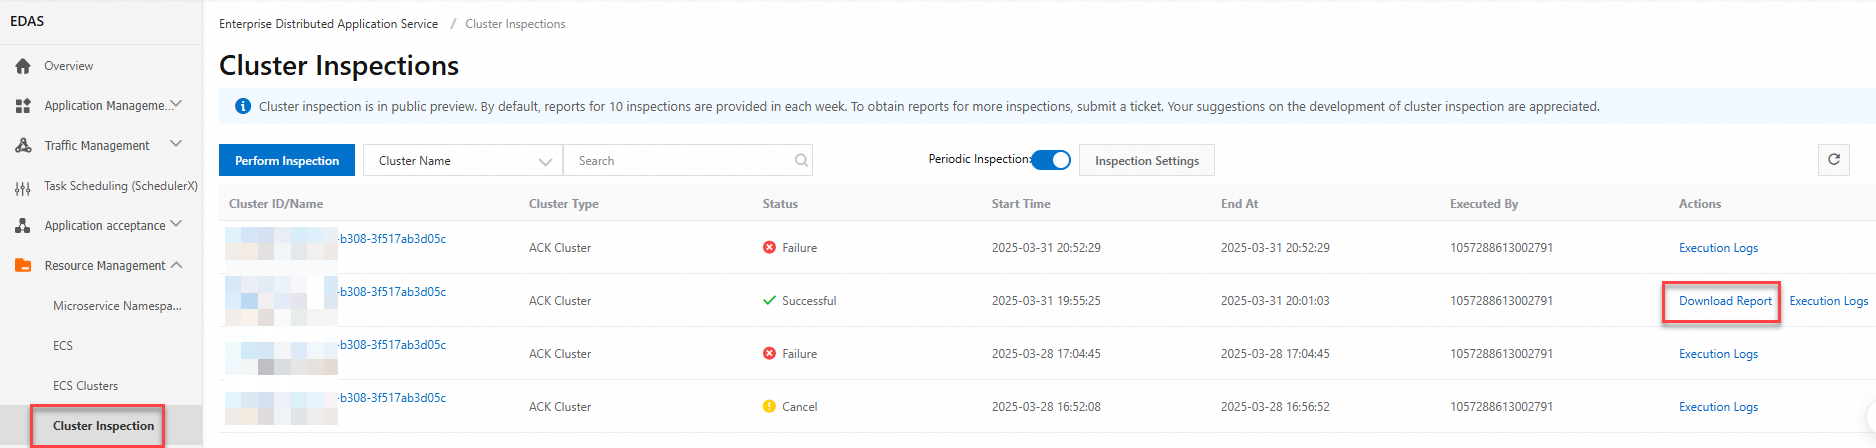
On the Cluster Inspection page, find the target inspection record and click Download Report in the Operation column.

For more information about application anomaly detection rules, see Application anomaly detection rules.
Ensure that the selected cluster and inspection settings are suitable for your scenario. If you encounter any issues, contact technical support for assistance.