This topic shows you how to view the exception analysis of an application.
Application limits
EDAS Standard Edition does not support exception analysis. This feature is available in the Professional and Platinum editions.
Feature entry point
-
Log on to the EDAS consoleEDAS console.
In the left-side navigation pane, choose Application Management > Applications. In the top navigation bar, select a region. In the upper part of the page, select a microservice namespace. From the Cluster Type drop-down list, select Kubernetes Cluster. Then, find the application that you want to manage and click the name in the Application Name column.
In the left-side navigation pane of the application details page, choose .
On the Instance Monitoring page, select a node from the pane on the left. Then, click the Exception Analysis tab on the right.
Exception statistics
Exception Statistics section displays a stacked column chart and a list of exceptions for the application within a specified time range.
Optional:In the Exception Statistics section, perform the following operations:
Move the pointer over a chart and view the statistics.
Click the
 icon to view metric statistics during a selected time period or compare performance within the same period across different days.
Exception list
The exception list displays all exceptions that occurred in the application within a specified time range.
Optional:In the exception list, perform the following operations:
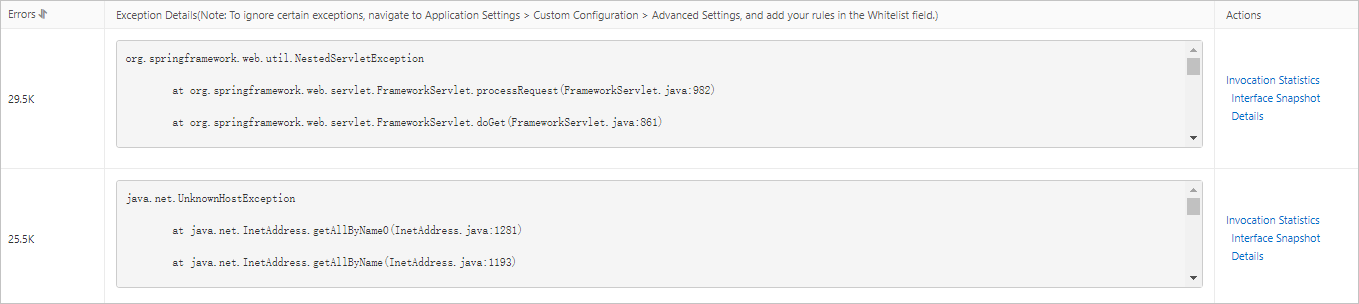
In the Operation column, click Call Statistics for an exception to view its stacked column chart.
In the Operation column, click Interface Snapshot for an exception to view its interface snapshot.
For more information about interface snapshots, see Trace query.
In the Operation column, click Details for an exception to view its detailed information.