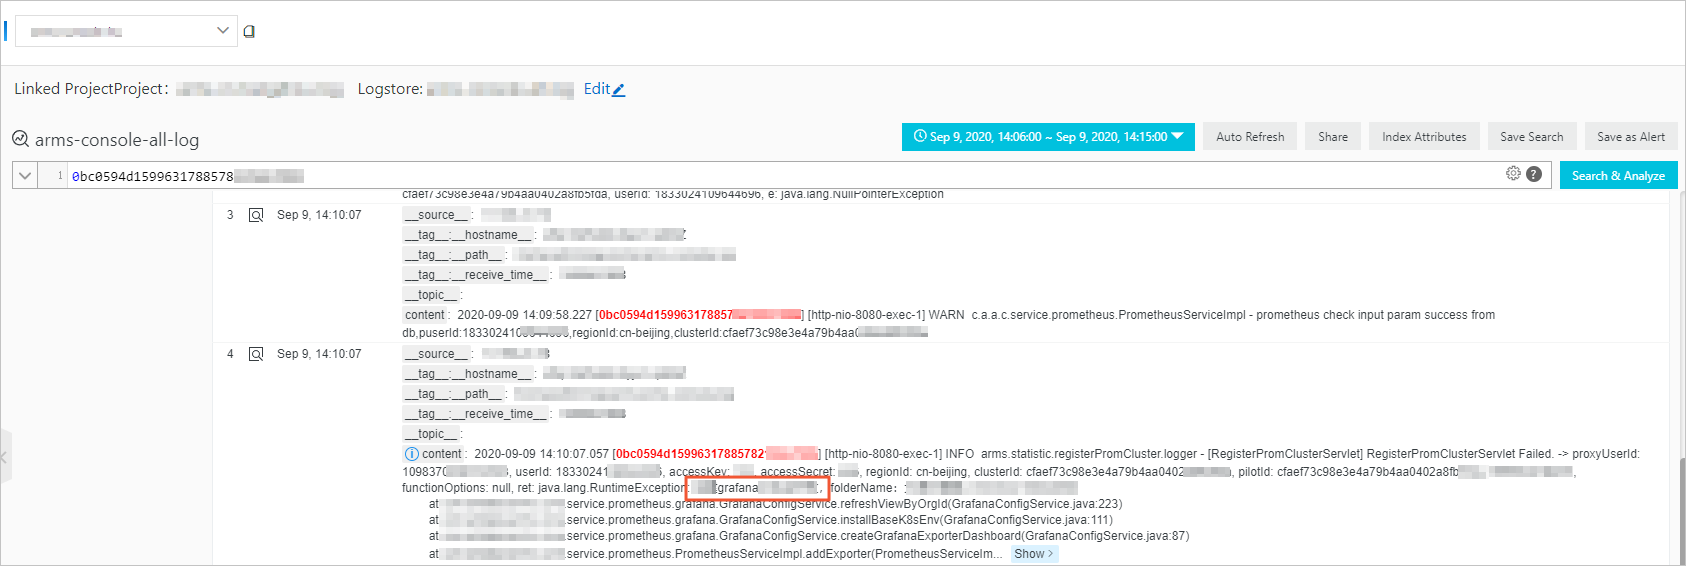
The log analysis feature allows you to use logs to accurately identify service exceptions that occur in your applications. With log-trace correlation enabled, you can search all log entries generated during a single request -- even when that request spans multiple services -- and pinpoint the exact location of a failure.
How it works
After you enable log-trace correlation, trace IDs are automatically generated in your application logs. You can then use these trace IDs to search and analyze log entries across your services.
The setup has two parts:
Enable trace ID injection for your application in the EDAS console.
Query and analyze correlated logs on the Log Analysis page.
Limits
Log analysis is available only in EDAS Professional Edition and Platinum Edition.
Prerequisites
Before you begin, make sure that you have:
An EDAS application deployed on a Kubernetes cluster
EDAS Professional Edition or Platinum Edition activated
Associate logs with trace IDs
Enable trace ID injection so that EDAS automatically tags each log entry with the trace ID of the originating request.
- Log on to the .
- In the left-side navigation pane, choose Application Management > Applications. In the top navigation bar, select a region. In the upper part of the page, select a microservice namespace. From the Cluster Type drop-down list, select Kubernetes Cluster. Then, find the target application and click its name in the Application Name column.
- In the left-side navigation pane, choose .
- Click the Custom Configuration tab.
- In the Business Log Linking Settings section, turn on Link Business Logs with TraceId.
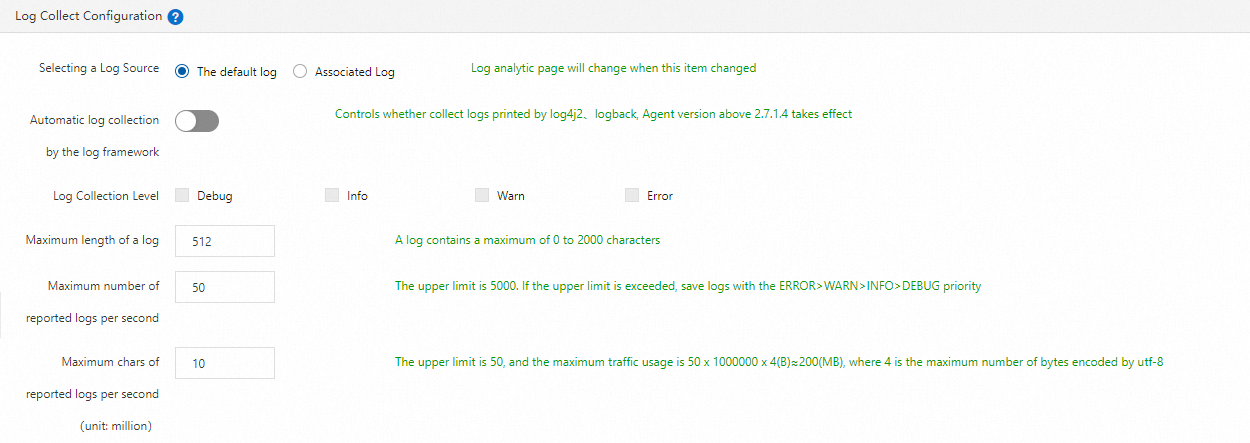
After you turn on this setting, EDAS injects trace IDs into the application logs automatically.
- To achieve precise positioning, you must bind your projects and Logstores.
- Click Save at the bottom of the Custom Configuration tab.
Query and analyze correlated logs
After trace ID injection is enabled, use the Log Analysis page to search for log entries by trace ID, keyword, or time range.
- Log on to the .
- In the left-side navigation pane, choose Application Management > Applications. In the top navigation bar, select a region. In the upper part of the page, select a microservice namespace. From the Cluster Type drop-down list, select Kubernetes Cluster. Then, find the target application and click its name in the Application Name column.
- In the left-side navigation pane, choose .
- Enter a query statement in the search box.
A query statement consists of a search statement and an analytic statement in the following format:
Search statement|Analytic statementFor more information about the query syntax, see Search syntax and SQL syntax and functions.
- Set the time range for the query.
Specify a start time and end time in hours or down to the second. Alternatively, set a time duration without specifying a start or end time.
Note Query results may include logs generated up to 1 minute before the specified start time or 1 minute after the specified end time. - Click Search & Analyze to view the results.