The visual MapReduce model is developed based on the MapReduce model to support visualized O&M capabilities. You do not need to modify code in the backend. You need to only change the distributed model of a job to the visual MapReduce model in the SchedulerX console. Then, a page that contains all tasks generated for the job is displayed in the console. On this page, you can view the details and the results of each task and re-run each task.
Precautions
Only SchedulerX Professional Edition supports the visual MapReduce model.
The number of tasks cannot exceed 1,000.
The size of a single subtask cannot exceed 64 KB.
When the custom label information of tasks are displayed, you must implement specified interfaces for the task objects.
The return value of `result` in the `ProcessResult` method cannot exceed 1000 bytes.
If you use the `reduce` method, the results of all subtasks are cached on the master node. This can put significant pressure on the master node's memory. Keep the number of subtasks and the size of the return value small. If you do not require the `reduce` method, use the `MapJobProcessor` interface.
SchedulerX does not guarantee that a subtask executes only once. Under certain conditions, a failover may occur, which can cause a subtask to run multiple times. You must implement idempotence in your business logic.
Interfaces
The visual MapReduce model inherits all interfaces of the MapReduce model. The job processing code of the visual MapReduce model is the same as that of the MapReduce model. For more information, see MapReduce model.
Optional: You can specify labels for each task that is executed by the visual MapReduce model. If the labels of tasks are displayed, you must implement the com.alibaba.schedulerx.worker.processor.BizSubTask interface for the task objects.
Interface
Description
Required
public Map<String, String> labelMap()This interface is used to output the label information of tasks. The label information includes the account name, product code, city, and other custom features of the task objects.
No
Comparison between MapReduce and visual MapReduce
Item | MapReduce | Visual MapReduce |
Number of tasks | More than one million. | Less than or equal to 1,000. |
Task development mode | The same mode is used. | |
Task list | Not supported. | Supported. |
Task running details | Not supported. | Supported. The details include the execution records, execution status, logs, tracing analysis, and running stacks of each task. |
Task labels | Not supported. | Supported. After the BizSubTask interface is implemented for the task, you can view the information about business labels. |
Task operations | Not supported. | Supported. You can stop and re-run a single task. |
Demo: Develop a job
Process multiple accounts at a time
Example: You want to process multiple bank accounts at a time. Each bank account is considered as an independent task that you can run in global parallel mode in a cluster. Each task in the task list must have its account information displayed for easy query. This helps you understand the processing status and execution details of each bank account in a quick manner. The following demo code is used for your reference.
Specify custom objects for each bank account. Each object supports the display of label information. You must implement the com.alibaba.schedulerx.worker.processor.BizSubTask interface and the labelMap method for each object.
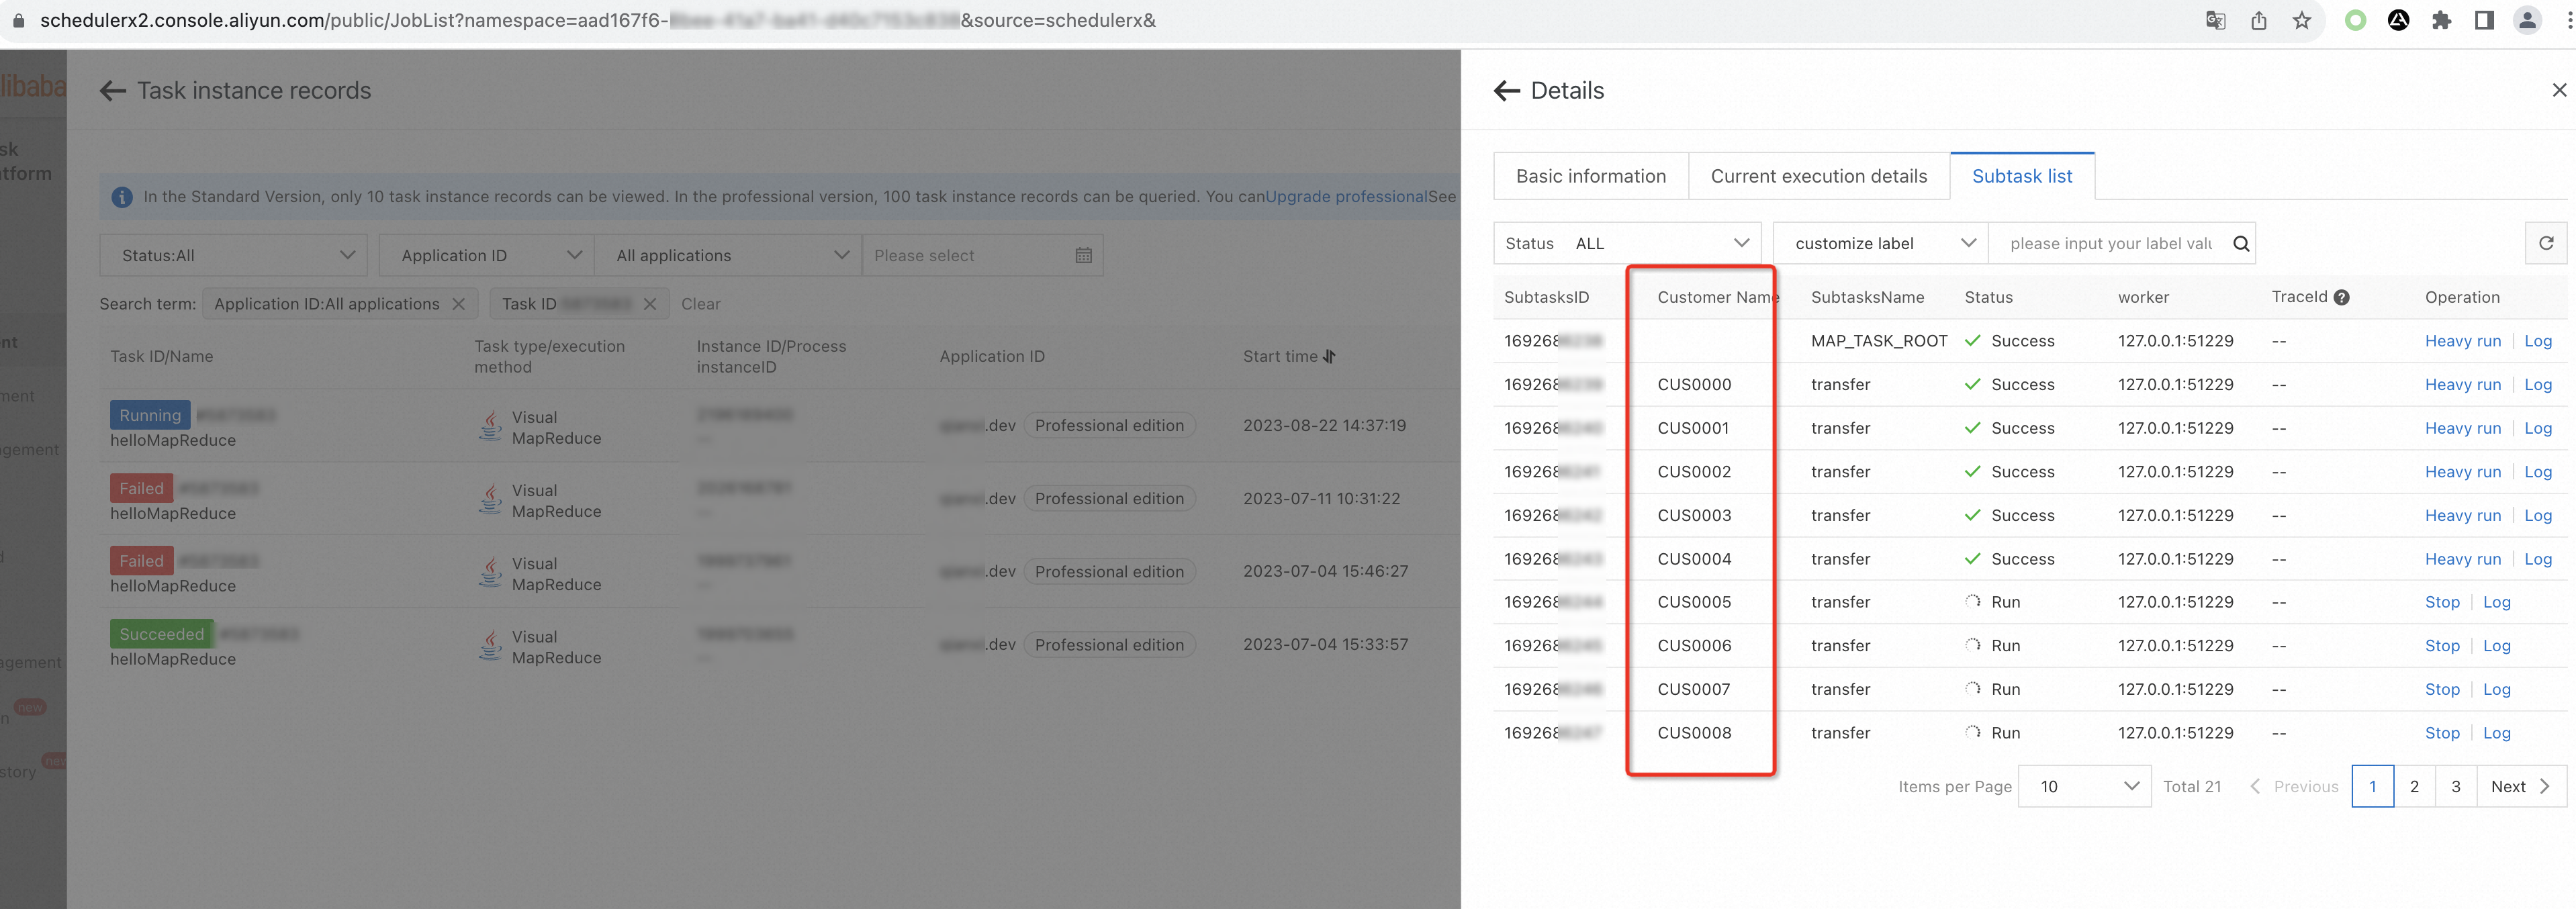
public class ParallelAccountInfo implements BizSubTask {

    /**
     * Primary key
     */
    private long id;

    private String name;

    private String accountId;

    public ParallelAccountInfo(long id, String name, String accountId) {
        this.id = id;
        this.name = name;
        this.accountId = accountId;
    }

    /**
     * Implement the labelMap method that is used to specify a label for a task.
     * @return
     */
    @Override
    public Map<String, String> labelMap() {
        Map<String, String> labelMap = new HashMap();
        labelMap.put("Account name", name);
        return labelMap;
    }
}
After the interface is implemented for each task object, the task list displays the unique label information such as the account name of each task object. You can use the label information to understand the business processing status of each bank account and search for bank accounts by label.
Use Processor to process the business logic of each bank account and inherit com.alibaba.schedulerx.worker.processor.MapReduceJobProcessor.
Procedure
Configure a visual MapReduce model for a job
Log on to the SchedulerX console. In the left-side navigation pane, click Task Management.
On the Task Management page, click Create task.
In the Create task panel, select Visual MapReduce from the Execution mode drop-down list.
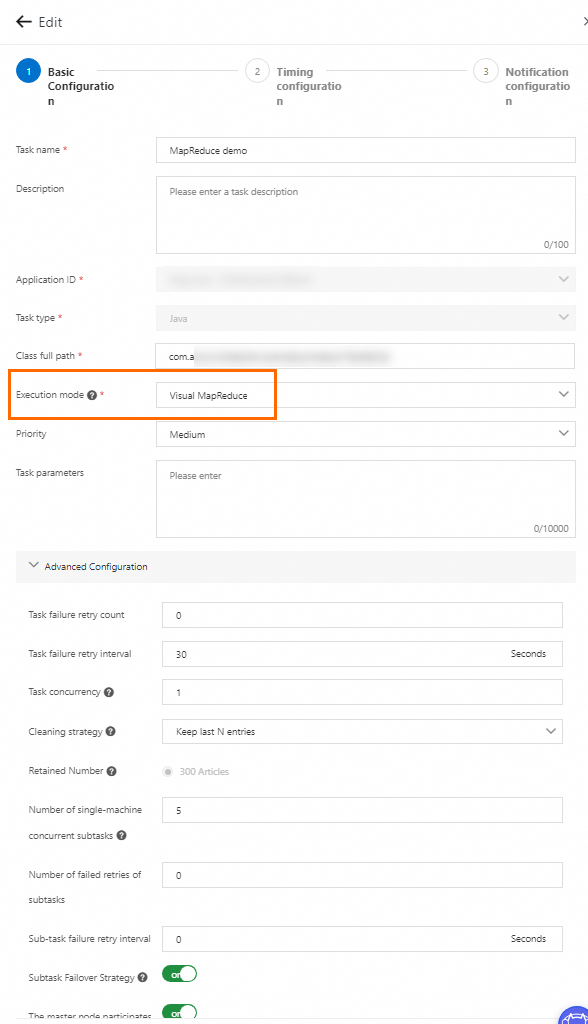
In the Advanced Configuration section, configure parameters based on your business requirements. For more information about other parameters, see Advanced parameters for job management.
Parameter
Description
Distribution policy
Polling Scheme: The system evenly distributes the same number of tasks to each worker. This policy is suitable for scenarios in which each worker requires almost the same amount of time to process a task. This is the default value.
workerLoad optimal strategy: The master node automatically detects the loads of worker nodes. This policy is suitable for scenarios in which a large difference exists between the amount of time each worker requires to process a task.
NoteThis parameter is displayed only if the client version is V1.10.14 or later.
Number of single-machine concurrent subtasks
The number of execution threads on a worker. Default value: 5. To speed up the execution, you can specify a larger value. If the downstream or the databases cannot withstand the value that you specified, you can specify a smaller value.
Task failure retry count
If a task fails, the task is automatically retried. Default value: 0.
Sub-task failure retry interval
The interval between two consecutive retries if a task fails. Unit: seconds. Default value: 0.
Subtask Failover Strategy
Specifies whether to distribute a task to a new worker after the worker fails to execute the task and is stopped. If you turn on the switch, the system may execute a task more than once when a failover is triggered. You must implement the idempotence of tasks.
NoteThis parameter is displayed only if the client version is V1.8.13 or later.
The master node participates in the execution
Specifies whether the master node participates in the execution of tasks. At least two workers must be available to run tasks. If an extremely large number of tasks exist, we recommend that you turn off the switch.
NoteThis parameter is displayed only if the client version is V1.8.13 or later.
View task details of the job on GUIs
After the job is executed, you can find the job on the Execution List page and click Details in the Operation column to view the execution details of the tasks.
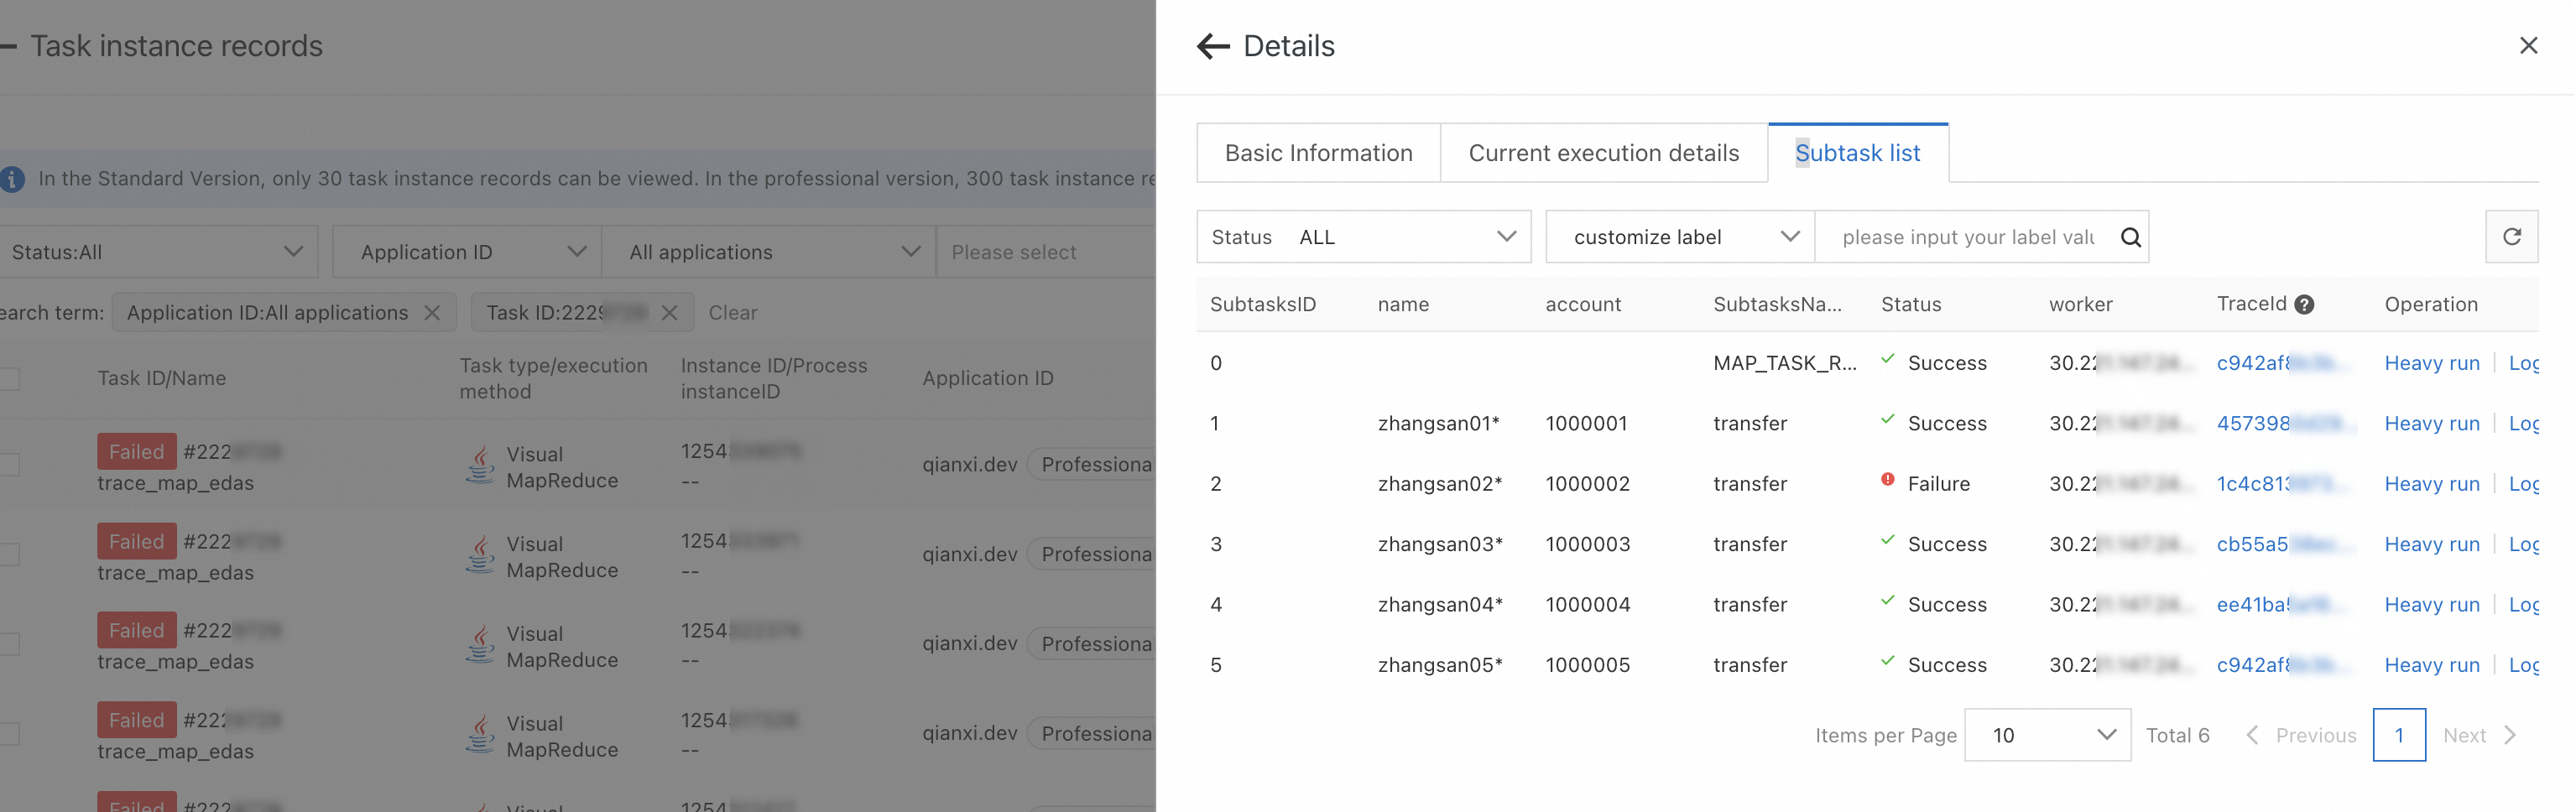
On the Subtask list tab, view the execution status of each task.

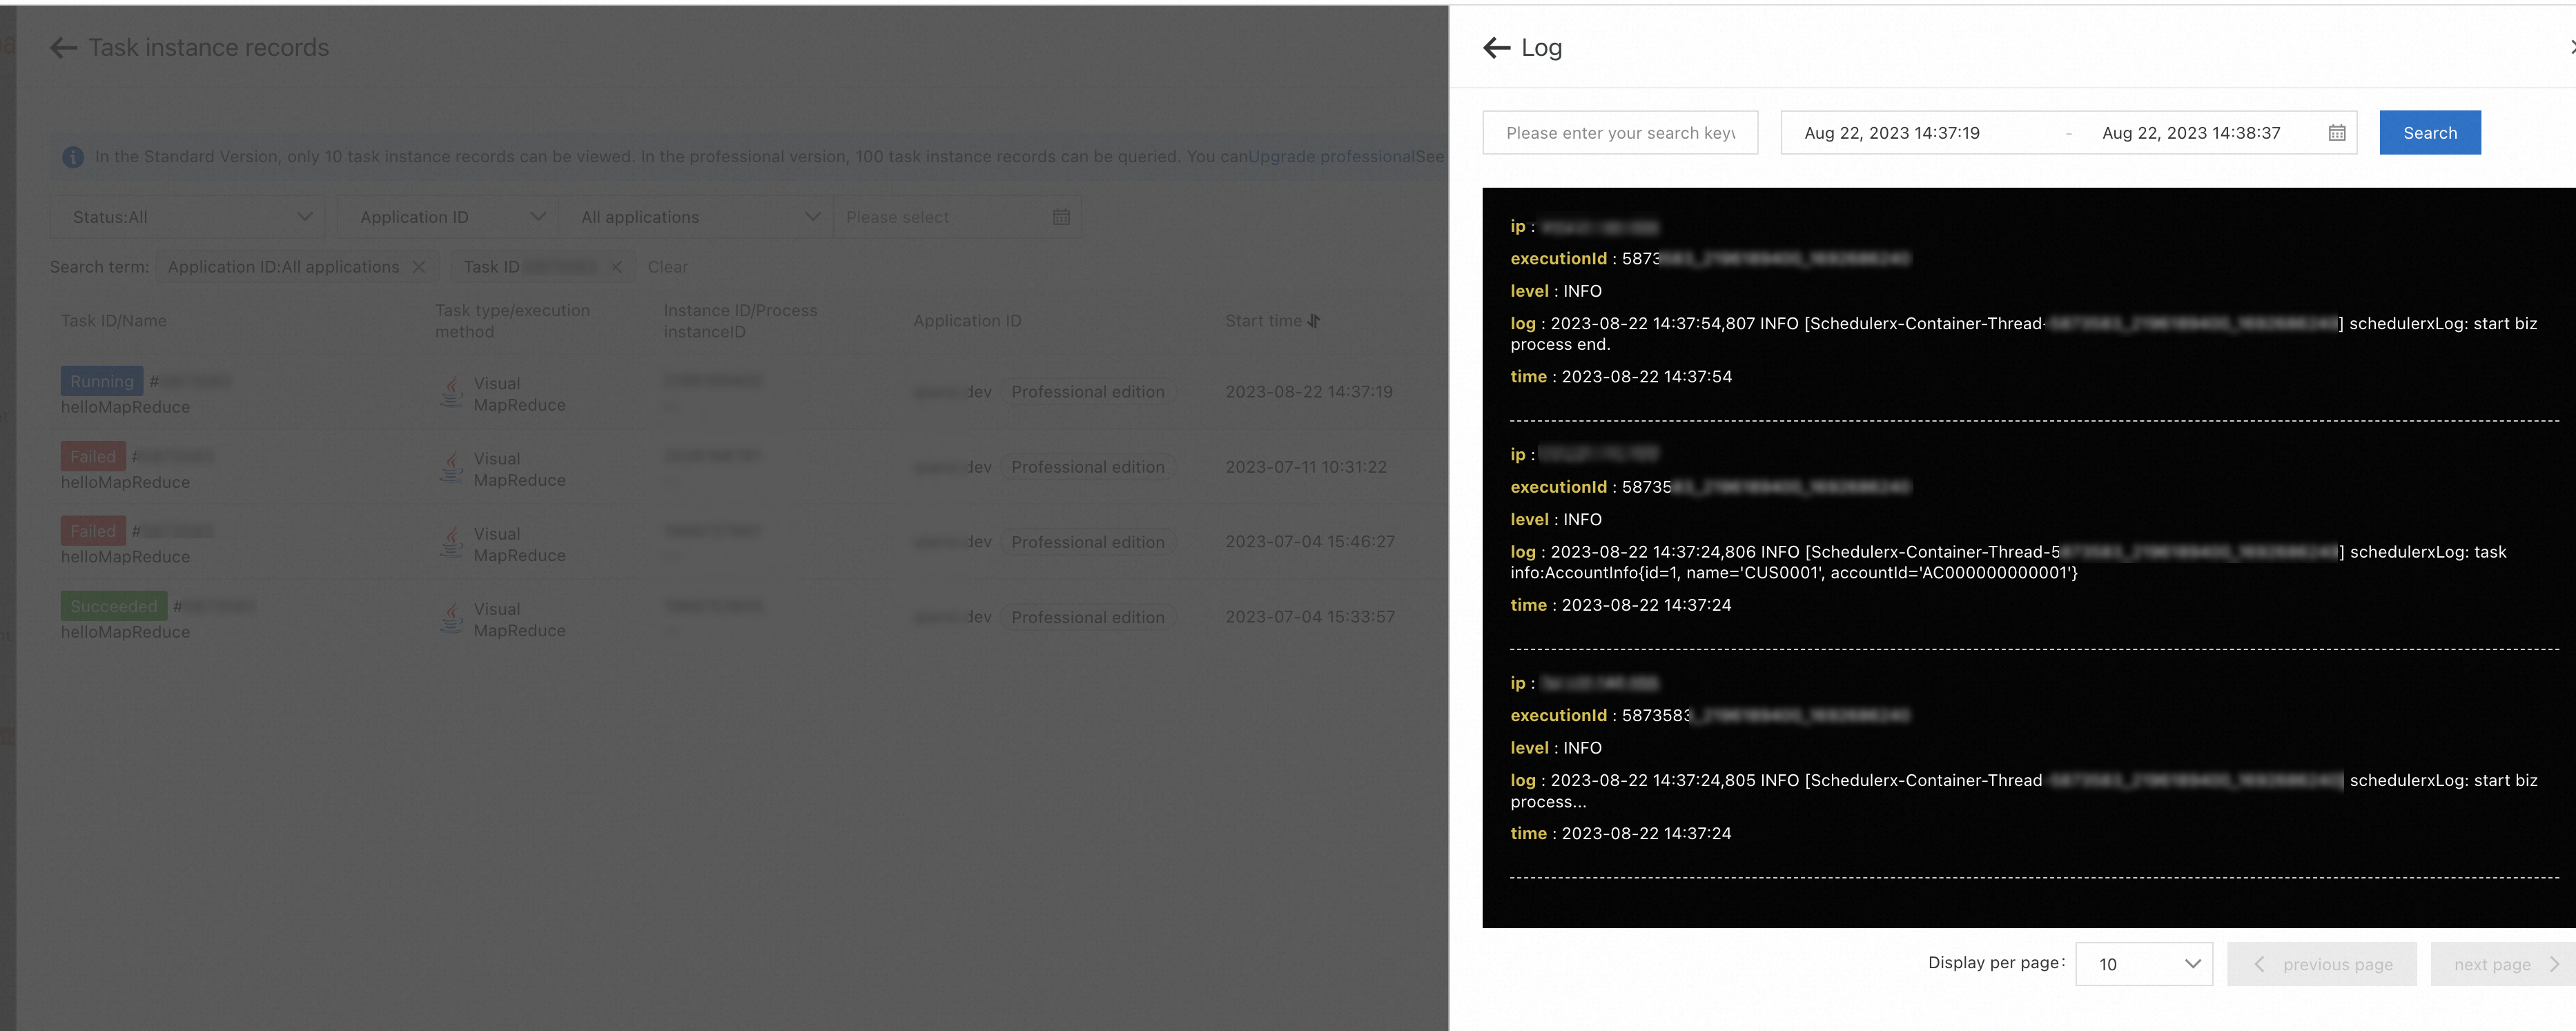
On the Subtask list tab, find the task that you want to manage and click Log in the Operation column to view the business log information of each task and analyze the execution result.
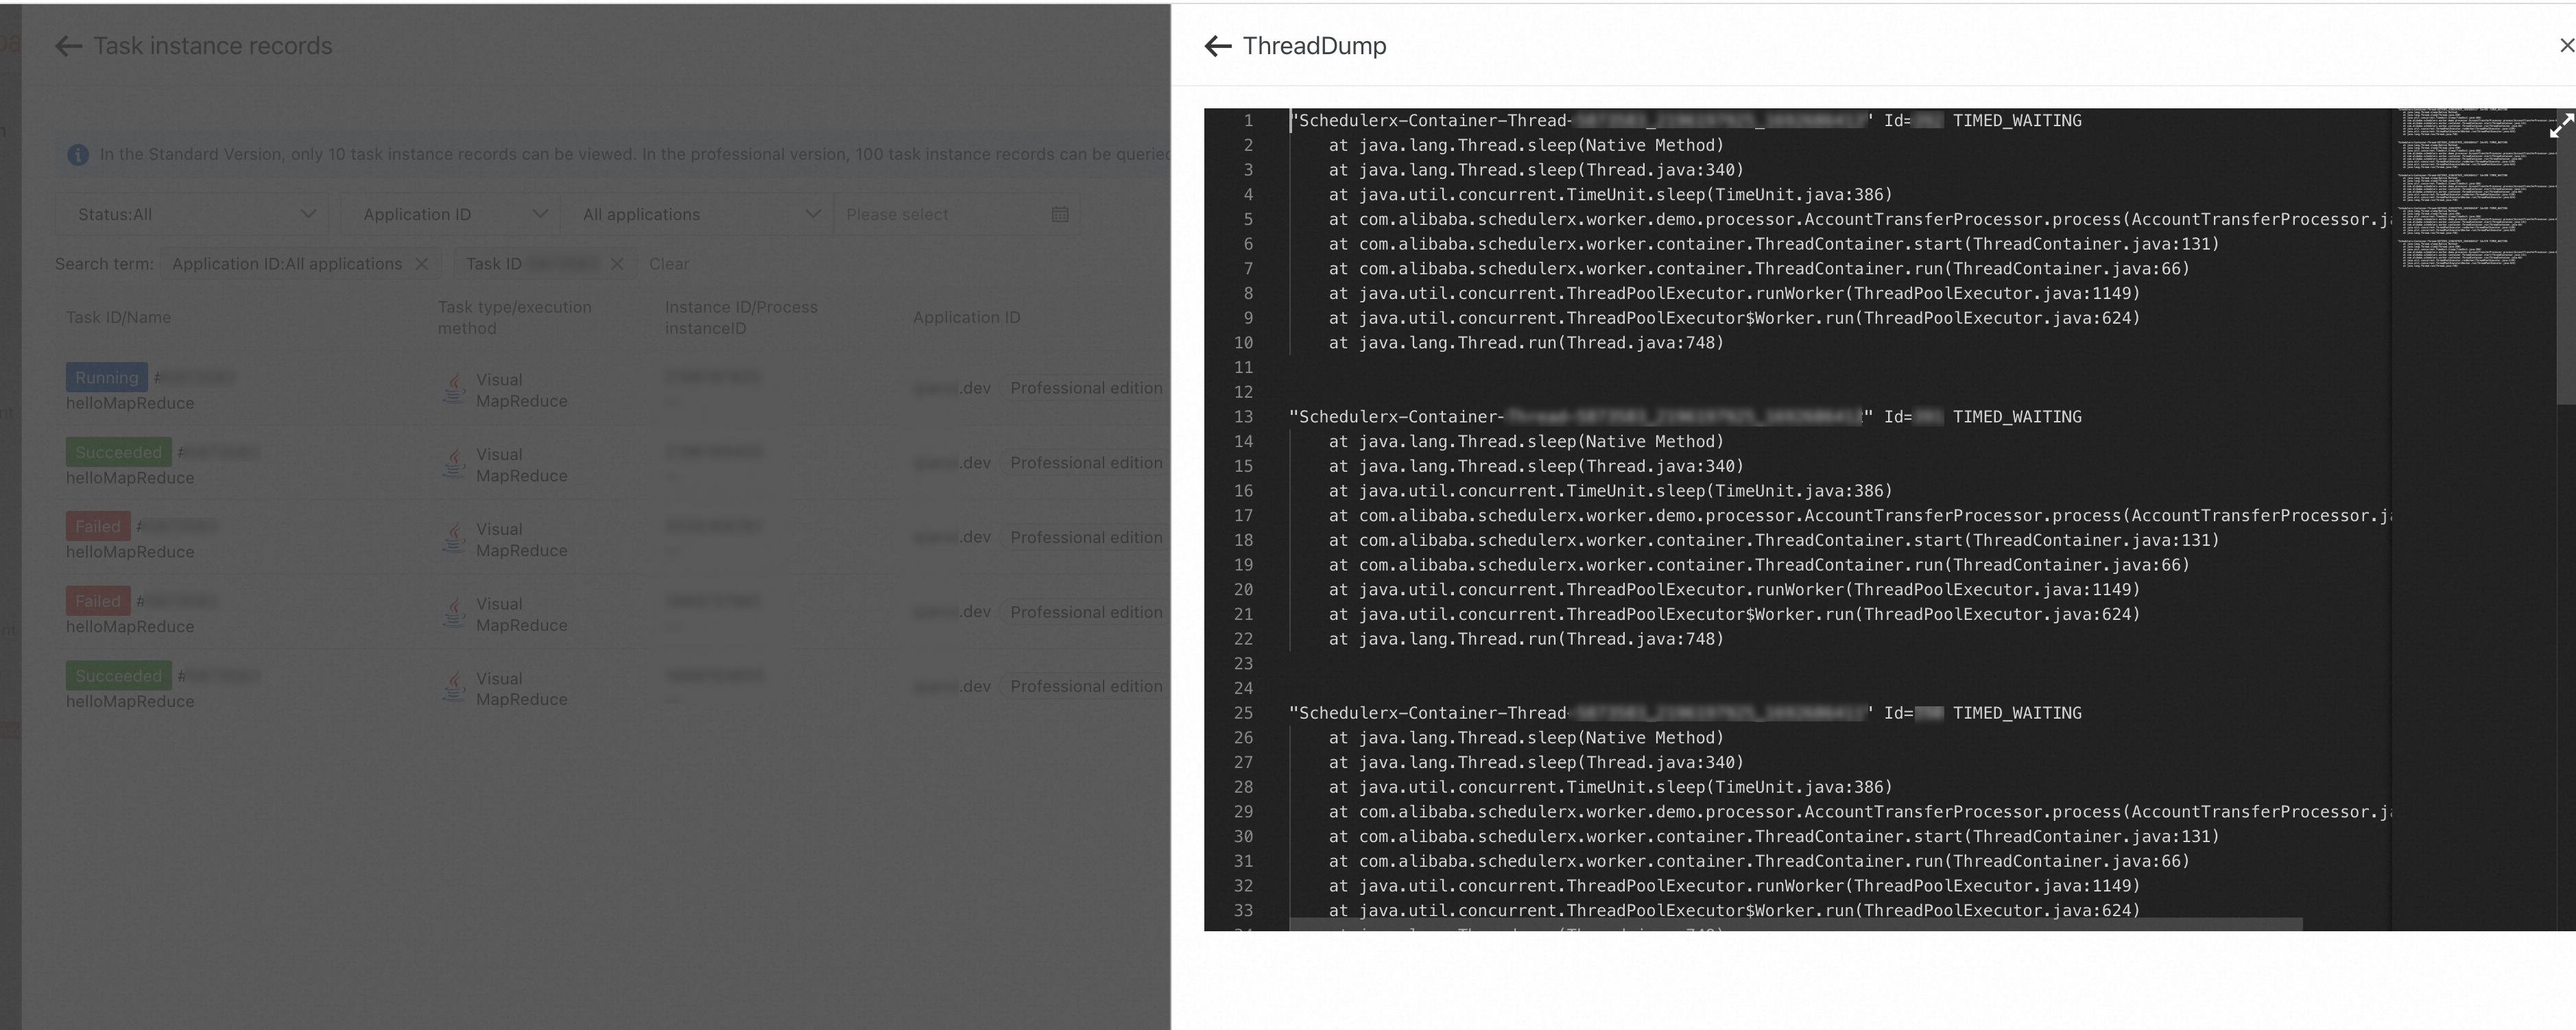
When the execution records of the job are available, click ThreadDump on the Current execution details tab to view the thread execution status of the relevant machine and analyze the error details of the job.
After Tracing Analysis is connected, you can click the value in the TraceId column of the task on the Subtask list tab to query the details of the corresponding trace. For more information, see Integrate tracing analysis.