When database queries cause latency or errors in your application, you need visibility into which SQL statements are responsible. SQL analysis in Enterprise Distributed Application Service (EDAS) tracks SQL statements executed by an application instance, so you can:
Identify slow or high-frequency SQL statements that degrade performance
Monitor SQL call volume and response time trends over a specific time period
Trace SQL statements back to the application interfaces that triggered them
Limitations
SQL analysis is available in Professional Edition and Platinum Edition only. Standard Edition does not include this feature.
View SQL analysis for an application instance
To open the SQL analysis page:
Log on to the EDAS console.
In the left-side navigation pane, choose Application Management > Applications.
In the top navigation bar, select a region. In the upper part of the page, select a microservice namespace, and then select Kubernetes Cluster from the Cluster Type drop-down list.
Click the application name in the Application Name column.
In the left-side navigation pane of the application details page, choose Monitor > Instance Details.
In the left-side pane of the Instance Details page, select the instance that you want to view, and then click the SQL Analysis tab.
The SQL analysis page contains two sections: SQL Calls (time series metrics) and the SQL statement list (per-statement details).
Analyze SQL call trends
The SQL Calls section displays a time series chart of SQL call metrics for the selected instance during the specified time period. Use this chart to spot patterns such as sudden spikes in call volume or increased response times that correlate with application issues.
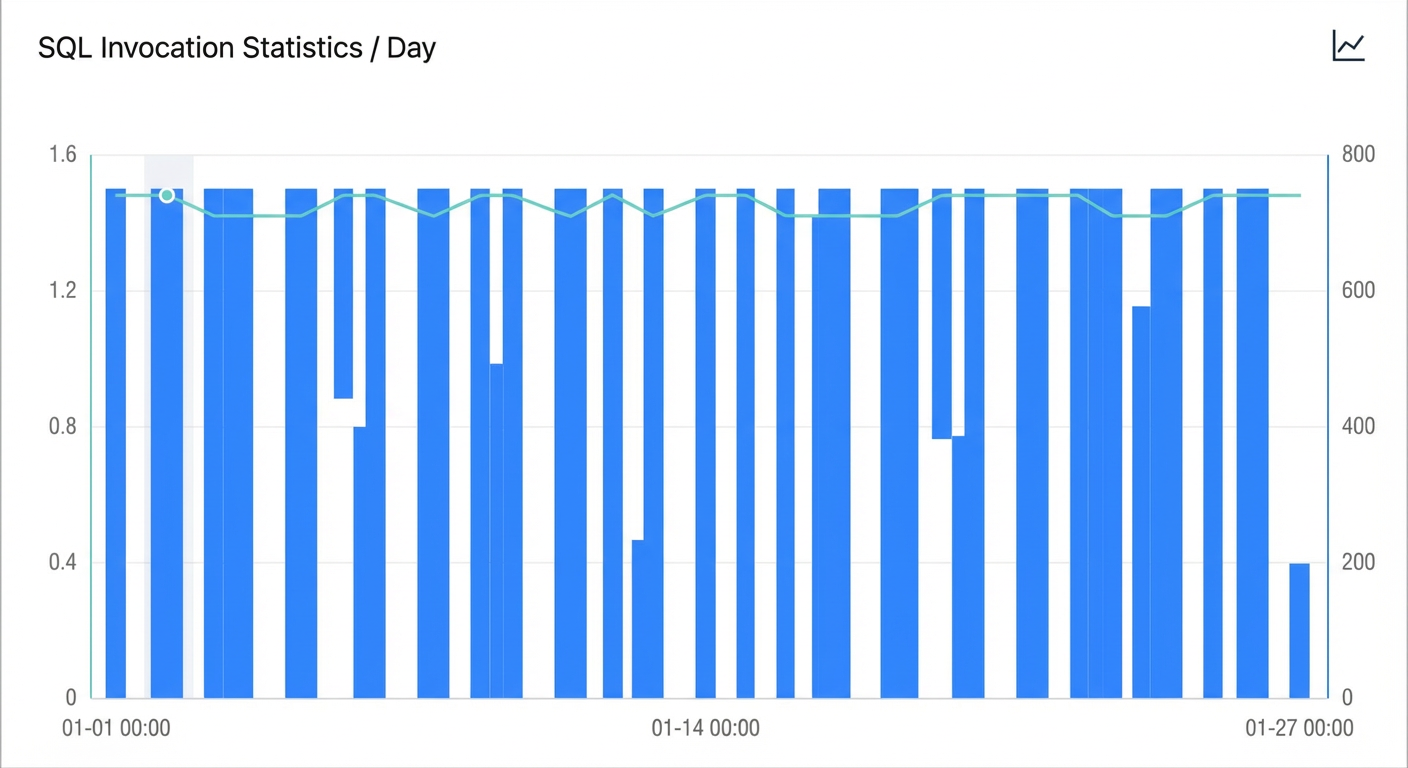
To interact with the chart:
Hover over the chart to view detailed metrics at a specific point in time.
Click the
 icon to view metrics for a specific time range or compare the same metric across different dates.
Investigate individual SQL statements
The SQL statement list shows every SQL statement executed by the application during the specified time period, with aggregated performance data for each statement.

Each SQL statement in the list provides two actions in the Actions column:
| Action | Description |
|---|---|
| Invocation Statistics | View a time series chart of call statistics for a specific SQL statement. Use this to determine whether a statement's performance is degrading over time. |
| Interface Snapshot | View snapshots of the application interfaces that called a specific SQL statement. Use this to trace which operations triggered the query and identify the root cause of slow database calls. |
For more information about traces, see Usage notes.