When you sort, aggregate, or run script queries on _id primary keys or text fields with fielddata enabled, you might experience slow search results or page load delays. If this occurs, first check your fielddata memory usage. If the usage is high, this topic helps you identify and resolve the issue.
Background information
Experience from many Elasticsearch (ES) cluster Operations and Maintenance (O&M) cases shows that lower fielddata memory usage is better. Fielddata should not consume a large amount of heap memory. However, high fielddata memory usage is a common issue in ES O&M. In critical cases, it can make the entire cluster unavailable.
Problem scenarios
The fielddata cache mainly contains field data and global ordinals. The main scenarios that use fielddata include the following:
The first two scenarios consume a large amount of fielddata cache and have a significant impact. You should focus on them first.
Sorting, aggregation queries, and script queries on the
_idprimary key.Solutions:
The official Elasticsearch documentation prohibits aggregations, sorting, and script operations on
_id. You can copy the_iddata to a field withdoc_valuesenabled and perform these operations on the new field.When you query data by
_idin Kibana Discover, the drop-down suggestion feature automatically triggers an aggregation.In Kibana, navigate to Stack Management > Advanced Settings and disable
filterEditor:suggestValues. This action prevents numerous aggregation and analysis operations on the_idfield when you search by primary key in Kibana.
Aggregation, sorting, and script queries on text fields with fielddata enabled.
Solution:
By default, fielddata is disabled for text fields. After you enable it, you can perform aggregation, sorting, and script queries. If you load a high-cardinality text field, fielddata will consume a large amount of heap memory permanently. You should change the field type to keyword.
Queries such as terms aggregations and composite aggregations on fields of types such as keyword and ip.
Aggregations on parent and child documents of a join field.
Troubleshoot the issue
You can check if the fielddata memory usage is too high in three ways: advanced monitoring alerts, the fielddata API, and hot threads.
Advanced monitoring alerts
The advanced monitoring and alert service for Alibaba Cloud Elasticsearch extends the monitoring features of the community edition with finer granularity. It is especially helpful for cluster O&M.
Log on to the Alibaba Cloud Elasticsearch console.
In the left navigation pane, click Advanced Monitoring and Alerting.
On the Advanced Monitoring and Alerting page, choose .
On the Default Basic Metrics tab, you can view the fielddata memory usage metric.
fielddata API
Log on to the Kibana console of your Elasticsearch cluster and go to the Kibana homepage.
In the left navigation menu, click Dev tools.
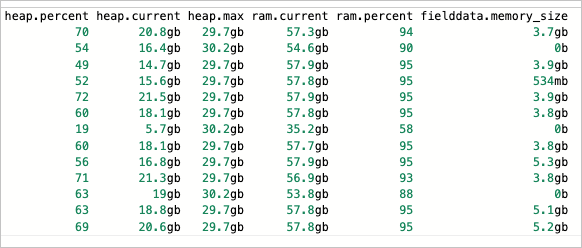
Run the following command on the Console tab to view the fielddata memory usage (fielddata.memory_size) of each node.
GET _cat/nodes?v&h=ip,heap.percent,heap.current,heap.max,ram.current,ram.percent,fielddata.memory_sizeThe expected output is as follows.
Hot threads
You can use thread profiling to see what kind of time-consuming tasks the cluster is currently processing. This helps you focus on the root cause.
GET _nodes/hot_threadsThe following result shows that the hot thread is processing `fielddata.ordinals.GlobalOrdinalsBuilder`, which means it is building global ordinals.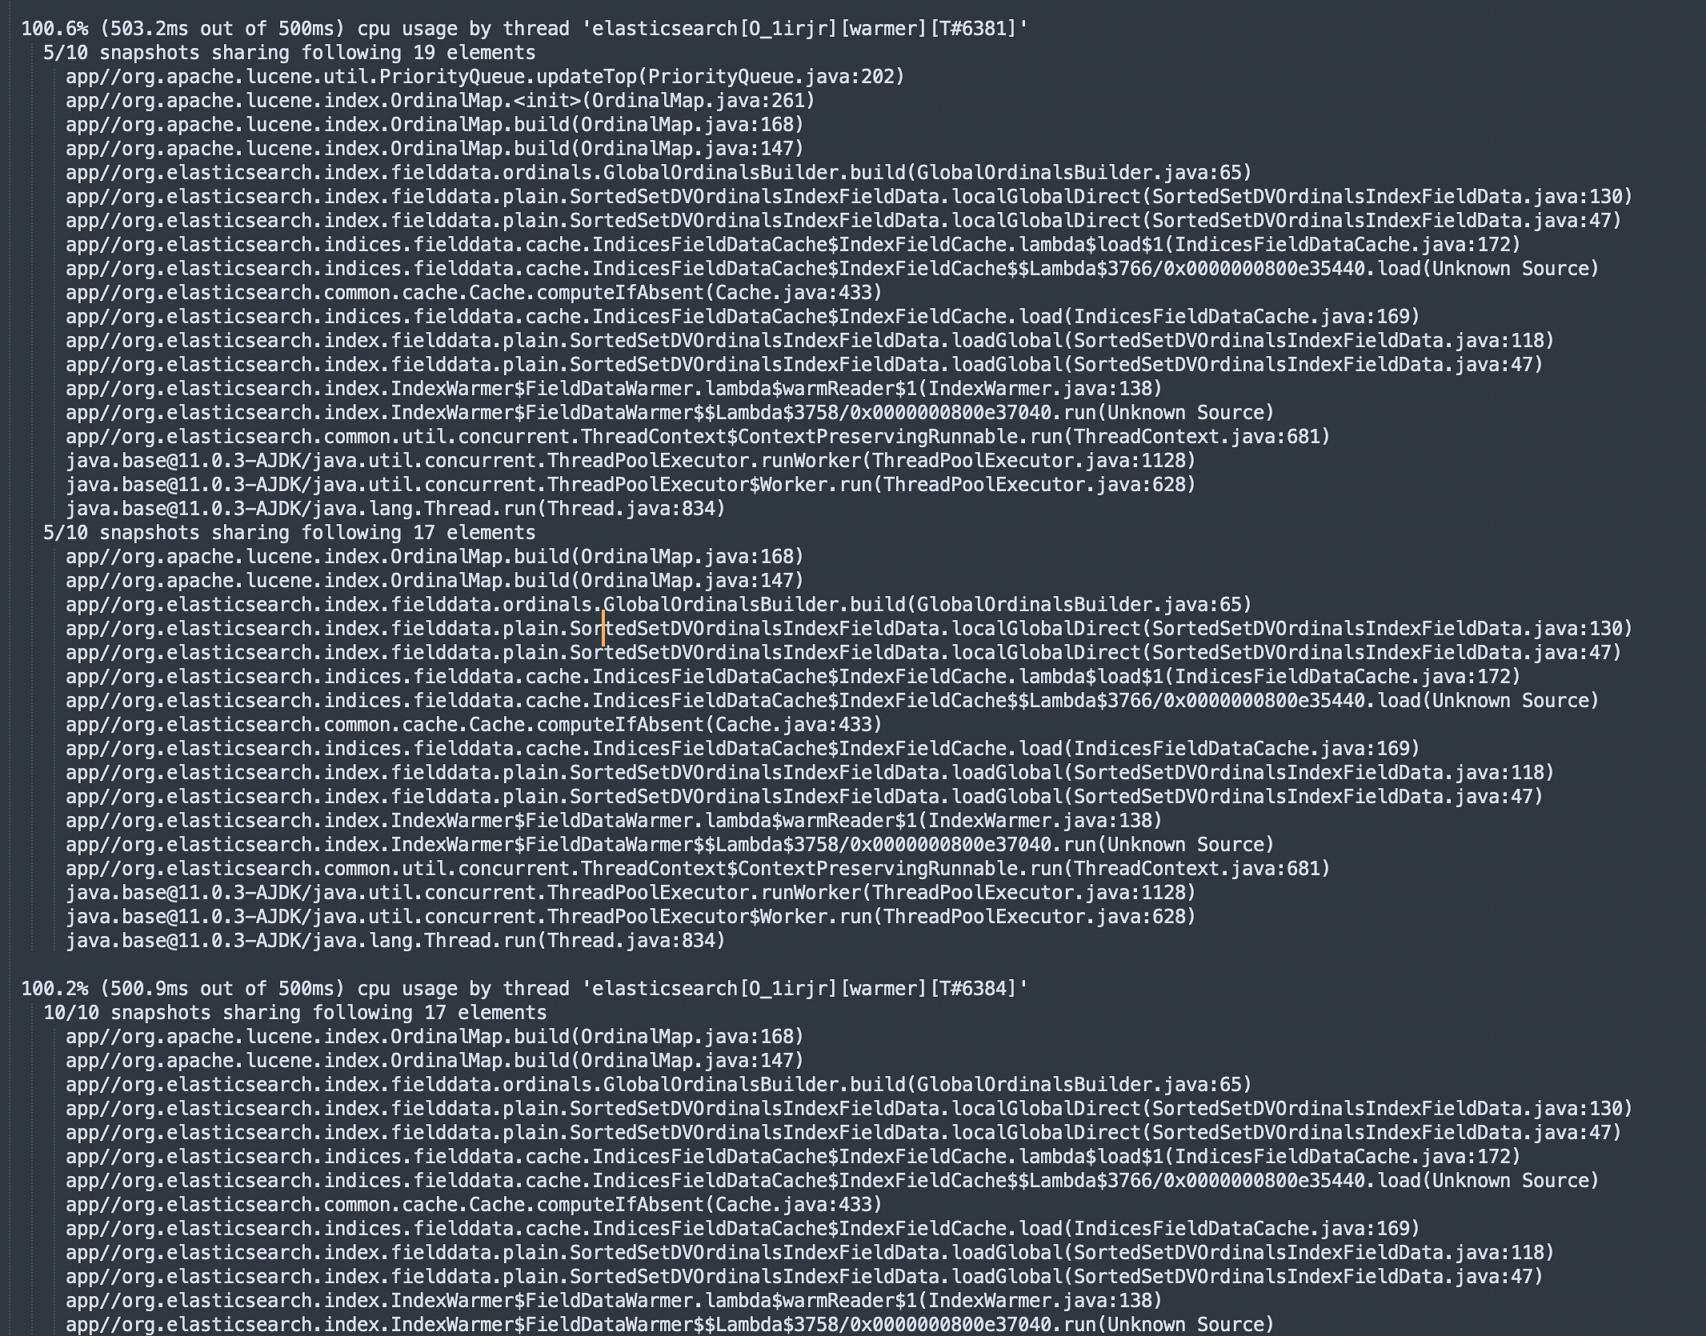
Analyze the issue
You can analyze the cause of high fielddata memory usage using the fielddata API and logs.
fielddata API
Run the following command to retrieve the fields that use a large amount of fielddata memory. Then, analyze which business queries are related.
GET _cat/fielddata?v&s=size:descThe expected output is as follows.
Focused log query
You can analyze the slow query logs of the instance in the Alibaba Cloud Elasticsearch console to check for operations that cause high fielddata memory usage. For more information, see Query logs. For example, the following log shows an operation that sorts by `_id` during a query, which leads to high fielddata memory usage.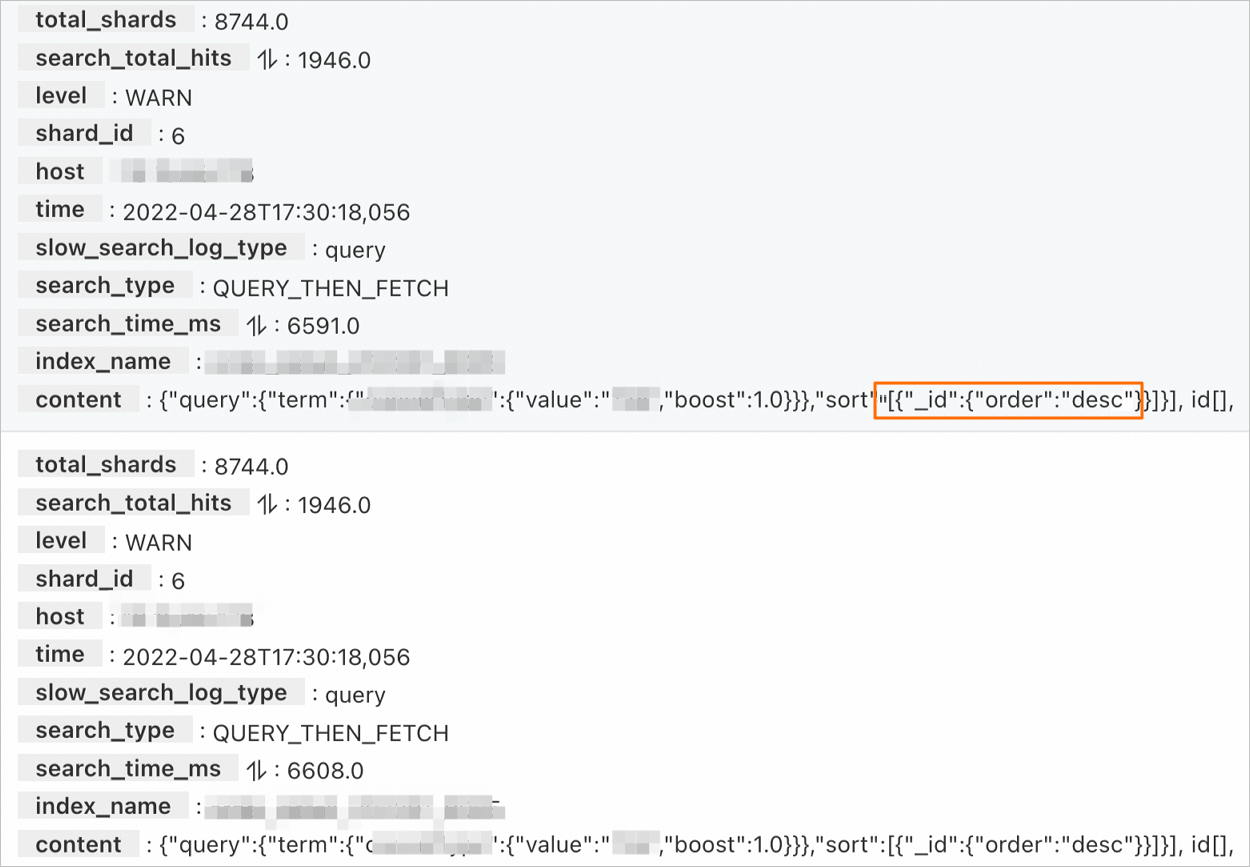
Solutions
You can use the following solutions to temporarily resolve high fielddata memory usage:
You can use `_cache/clear` and specify `fielddata` to clear the fielddata cache. If you do not specify a cache, all caches are cleared.
POST _cache/clear?fielddata=trueImportantClearing the cache using the API is a temporary solution. You must evaluate your business environment before you perform this operation. This operation increases query time, consumes extra compute resources, and may increase the pressure on the cluster.
You must optimize your queries from a business perspective. Otherwise, the query pressure may return to a high level even after you clear the cache. For example, for query scenarios that involve `_id`, you can create a new field, write the data to the new field, and use the new field for queries.
Force a cluster restart.
For more information, see Restart a cluster or node.
NoteIf high fielddata memory usage consumes a large amount of heap memory and makes the cluster inaccessible, you can force a cluster restart to restore access.