Fleet is a powerful centralized management solution in Elasticsearch for managing multiple nodes and services. Fleet consists of two main components: a Fleet server and a Fleet agent. A Fleet agent is a lightweight data collection agent that collects data from the source server. The Fleet server is the central node of Fleet, managing and monitoring all Fleet agents and transferring data to Elasticsearch.
Terms
Term | Description |
Fleet | A powerful centralized management solution in Elasticsearch for managing agent services. |
Fleet agent | A lightweight data collection agent responsible for collecting data from the source server. A Fleet agent can run on multiple operating systems and collect various types of data. |
Fleet server | Responsible for transferring data collected by agents to Elasticsearch. |
Prerequisites
Create an Alibaba Cloud Elasticsearch cluster. For more information, see Create an Alibaba Cloud Elasticsearch cluster. This topic uses an Elasticsearch 8.5 cluster as an example.
NoteAlibaba Cloud Elasticsearch clusters support only versions 7.16 and 8.5.
Create an ECS instance in the same VPC as the Elasticsearch cluster. For more information, see Create an instance.
NoteThe ECS instance acts as the source server. Elastic Agent collects data from this ECS instance.
Create an agent policy and add integrations
Step 1: Create an agent policy
Log on to the Kibana console. For more information, see Log on to the Kibana console.
Click the
 icon and navigate to Management > Fleet.
On the Fleet page, click the Agent policies tab.
Click Create agent policy and configure the policy in the panel.
For Name, enter
custom-log.Clear the Collect system logs and metrics checkbox.
Click Advanced Options. In the Agent monitoring section, clear the Collect agent logs and Collect agent metrics checkboxes.
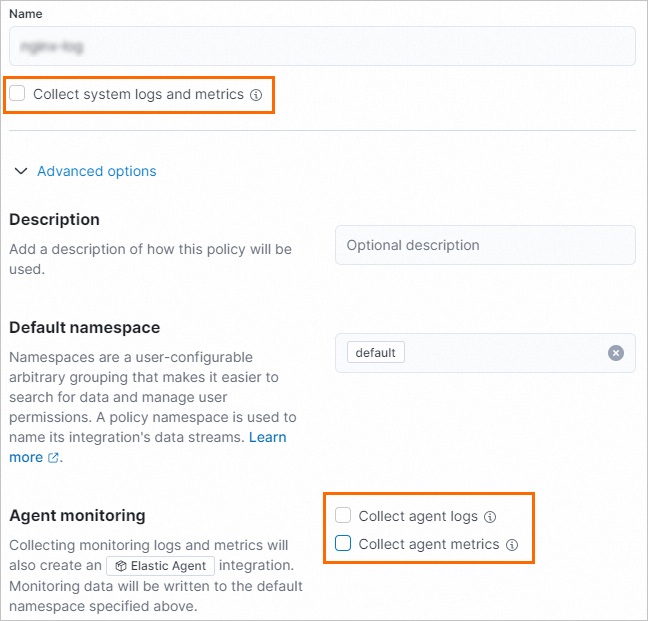 Note
NoteIn this scenario, you only need to collect Custom Logs data. Therefore, you do not need to collect system logs, system metrics, or the agent's own data.
Click Create agent policy.
Step 2: Create a Fleet Server integration
On the Fleet page, click the Agent policies tab, then click the custom-log agent policy.
On the Integration tab, click Add integration.
On the Browse integrations tab, search for and click Fleet Server.
Install the Fleet server integration.
On the Fleet Server page, click the Set tab.
Click Install Fleet Server assets. In the dialog box that appears, click Install Fleet Server.
NoteThe integration version is displayed on the Settings tab after installation.
In the upper-right corner of the page, click Add Fleet Server.
On the Add Fleet Server integration page, enter a name for the integration and select the
custom-logagent policy.Click Save and continue, and then click Add Elastic Agent later in the dialog box.
Step 3: Create a Custom Logs integration
On the custom-log agent policy, on the Integration tab, click Add integration.
On the Browse integrations tab, search for and click Custom Logs.
Install the Custom Logs integration.
On the Custom Logs page, click the Set tab.
Click Install Custom Logs assets. In the dialog box that appears, click Install Custom Logs.
NoteThe integration version is displayed on the Settings tab after installation.
In the upper-right corner of the page, click Add Custom Logs.
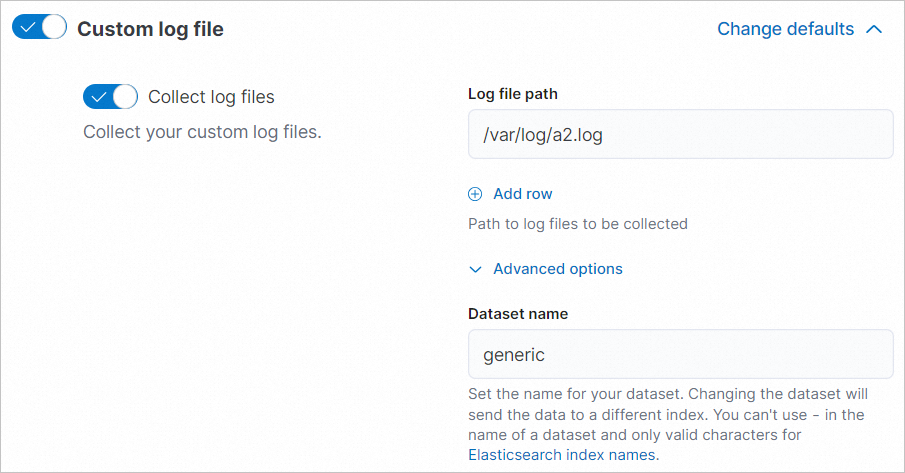
On the Add Custom Logs integration page, configure the integration.
In the Integration Configuration section, enter an Integration name.
In the Custom log file section, enter the path to the log file on the ECS instance (Log file path), for example,
/var/log/a2.log.Click Advanced Options and specify a custom dataset name.
NoteThe dataset name determines the Elasticsearch index name. Specifying a new dataset name sends data to a new index, which enhances data processing flexibility and manageability.
The dataset name must comply with Elasticsearch index naming requirements. It can contain only letters, numbers, and underscores (_).
In the Where to add this integration section, on the Existing hosts tab, select the
custom-logagent policy.
Click Save and continue, and then click Add Elastic Agent later in the dialog box.
Add an agent
Step 1: Configure Fleet Server hosts
Log on to the Kibana console. For more information, see Log on to the Kibana console.
Click the
icon and navigate to Management > Fleet.On the Fleet page, click the Set tab.
In the Fleet server hosts section, click Modify Host.
In the Fleet server hosts panel, enter the private IP address of the source server in the format
https://<private IP address>:<port>, for example,https://172.16.*.***:8220.NoteThis topic uses the primary private IP address of the ECS instance. For more configuration information, see Fleet Server hosts.
In the Output section, click the
 icon in the Actions column.
In the Edit output panel, enter the private endpoint of the Alibaba Cloud Elasticsearch cluster in the format
http://<private endpoint>:<port>, for example,http://es-cn-uqm3auln80001****.elasticsearch.aliyuncs.com:9200.Click Save and apply settings. In the dialog box that appears, click Save and Deploy.
Step 2: Add an Elastic Agent
Add an Elastic Agent to the Fleet server.
To collect data from multiple servers, repeat these steps to add more agents. A single Fleet server can manage multiple agents, each collecting data from its respective server.
On the Fleet page, click the Agent policies tab.
In the Actions column for the
custom-logagent policy, click the .In the Add agent panel, under Select a policy for Fleet Server, confirm that the agent policy is
custom-log.Under Choose a deployment mode for security, keep the default Quick start selection.
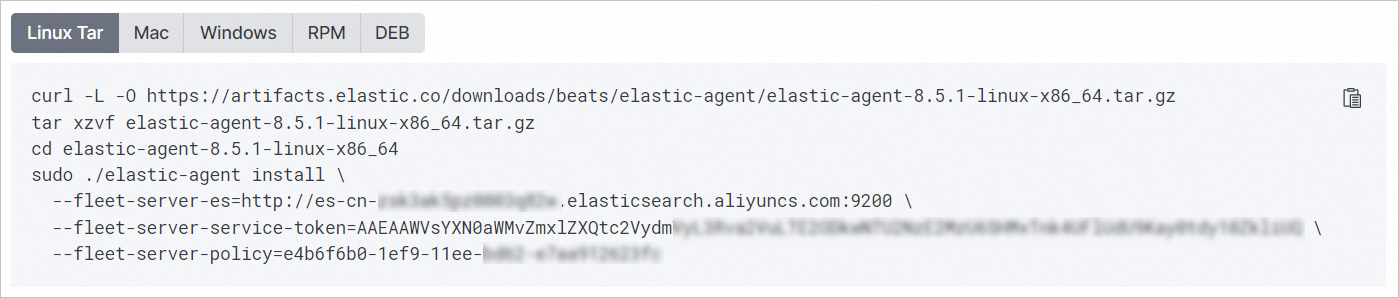
Under Add your Fleet Server host, click Add Host.
In the Generate a service token section, click Generate a service token.
In the Install Fleet Server to a centralized host section, copy the auto-generated code block and run it on your ECS instance.

A
Successfullymessage indicates that the Elastic Agent is installed and running on the ECS instance.
View data
This section shows how to view log data using an example ECS log path (/var/log/a2.log) and dataset name (generic).
Make sure the specified log path on the ECS instance contains data.
View the data stream name in Index Management.
Click the
icon and navigate to Management > Stack Management.In the left-side navigation pane, click .
On the Index Management page, click the Data Stream tab and find the data stream that contains the dataset name
generic, for example,logs-generic-default.
View the index name that corresponds to the data stream in the Kibana console.
Click the
icon and navigate to Management > Dev Tools.Run the following command to get the index name for the data stream:
GET _data_Stream/logs-generic-defaultThe
index_namevalue in the output is the index name.
Run the following command to view the log data in the index:
GET <index_name>/_search
{
  "query":{
    "match":{
      "log.file.path":"/var/log/a2.log"
    }
  }
}