Collect NetFlow logs with Elastic Agent
NetFlow is a network traffic analysis technology for monitoring, analyzing, and diagnosing network traffic. It provides administrators with real-time network visibility to improve performance and security. This topic explains how to use Fleet Server in Kibana to manage an Elastic Agent that collects and sends NetFlow data to your Alibaba Cloud Elasticsearch cluster for analysis.
Terms
Term | Description |
Fleet | A centralized application in Kibana for managing Elastic Agent instances. |
Elastic Agent | A lightweight data shipper that collects data from a source server. Elastic Agent can run on multiple operating systems and collect various types of data. |
Fleet Server | A component that manages connected Elastic Agents and routes their traffic to Elasticsearch. |
Prerequisites
Create an Alibaba Cloud Elasticsearch cluster. For more information, see Create an Alibaba Cloud Elasticsearch cluster. This topic uses an Elasticsearch 8.5 cluster as an example.
Create an ECS instance. The instance must be in the same Virtual Private Cloud (VPC) as your Elasticsearch cluster. For more information, see Create an instance by using the wizard.
NoteThe ECS instance serves as the source server from which the Elastic Agent collects NetFlow data.
Create agent policy and add integrations
Step 1: Create an agent policy
Log on to the Kibana console. For more information, see Log on to the Kibana console.
Go to
 > Management > Fleet.
On the Fleet page, click the Agent policies tab.
Click Create agent policy and configure the agent policy in the panel that appears.
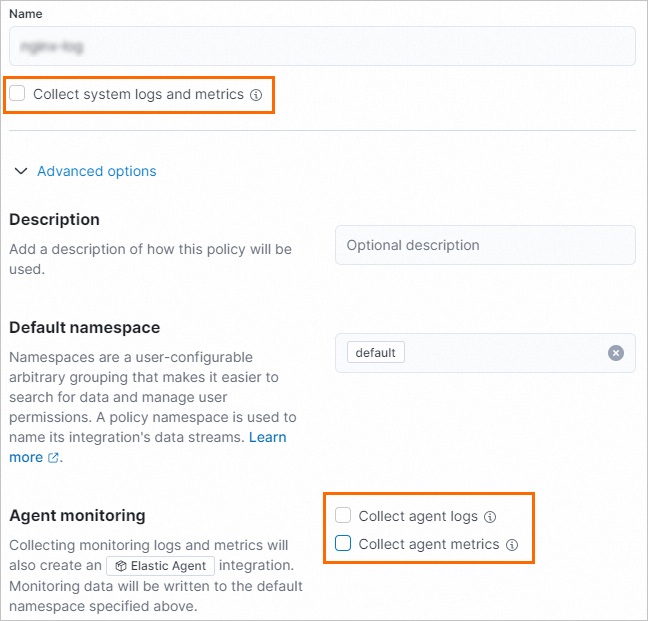
For Name, enter Name.
Clear the Collect system logs and metrics checkbox.
Click Advanced Options. Under Agent monitoring, clear the Collect agent logs and Collect agent metrics checkboxes.
 Note
NoteIn this scenario, you only need to collect NetFlow records, so you can disable the collection of system logs, metrics, and agent monitoring data.
When finished, click Create agent policy in the lower-right corner.
Step 2: Create a Fleet Server integration
On the Agent policies tab of the Fleet page, click the agent policy netflow-log.
On the Integration tab, click Add integration.
On the Browse integrations tab, search for and click Fleet Server.
Install the Fleet Server integration.
On the Fleet Server page, click the Set tab.
Click Install Fleet Server assets, and then click Install Fleet Server in the dialog box that appears.
NoteAfter the integration is installed, the Settings tab displays its version.
In the upper-right corner of the page, click Add Fleet Server.
On the Add Fleet Server integration page, enter a name for the integration and select the agent policy
netflow-log.In the lower-right corner, click Save and continue. In the dialog box that appears, click Add Elastic Agent later.
Step 3: Create a NetFlow Records integration
On the Integration tab of the netflow-log agent policy, click Add integration.
On the Browse integrations tab, search for and click NetFlow Records.
Install the NetFlow Records integration.
On the NetFlow Records page, click the Set tab.
Click Install NetFlow Records assets, and then click Install NetFlow Records in the dialog box that appears.
NoteAfter the integration is installed, the Settings tab displays its version.
In the upper-right corner of the page, click Add NetFlow Records.
On the Add NetFlow Records integration page, configure the integration.
Under Integration Configuration, enter
netflow-1for Integration name.Next to Collect NetFlow logs, click Change defaults. Enter
0.0.0.0as the UDP listening address and keep the default UDP port of 2055.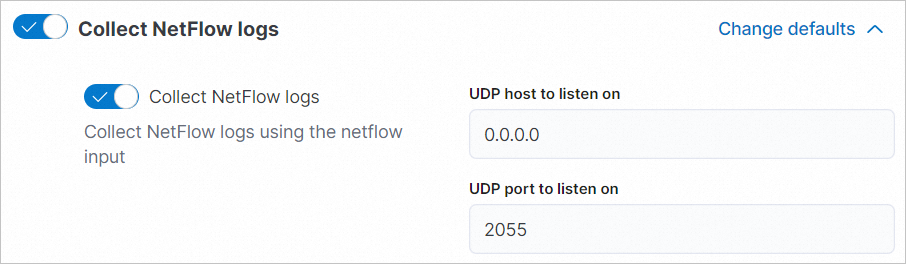
Under Where to add this integration, on the Existing hosts tab, select the agent policy
netflow-log.
When finished, click Save and continue in the lower-right corner. In the dialog box that appears, click Add Elastic Agent later.
Add an agent and start NetFlow service
Step 1: Configure Fleet Server hosts
Log on to the Kibana console. For more information, see Log on to the Kibana console.
Go to
> Management > Fleet.On the Fleet page, click the Set tab.
Under Fleet Server hosts, click Modify Host.
In the Fleet Server hosts panel, enter the private IP address of the source server in the format
https://<private_ip>:<port>, for example,https://172.16.*.***:8220.NoteIn this topic, the private IP address is the primary private IP address of the ECS instance. For more configuration details, see Fleet Server hosts.
In the Output section, click the edit icon (
 ) in the Actions column.
In the Edit output panel, enter the private IP address of your Alibaba Cloud Elasticsearch cluster in the format
http://<private_address>:<port>, for example,http://es-cn-uqm3auln80001****.elasticsearch.aliyuncs.com:9200.Click Save and apply settings, and then click Save and Deploy in the dialog box that appears.
Step 2: Add an Elastic Agent
Add an Elastic Agent to Fleet Server.
To collect NetFlow traffic from multiple servers, add multiple agents to a single Fleet Server by repeating these steps. Each agent collects data from its server, and Fleet Server centrally manages all agents.
Go to
> Management > Fleet.Click the Agent policies tab.
For the netflow-log agent policy, in the Actions column, select
 > Add agent.
In the Add agent panel, under Select a policy for Fleet Server, confirm that the default agent policy is
netflow-log.Under Choose a deployment mode for security, keep the default selection Quick start.
Under Add your Fleet Server host, click Add Host on the right.
Under Generate a service token, click Generate a service token.
Under Install Fleet Server to a centralized host, copy the automatically generated code block and run it on your ECS instance.
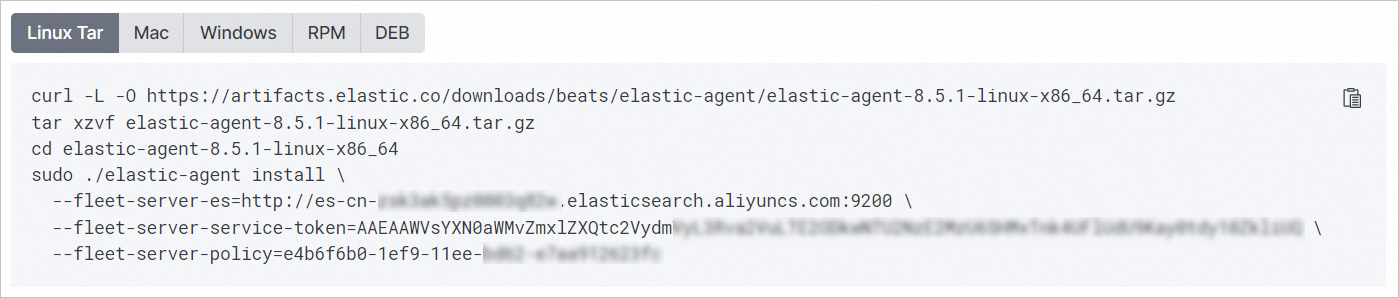
After the command finishes, a message containing
Successfullyconfirms that the Elastic Agent is installed and running on the ECS instance.
Step 3: Configure the NetFlow service
This example uses softflowd to generate NetFlow logs. Run the following commands on the ECS instance to install and start the service.
Download the softflowd source package.
wget https://storage.googleapis.com/google-code-archive-downloads/v2/code.google.com/softflowd/softflowd-0.9.9.tar.gzInstall the libpcap-devel dependency.
yum install libpcap-develCompile and install softflowd.
tar -xvf softflowd-0.9.9.tar.gz
cd softflowd-0.9.9
./configure
make
make install
Run softflowd.
nohup softflowd -v 9 -D -i eth0 -t maxlife=1 -n localhost:2055 >/dev/null 2>&1 &
View data
You can use one of the following methods to view the NetFlow data:
Method 1: View NetFlow data in dashboards
Go to
> Management > Fleet.On the Fleet page, click the Data Stream tab. NetFlow-related data appears in the list of datasets.
In the Actions column for the target dataset, select
> View dashboards, and choose a dashboard to view. For example, select [Logs Netflow] Overview.
Method 2: View data in Discover
Go to
> Analytics > Discover to view the data.Method 3: Query data by using Dev Tools
Go to
> Management > Developer Tools.Run the following command to view the NetFlow data.
GET logs-netflow.log-default/_search