Simulation event analysis lets you compare the results of a primary event and a simulation event processed by different policy sets. This helps you determine which policy set is more effective.
Tag analysis
-
To start the analysis, select a primary event, its corresponding simulation event, and a time range, then click Search.
-
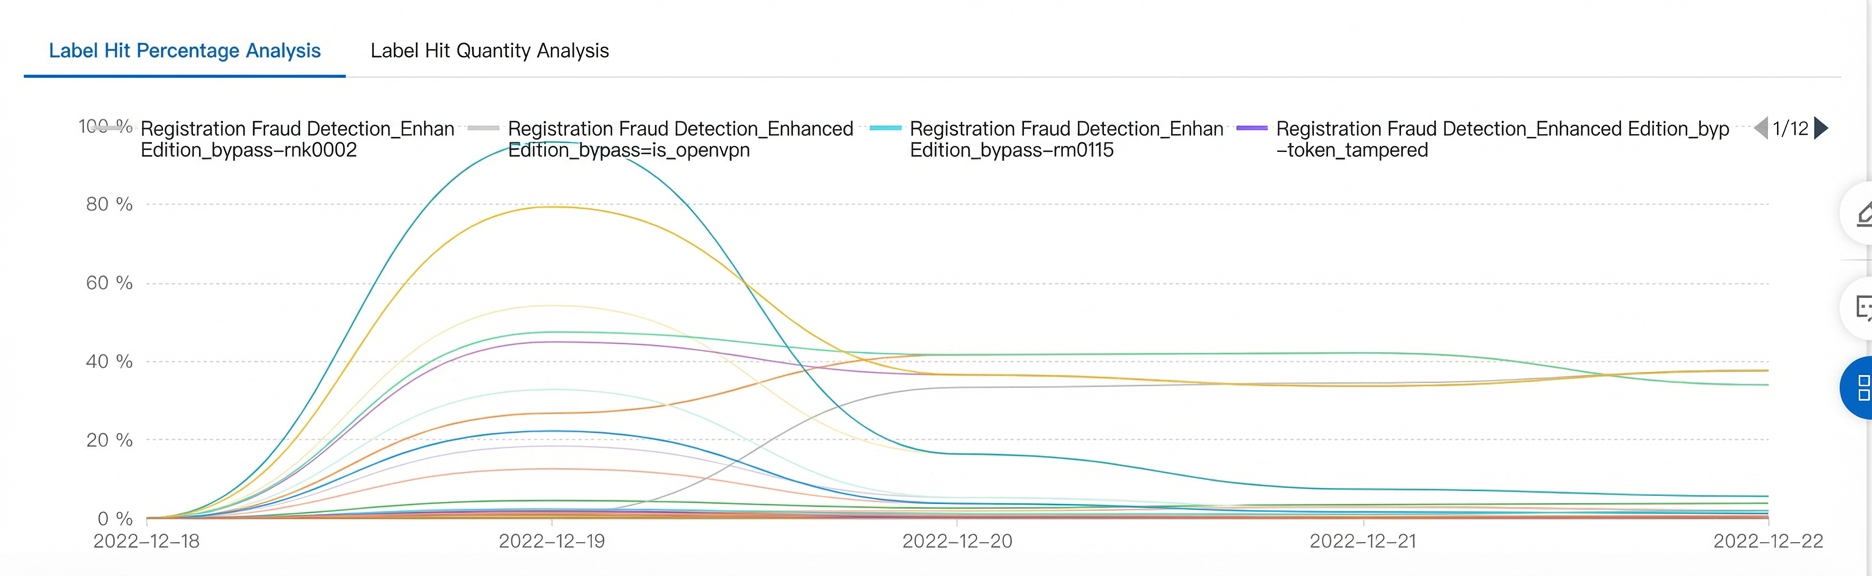
You can compare the effectiveness of the two policy sets by the proportion and count of tag hits.
-
By default, the line charts for all hit tags are displayed. Click a specific tag name to show or hide its chart.
Score analysis
-
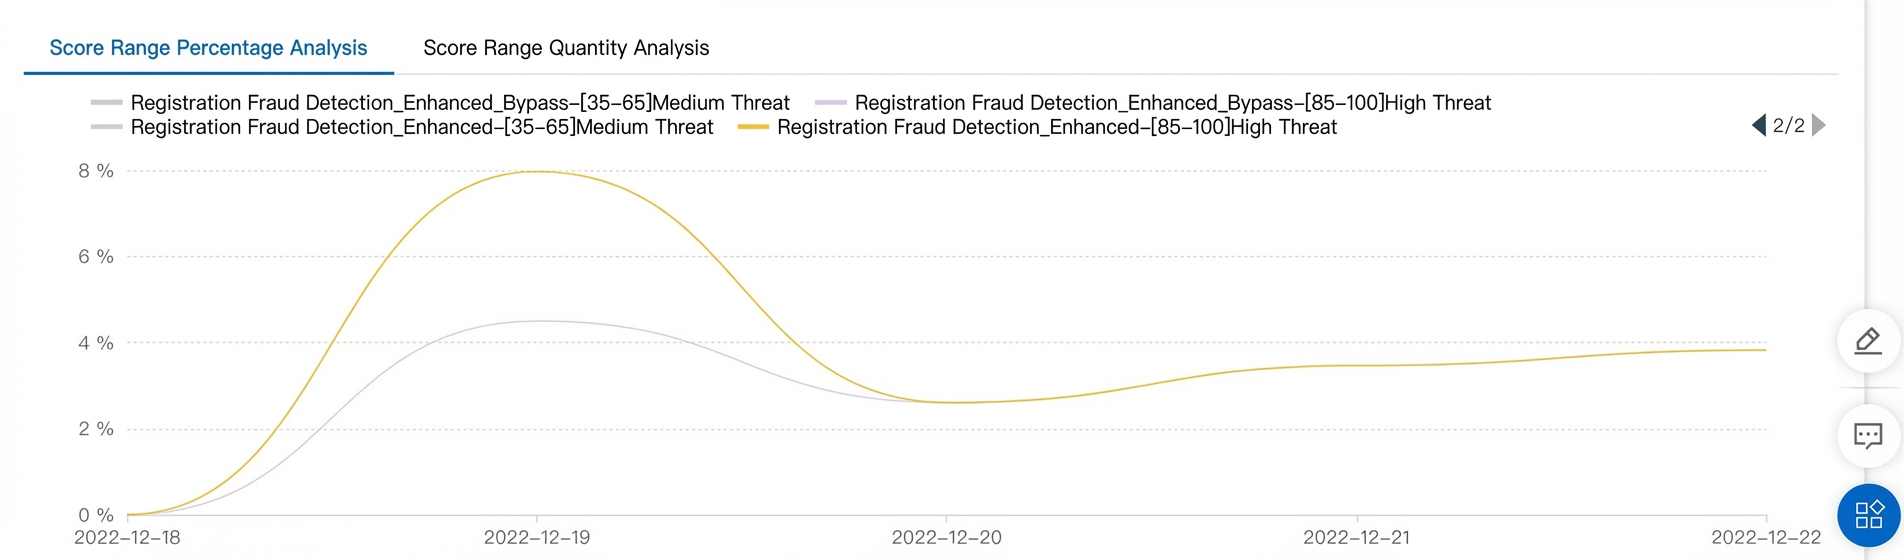
You can compare the effectiveness of the two policy sets based on the proportion and count for each score range.
-
The score ranges are as follows:
|
Score range |
Risk level |
|
[0, 35) |
low risk |
|
[35, 65) |
medium risk |
|
[65, 85) |
medium-high risk |
|
[85, 100] |
high risk |
-
By default, the line charts for all score ranges are displayed. Click a specific score range to show or hide its chart.
Score range proportions
-
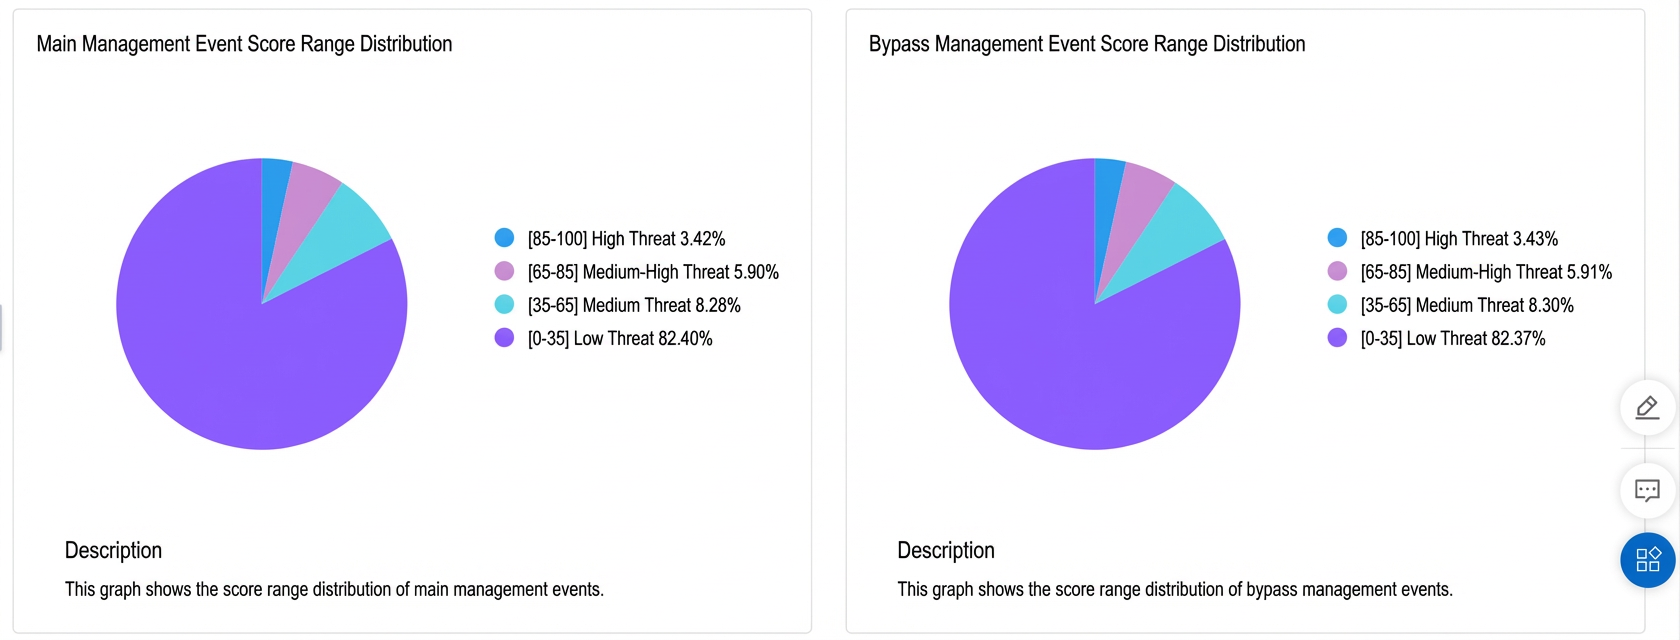
This section compares the proportions of score ranges for both policy sets.
Hit policy analysis
-
This section shows the hit counts for policies in both policy sets. By default, the top 20 policies with the most hits are displayed.
The analysis displays two tables: Top 20 policy hits for primary event and Top 20 policy hits for simulation event. Each table lists the policy names and their corresponding hits.