Managed Service for Grafana for ARMS includes the Alibaba Cloud Lindorm data source plugin by default. This plugin lets you synchronize Lindorm data and render it on Grafana dashboards in real time. You do not need to manually retrieve or migrate data. This topic describes how to use the Lindorm data source plugin to synchronize Lindorm data and create a dashboard panel.
Background information
LindormTSDB is a high-performance, cost-effective, stable, and reliable online time series database engine service. It provides efficient read and write operations, highly compressed storage, and aggregation and computing for time series data. For more information, see Engine introduction.
Step 1: Log on to Grafana
-
Log on to the Managed Service for Grafana console. In the left-side navigation pane, click Workspace Management.
-
On the Workspace Management page, find the workspace that you want to manage and click the URL in the URL column to go to Grafana.
NoteYou can log on to Grafana with the administrator account of Grafana and the password that you configured when you created the workspace. You can also click Sign in with Alibaba Cloud to log on to Grafana with the current Alibaba Cloud account.
Step 2: Configure the data source
Grafana 9.0.x version
In the left navigation pane of Grafana, go to
 > Data sources, and then click Add data source.
On the Add data source page, search for and click Alibaba Cloud Lindorm.
On the Settings tab, set the following parameters.
Configuration Item
Parameter
Required
Description
Name
Yes
Defines the name of the data source.
HTTP
URL
Yes
The HTTP endpoint of LindormTSDB. For more information about how to obtain the endpoint, see View the connection address of the time series engine.
ImportantIf your Grafana workspace and Lindorm instance are in the same virtual private cloud (VPC), use the private endpoint of LindormTSDB. Otherwise, use the public endpoint.
If you use the private endpoint of LindormTSDB, make sure that the private IP address of Grafana (the CIDR block of the vSwitch for the private endpoint) is added to the whitelist of Lindorm. If you use the public endpoint, make sure that the public IP address of Grafana is added to the whitelist of Lindorm.
Auth
Basic auth
No
If permission management and user authentication are enabled for LindormTSDB, turn on Basic auth and enter the username and password for logging on to LindormTSDB in the Basic Auth Details section. For more information about permission management and user authentication, see User and permission management.
Basic Auth Details
User
No
If you turn on Basic auth, you must enter the username for LindormTSDB.
Password
No
If you turn on Basic auth, you must enter the password for LindormTSDB.
Lindorm TSDB Details
Database
No
Enter the database of LindormTSDB that you want to access.
Click Save & test.
Grafana 10.0.x version
On the Grafana homepage, click the
 icon.
icon. In the left-side navigation pane, choose .
On the Data sources tab, click + Add new data source.
On the Add data source page, search for and click Alibaba Cloud Lindorm.
On the Settings tab, set the following parameters.
Configuration Item
Parameter
Required
Description
Name
Yes
Defines the name of the data source.
HTTP
URL
Yes
The HTTP endpoint of LindormTSDB. For more information about how to obtain the endpoint, see View the connection address of the time series engine.
ImportantIf your Grafana workspace and Lindorm instance are in the same virtual private cloud (VPC), use the private endpoint of LindormTSDB. Otherwise, use the public endpoint.
If you use the private endpoint of LindormTSDB, make sure that the private IP address of Grafana (the CIDR block of the vSwitch for the private endpoint) is added to the whitelist of Lindorm. If you use the public endpoint, make sure that the public IP address of Grafana is added to the whitelist of Lindorm.
Auth
Basic auth
No
If permission management and user authentication are enabled for LindormTSDB, turn on Basic auth and enter the username and password for logging on to LindormTSDB in the Basic Auth Details section. For more information about permission management and user authentication, see User and permission management.
Basic Auth Details
User
No
If you turn on Basic auth, you must enter the username for LindormTSDB.
Password
No
If you turn on Basic auth, you must enter the password for LindormTSDB.
Lindorm TSDB Details
Database
No
Enter the database of LindormTSDB that you want to access.
Click Save & test.
Step 3: Create a dashboard panel
After you add the Lindorm data source, you can use it to create a dashboard panel.
Grafana 9.0.x version
In the left-side navigation pane of Grafana, choose
 > New dashboard.
 On the New dashboard page, click Add a new panel.
On the Query tab of the Edit Panel page, in the Data source section, click the drop-down list and select the data source that you added in the previous step.
You can use one of the following two methods to query data.
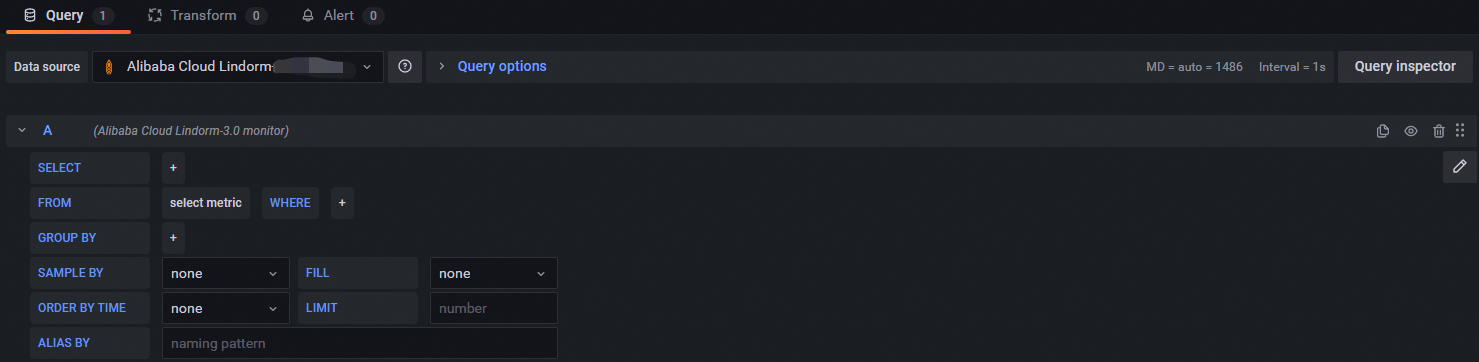
Querying with the editor: In the A section, select the data to query from the selection boxes. This method is for simple queries. The keywords are described in the following table.
Keyword
Description
SELECT
Select the field name to query.
FROM
Select the table name to query.
WHERE
Add a query condition.
GROUP BY
Add an aggregation condition.
SAMPLE BY
Select the downsampling interval. For more information, see Downsampling query.
FILL
Select a fill policy.
ORDER BY TIME
Select the sort order.
LIMIT
Enter the maximum number of data entries to return.
ALIAS BY
You can rename the timeline label.
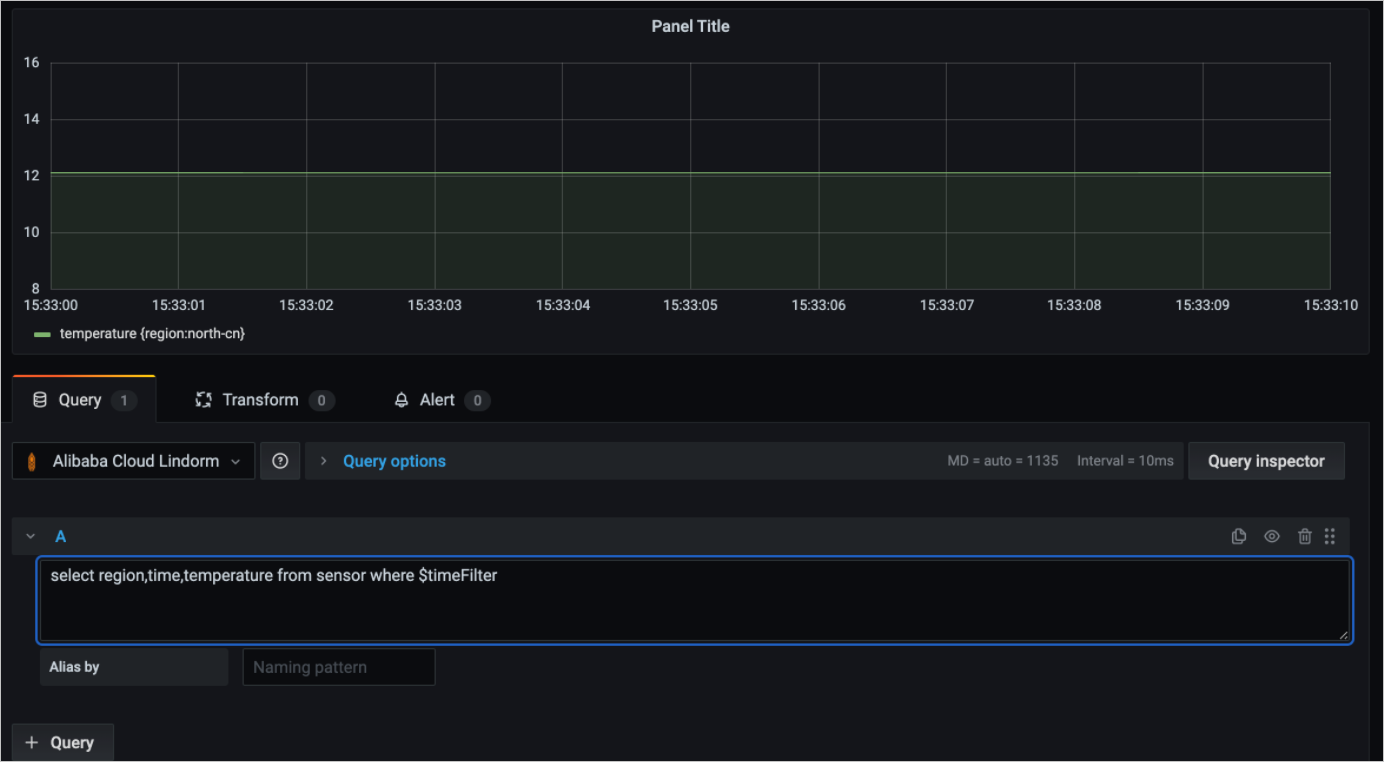
To query data using TSQL statements, click the
 icon in the upper-right corner of the A area. You can then enter TSQL statements to run complex queries, such as nested queries. The following figure shows the query results.
 Note
NoteFor more information about how to use TSQL statements, see SELECT syntax.
$timeFilterrepresents the time condition. It is automatically replaced with the time range selected on the page, defined astime>=xxx and time<=xxx.The
timefield is required. Otherwise, the analysis graph is not displayed.In a SELECT statement, use tags for grouping and aggregation on different time series.
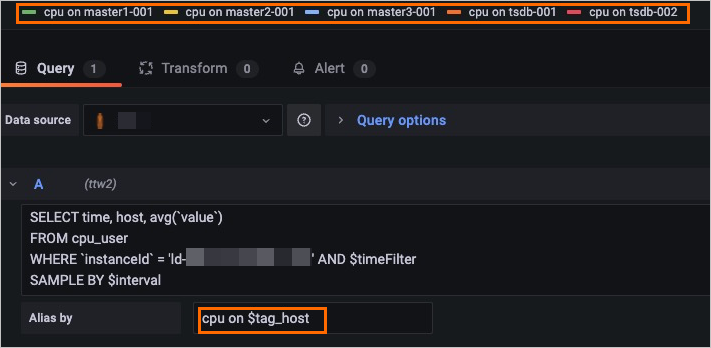
You can use Alias by to rename time series labels. For example, use
$tag_hostto distinguish between time series, as shown in the following figure.In a TSQL statement,
$intervalrepresents the downsampling interval. The following is an example statement:SELECT region,time,avg(temperature) FROM sensor WHERE $timeFilter SAMPLE BY $intervalNoteClick Query options. Use the Min interval and Max data points parameters to configure the Interval parameter.
In the right-side pane, specify the name, type, and graph styles of the chart.
Click Apply.
In the upper-right corner, click the
icon. Then, specify the name of the dashboard and the directory in which the dashboard resides. Click Save.

 icon. Then, specify the name of the dashboard and the directory in which the dashboard resides.
Grafana 10.0.x version
On the Grafana homepage, click the
icon. In the left-side navigation pane, click Dashboards. On the page that appears, select New dashboard from the New drop-down list.
On the New dashboard page, click + Add visualization.
In the Select data source dialog box, from the right side, select the data source that you added in the previous step.
You can use one of the following two methods to query data.
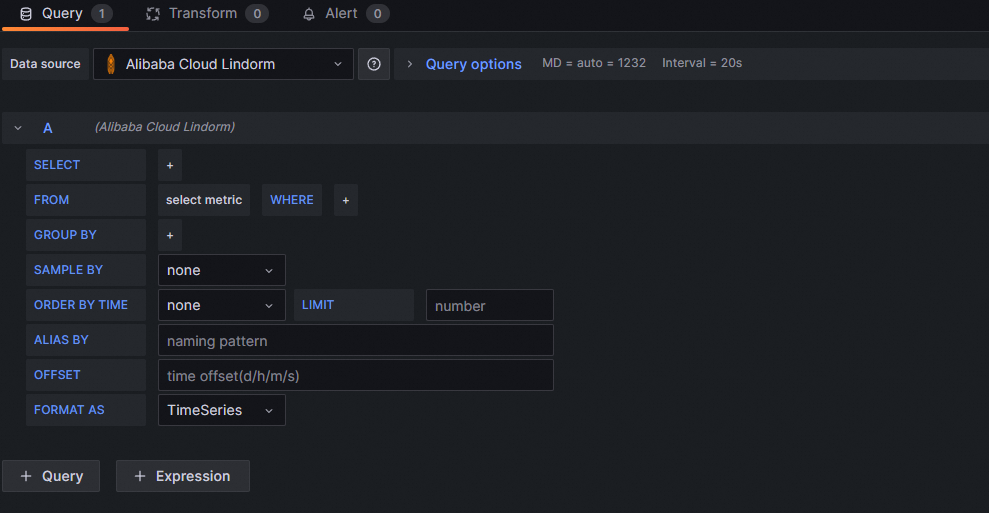
Querying with the editor: In the A section, select the data to query from the selection boxes. This method is for simple queries. The keywords are described in the following table.
Keyword
Description
SELECT
Select the field name to query.
FROM
Select the table name to query.
WHERE
Add a query condition.
GROUP BY
Add an aggregation condition.
SAMPLE BY
Select the downsampling interval. For more information, see Downsampling query.
FILL
Select a fill policy.
ORDER BY TIME
Select the sort order.
LIMIT
Enter the maximum number of data entries to return.
ALIAS BY
You can rename the timeline label.
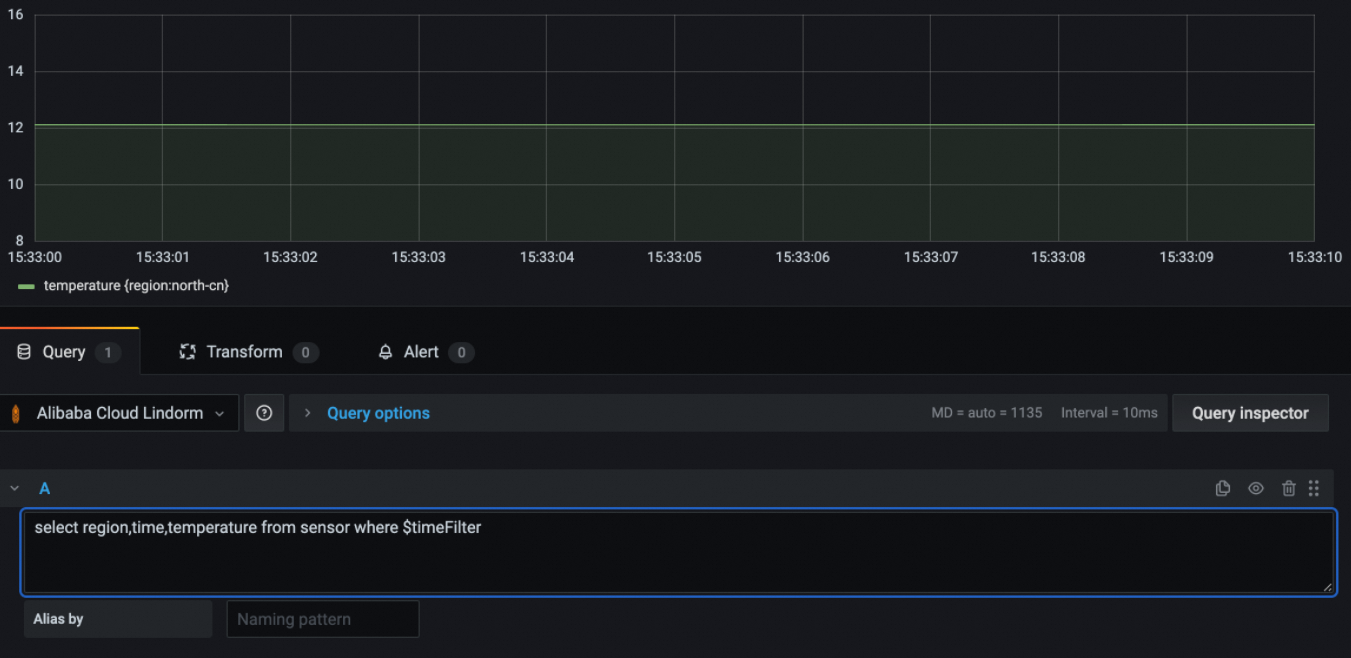
To query data using TSQL statements, click the
icon in the upper-right corner of the A area. You can then enter TSQL statements to run complex queries, such as nested queries. The following figure shows the query results.NoteFor more information about how to use TSQL statements, see SELECT syntax.
$timeFilterrepresents the time condition. It is automatically replaced with the time range selected on the page, defined astime>=xxx and time<=xxx.The
timefield is required. Otherwise, the analysis graph is not displayed.In a SELECT statement, use tags for grouping and aggregation on different time series.
You can use Alias by to rename time series labels. For example, use
$tag_hostto distinguish between time series, as shown in the following figure.In a TSQL statement,
$intervalrepresents the downsampling interval. The following is an example statement:SELECT region,time,avg(temperature) FROM sensor WHERE $timeFilter SAMPLE BY $intervalNoteClick Query options. Use the Min interval and Max data points parameters to configure the Interval parameter.
In the right-side pane, specify the name, type, and graph styles of the chart.
Click Apply.
In the upper-right corner, click the
icon. Then, specify the name of the dashboard and the directory in which the dashboard resides. Click Save.
Step 4: View monitoring data
Grafana 9.0.x version
In the navigation pane on the left on the Grafana page, click the
icon, and then click Browse.On the Browse tab, click the monitoring dashboard in the target folder to view all of its monitoring charts.
Grafana 10.0.x version
On the Grafana home page, click the
icon in the upper-left corner.In the navigation pane on the left, click Dashboards. Click the monitoring dashboard in the target folder to view all of its monitoring charts.