Host health diagnostics
The host management page in IoT Edge provides a health diagnostics feature for your hosts. This feature comprehensively diagnoses the host's system configuration, runtime status, software runtime status, network status, and historical runtime status. This helps you understand the health of your hosts and promptly identify and resolve common issues.
Limits
The host health diagnostics feature is supported only for hosts that are EDGEBOX nodes or converged nodes with a Kubernetes (k8s) base.
Procedure
You can log on to the IoT Edge console.
In the navigation pane on the left, you can select your instance from the drop-down list.
In the navigation pane on the left, you can choose Node Management > Host Management.
In the Actions column for the target host, you can click Host Details.
On the host details page, you can click the Health Diagnostics tab and then click Start Diagnostics.
The diagnosis covers five areas: system configuration, system runtime status, system software runtime status, host network status, and host historical runtime status. The process takes about 2 minutes.
NoteIf the k8s-launcher for your host base is missing, the interface prompts you to upgrade. You must perform the upgrade before you can run the health diagnostics.
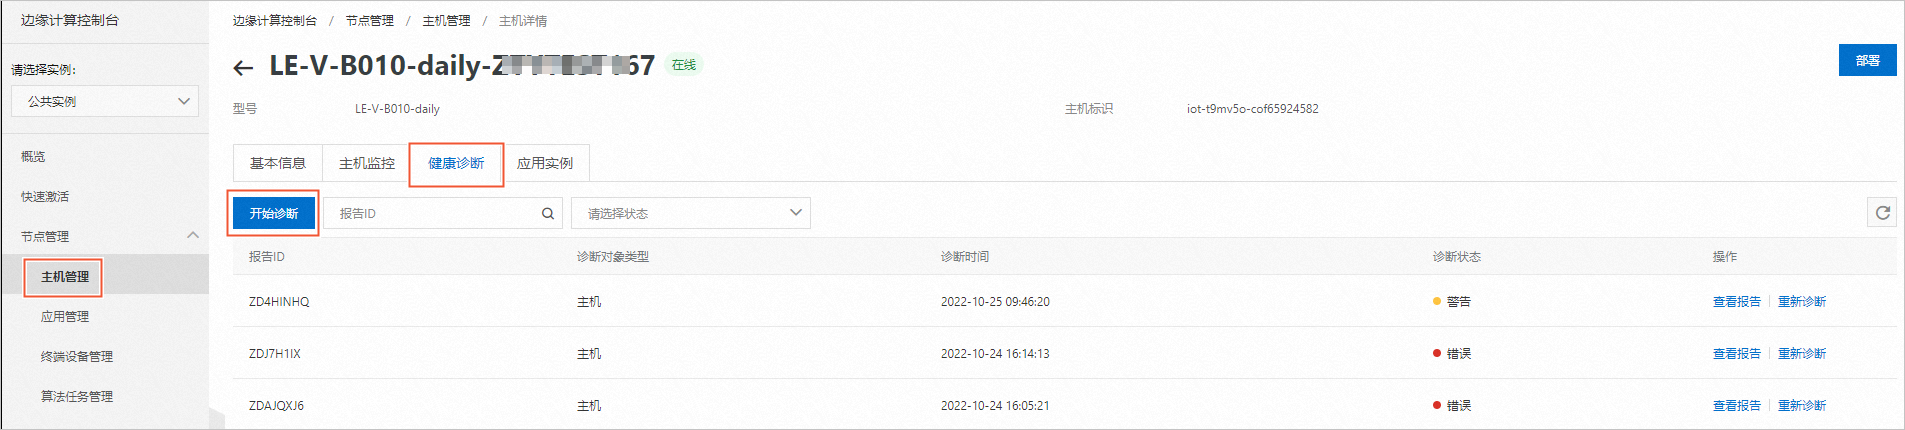
After the diagnostics are complete, you can click View Report to see the results. You can then fix any issues based on the provided results and suggestions.
System configuration diagnostics
Diagnostic Item |
Description |
Kernel parameter check |
The recommended values for kernel parameters are as follows:
Use commands to adjust the parameters as needed. Example command: Set net.ipv4.conf.all.arp_announce to 2. |
SELinux check |
Checks if Security-Enhanced Linux (SELinux) is disabled. If SELinux is not disabled, run the following command to disable it. |
Swap partition check |
Checks if the Swap partition is turned off. If the Swap partition is not turned off, run the following command to turn it off. |
CPU operating mode check |
Checks if the CPU is set to high-performance mode (interactive). |
IPv6 DNS check |
Checks if the If it does, edit the file manually to fix it. |
System runtime status diagnostics
Diagnostic Item |
Diagnostic Result |
Solution |
CPU load check |
High system load |
A higher load value indicates a longer task queue and more tasks waiting for execution. You can use the Investigate as follows:
|
CPU temperature check |
High CPU temperature |
Confirm the following:
If these are not the issues, the cause might be a slow fan speed or other hardware problems. |
Memory usage diagnostics |
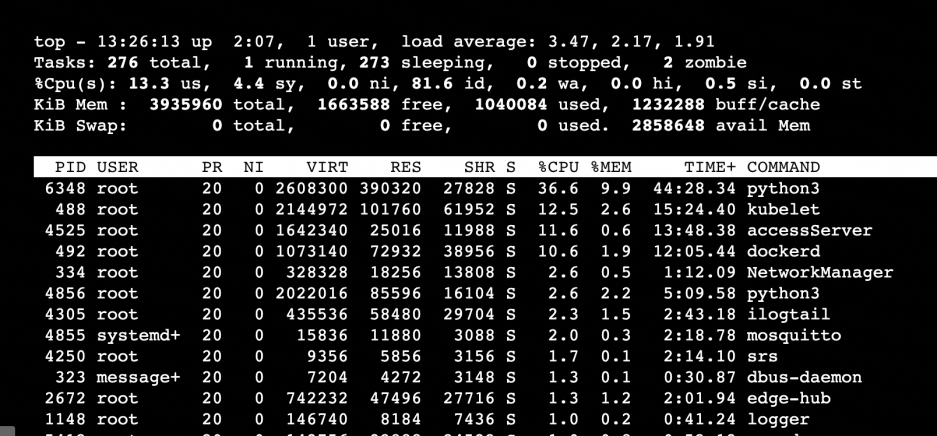
High memory or CPU usage |
If a host's memory or CPU usage remains high, it can affect system stability and business operations. For a Linux system, you can handle this as follows. In Linux, you can use common commands such as vmstat, top, ps -aux, and ps -ef to view system processes. The following steps describe how to use the top command to find processes that cause high memory or CPU usage.
|
CPU usage diagnostics |
||
Disk usage check |
High disk space usage |
Use the command For a long-term solution, analyze the cause of the large files and optimize, or scale out the disk. Common causes of high disk usage include not setting a log rollback policy or setting an unreasonable one, and not cleaning up historical files promptly. These issues cause disk usage to rise continuously. When it reaches a certain threshold, it can cause system or application abnormalities. |
Disk inode usage check |
High disk inode usage |
This is caused by too many small files on the system. Clean up the small files promptly. Otherwise, you risk being unable to create new files.
|
PID and thread usage check |
PID and thread limits reached |
The current number of processes in the system has reached the maximum limit. If this occurs, new system processes cannot be created. |
File system read/write check |
Unable to read or write files |
Try creating a file on the host. If you see a
If none of these are the issue, the cause might be disk or file system corruption. |
Zombie process check |
Zombie processes found |
The following command shows the zombie processes that exist on the system: Zombie processes cannot be stopped and cannot exit on their own. They can only be resolved by recovering their dependent resources or by restarting the system. If you choose to restart the system to resolve zombie processes, first ensure that the restart will not affect your business operations. |
Host network status diagnostics
Diagnostic Result |
Solution |
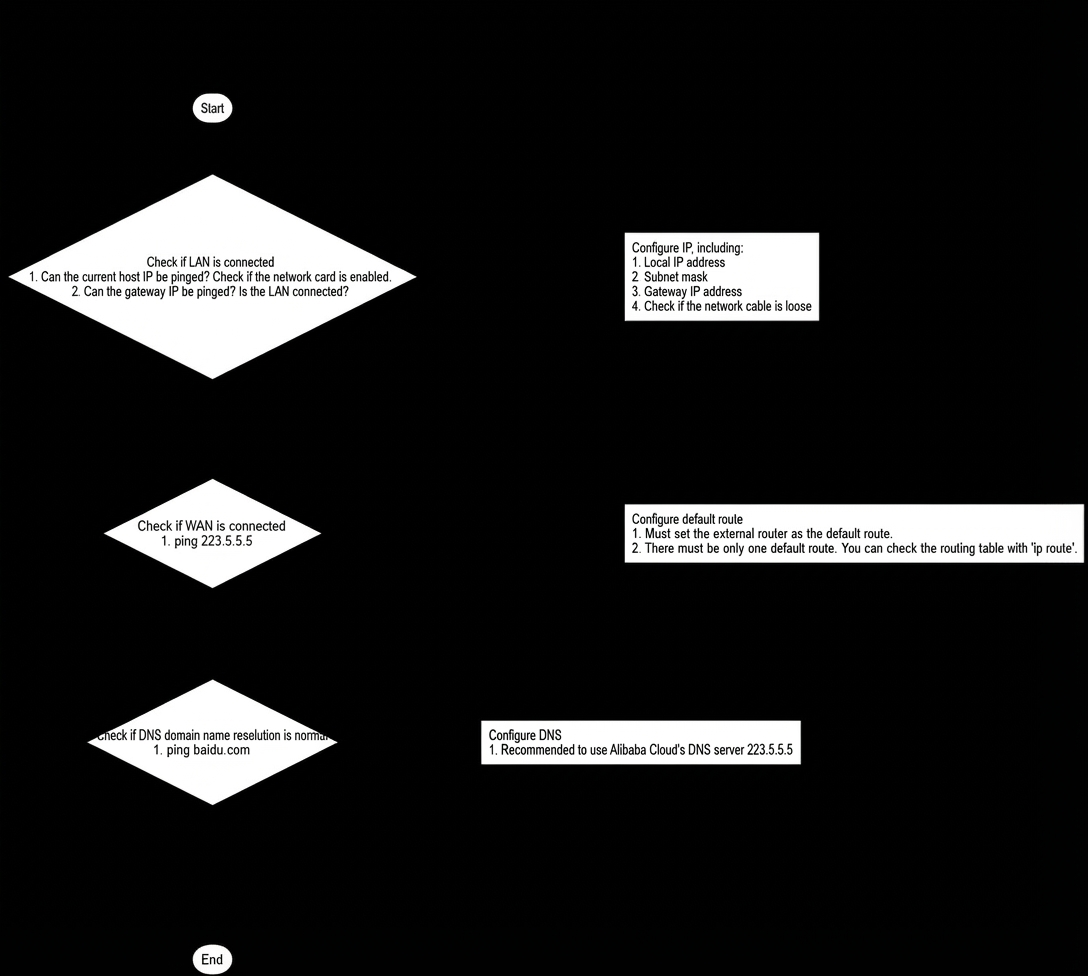
Network connection failed |
The troubleshooting process is as follows:
The process is illustrated in the following diagram: |
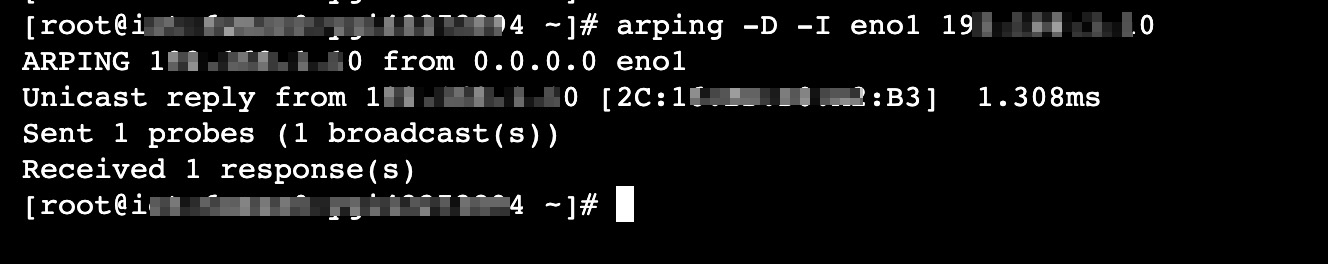
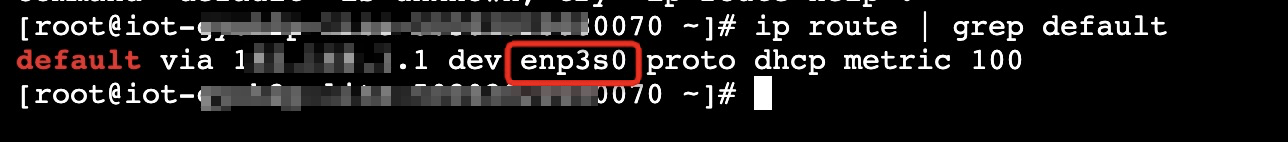
IP conflict |
On the host where the IP address conflict was detected, run the
|
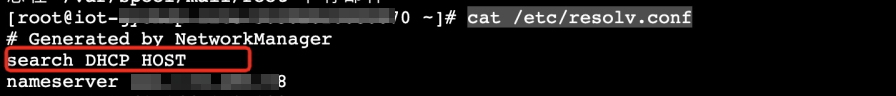
DHCP search domain injection exists |
Check the host file Try the following steps to resolve the issue:
|
Host software runtime status diagnostics
Diagnostic Result |
Solution |
System service not running |
To ensure that the all-in-one machine can provide services normally, the following system services must be running: kubelet, docker, containerd, LinkIoTEdge, NetworkManager, sshd, dbus You can use the following commands to query the running status of a system service. If a service is not running, you can start it manually. |
Firewall is enabled |
Use the following commands to stop and disable the firewall. |
Docker is hanging |
If you find that Docker is unresponsive, try restarting the Docker service by running the |
Container has a storage leak |
This is a known issue in the open source software. You can run the following script to clean up unused container storage layers.
Note
If not cleaned, this will occupy extra disk space. It will not affect system operation if disk usage is low. You can decide whether to clean it up as needed. |