Message trace
Simple Log Service for IoT Platform lets you view message traces for device communication. You can use a TraceID or MessageId to trace the full path of any message that flows through IoT Platform. You can also use the trace to quickly analyze and locate issues based on failed nodes. This topic describes how to view a message trace.
Limitations
Only Enterprise instances and new public instances in the China region support message traces.
Procedure
Log on to the IoT Platform console.
On the Overview page, find the instance that you want to manage and click the instance ID or instance name.
- In the navigation pane on the left, choose . On the IoT Platform logs tab, find the TraceID or MessageId of the message that you want to trace.
- Click Message Trace. In the search box, enter the TraceID or MessageId.
- Click the search
 icon on the right to view the trail map.
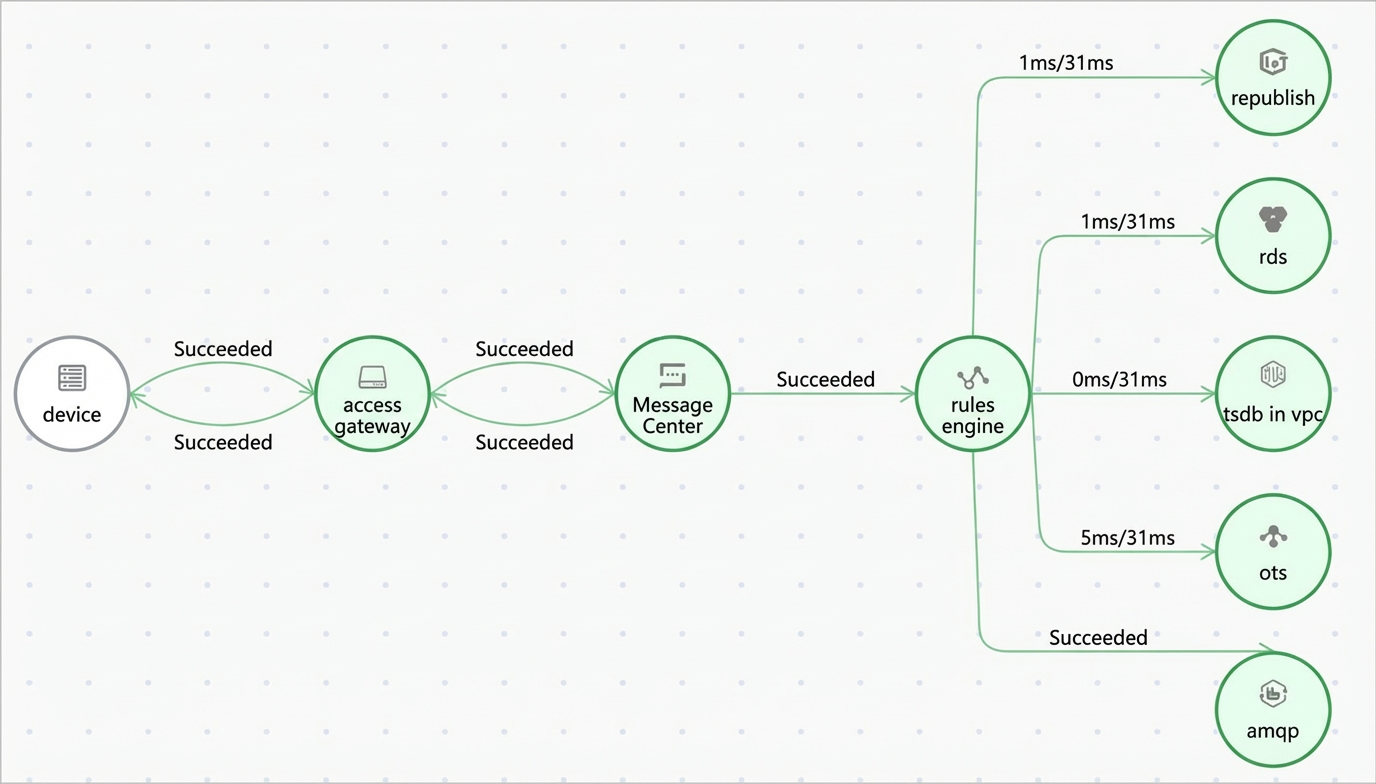
- The trail map consists of communication node icons and connecting lines. Green indicates a successful communication flow. Red indicates a failure.
- Hover over a communication node to view the communication time, success information, or failure reason.
For example, for data reported by a home thermostat product, a data forwarding rule is configured as follows:SQL statement for data processing:
SELECT
items.temperature.value as temperature,
items.humidity.value as humidity,
deviceName() as deviceName,
timestamp() as time
FROM "/g***/TH_sensor/thing/event/property/post"
The rule forwards the temperature, humidity, deviceName, and time data as follows:
- The data is inserted into Tablestore, with the primary key set to
${deviceName}. - The data is published to the Default Consumer Group AMQP server-side subscription consumer group.
- The data is stored in the time series database within the instance, and Metric Data Type is set to Numeric.
- The data is inserted into ApsaraDB RDS, where the time field in the database table is set as the auto-incrementing primary key.
- The data is published to another topic:
/g***/TH_sensor/user/update.
For more information, see Set data forwarding rules.
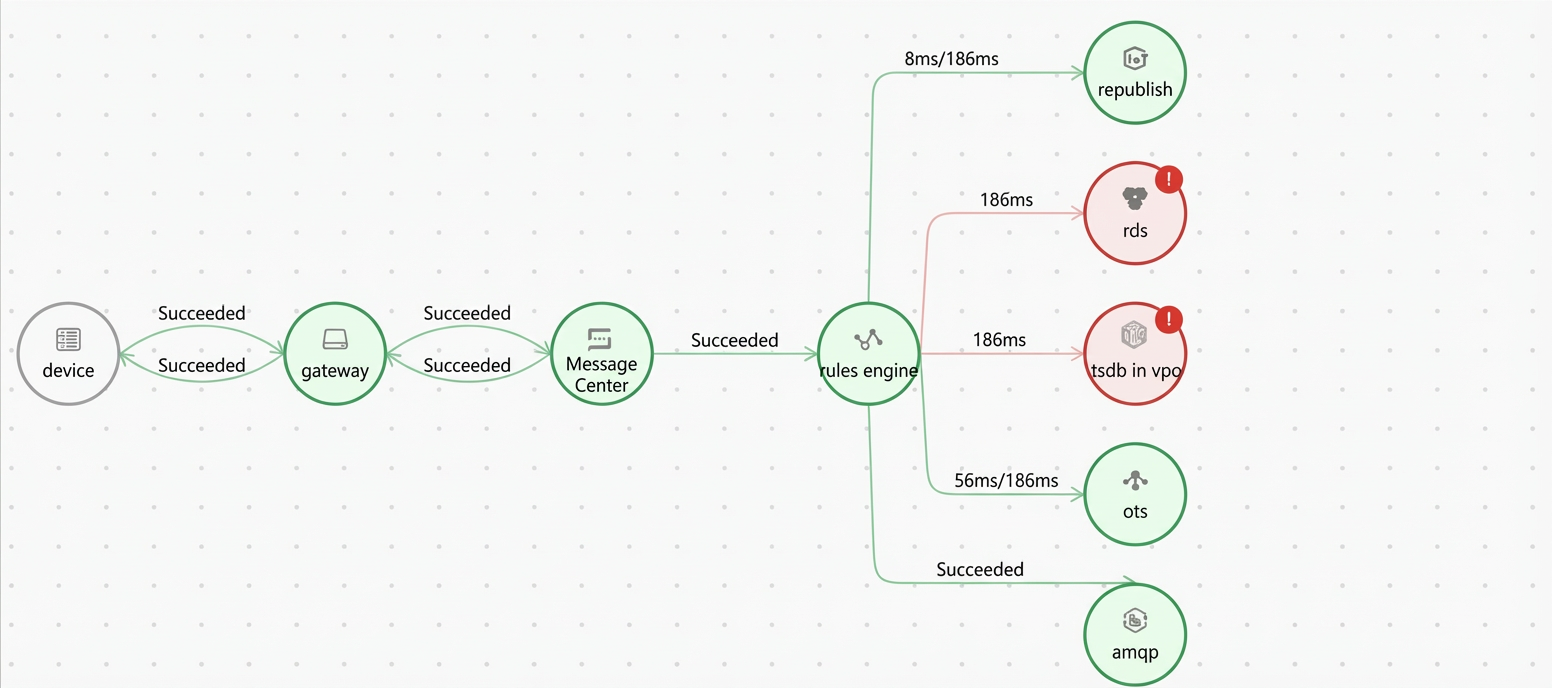
After the device reports data, the message trace shows the following results for the data forwarding operations:
- Messages are successfully processed when they are published to another Topic (republish), inserted into Tablestore (ots), or published to an AMQP server-side subscription consumer group.
- Writing data to the time series database in an instance (tsdb in vpc) with invalid parameters, or inserting data into ApsaraDB (RDS) with an abnormal product configuration will cause message processing to fail.
What to do next
If you find a failed node in the communication trace, troubleshoot and fix the issue based on the failure reason. For more information about troubleshooting methods, see the error code descriptions in IoT Platform logs.Based on the preceding example trail map, go to the page. Find the forwarding rule that corresponds to the ruleName and correct the failed forwarding operations:
- To store data in the time series database within the instance, change Metric Data Type to String.
- To insert data into ApsaraDB RDS, remove the primary key setting from the time field in the database table.
After the device reports data again, view the message trace. You will see that the message is processed successfully.