Test results
Updated at:
This page shows throughput and average response time (RT) benchmarks for the Lindorm search engine. Use this data as a reference when evaluating whether Lindorm meets your performance requirements or planning cluster capacity. Because results vary with data characteristics, query patterns, and cluster configuration, run a stress test against your own data before finalizing your setup.
RT (response time) measures the end-to-end duration from when a request is submitted to when the complete response is received, including any queue waiting time.
Test results for write operations
Test configuration
| Parameter | Value |
|---|---|
| Shards | 2 |
| Replicas | 1 |
| Fields written per document | 20 (10 LONG, 10 STRING) |
| Average row size | 200 bytes |
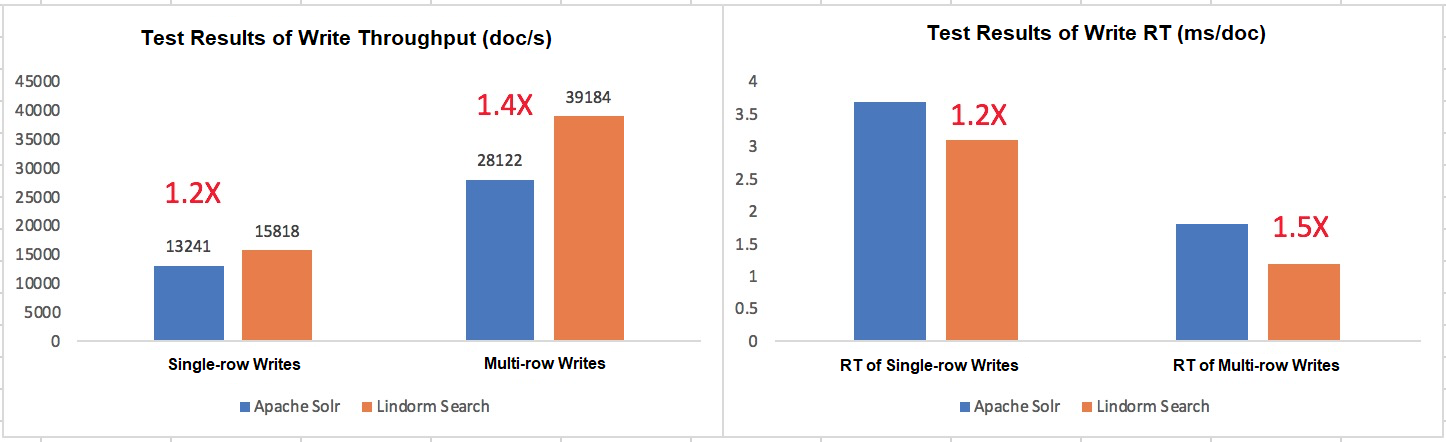
The chart below shows write throughput (QPS) against average RT as concurrent load increases.
Test results for query throughput
Test configuration
| Parameter | Value |
|---|---|
| Shards | 1 |
| Replicas | 1 |
| Dataset size | 500 million rows |
| Query conditions | Single field; combination of multiple fields |
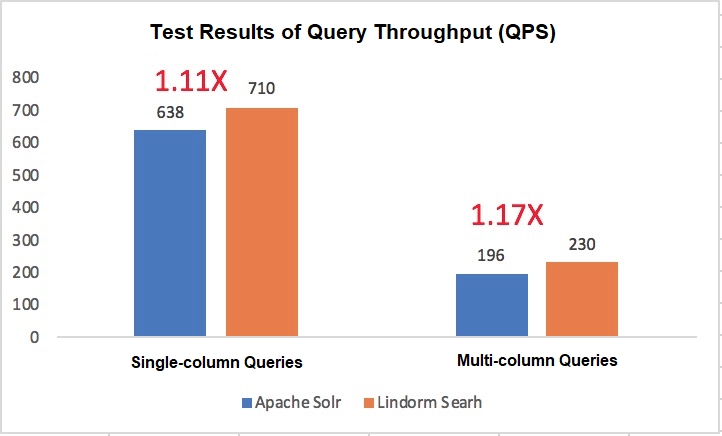
The chart below shows query throughput (QPS) for both single-field and multi-field queries.
Is this page helpful?