Integration flow operational logs
This topic describes how to view the operational logs for an integration flow from the run history panel.
Function introduction
Operational logs for integration flows provide transparency and traceability, and simplify troubleshooting for your workflows. The system automatically records key nodes and parameter details for the entire lifecycle of an integration flow. This creates a complete execution record for developers and business users. This record helps you orchestrate and use integration flows.
Details of the integration flow run history panel
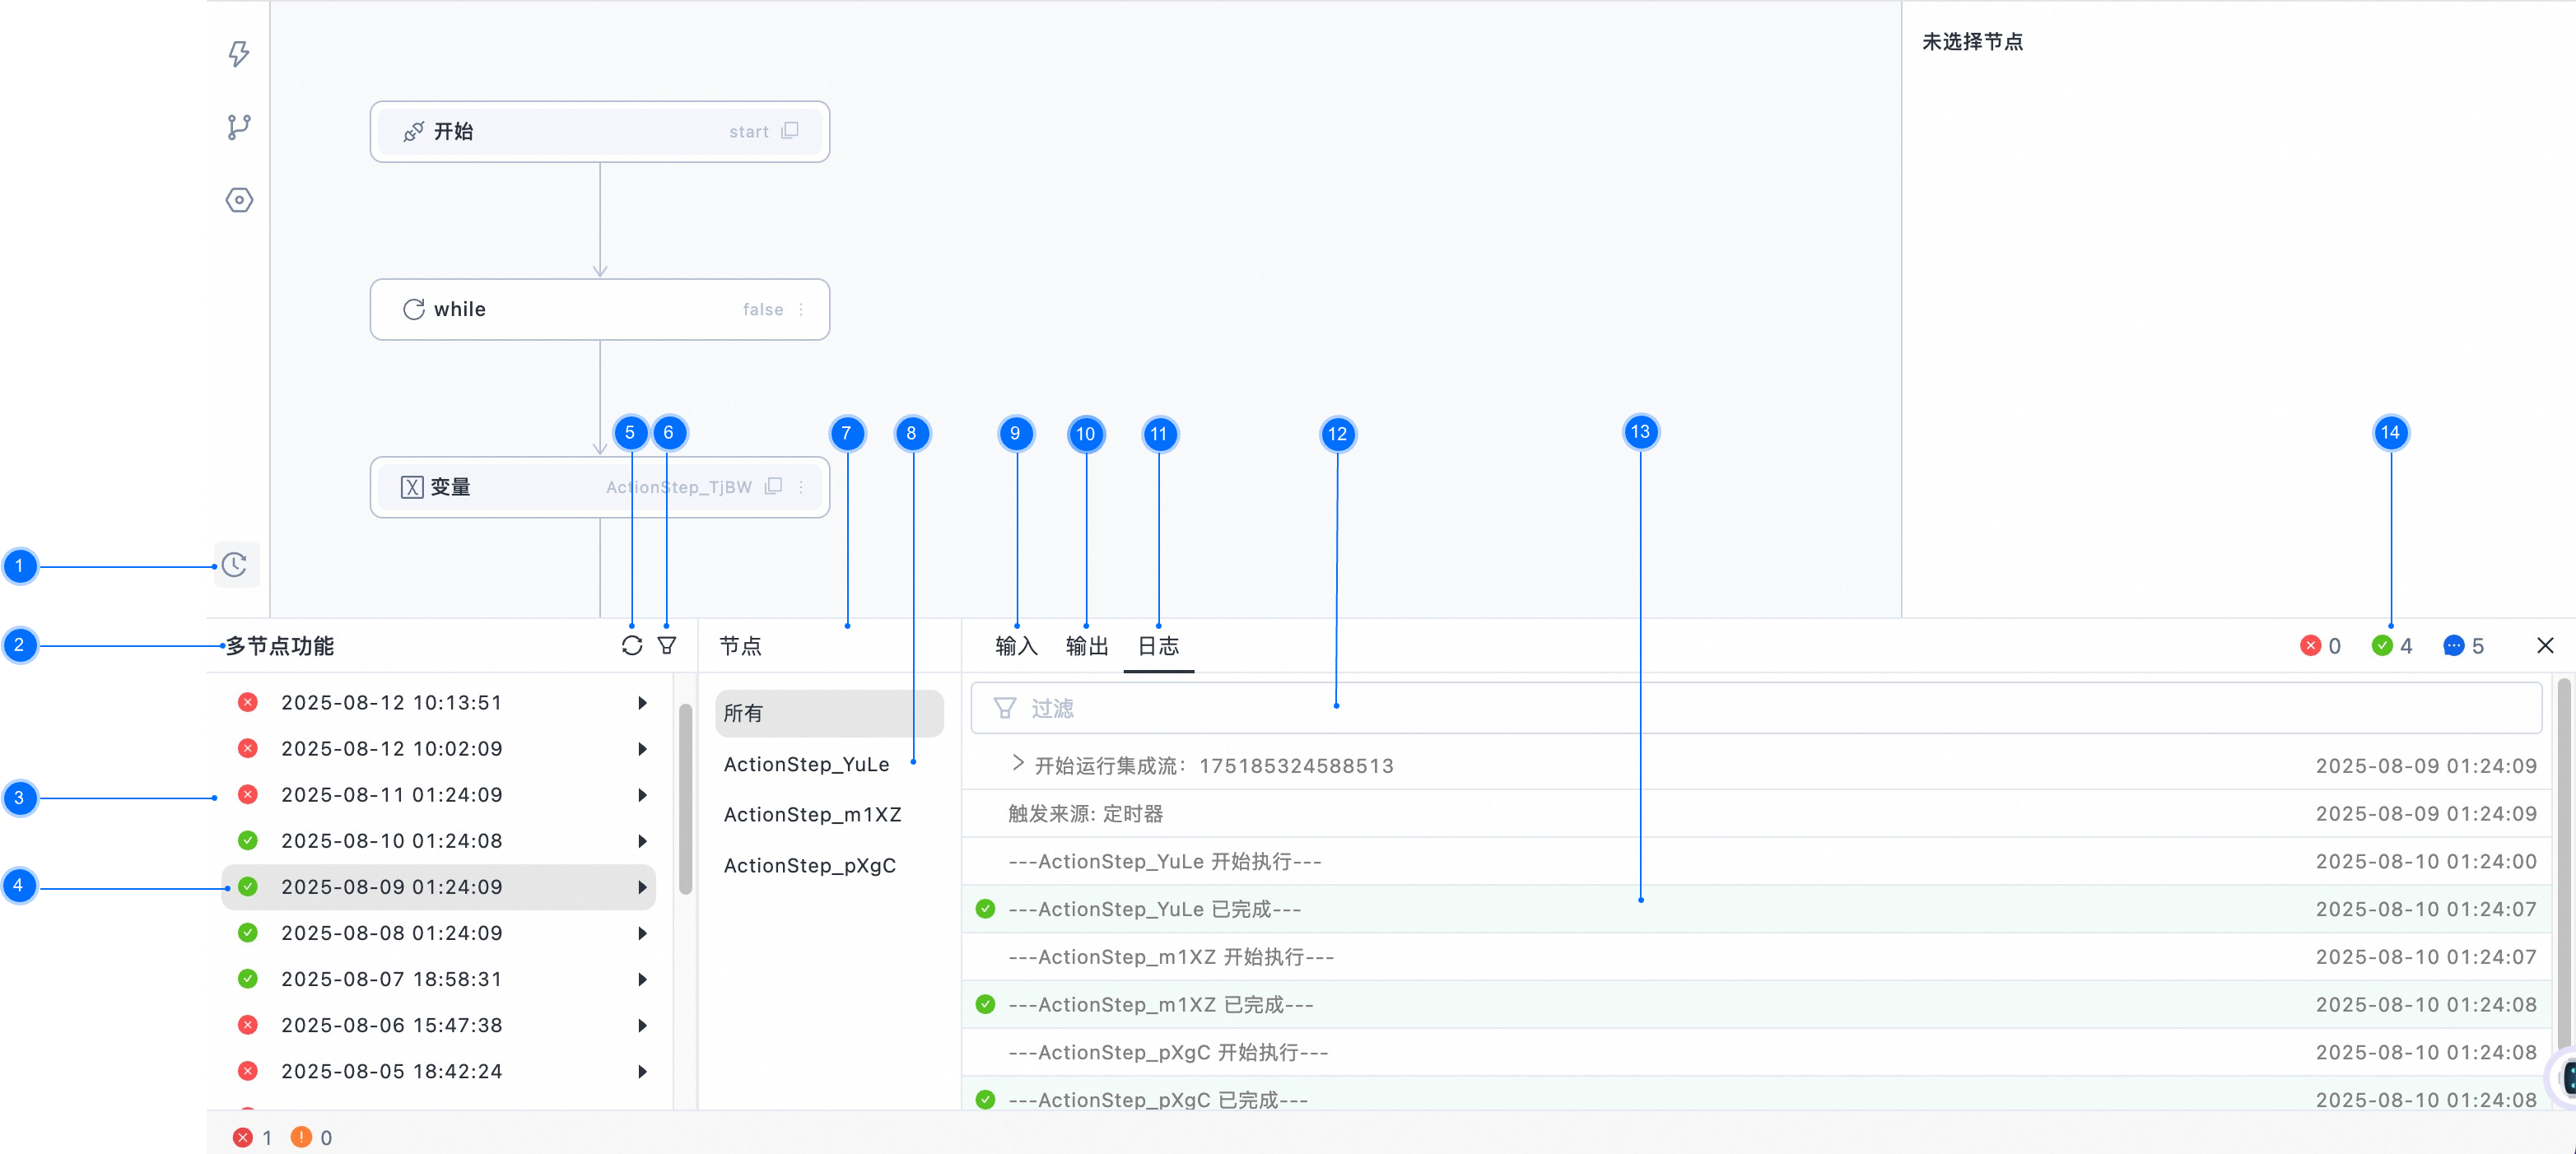
The following sections describe the components of the integration flow run history panel.
Label |
Name |
Description |
1 |
Run history panel entry point |
Click to show or hide the run history panel. |
2 |
Integration flow name |
The name of the current integration flow. |
3 |
List of integration flow running instances |
Scroll down to load more history records. |
4 |
Integration flow running instance |
Shows the running status and start time of the instance. |
5 |
Refresh running instance list |
Click to get the latest list of running instances. |
6 |
Running instance list filter |
Filter the list by multiple dimensions. |
7 |
Task node list |
The integration nodes in the integration flow. |
8 |
Task node |
Click a task node to show its related content in the Input, Output, and Log panels on the right. |
9 |
Input parameters panel |
Click to show the input parameters panel. |
10 |
Output results panel |
Click to show the output results panel. |
11 |
Log panel |
Click to show the log panel. |
12 |
Log text filter |
Filters for logs that contain specific keywords. |
13 |
Log entry |
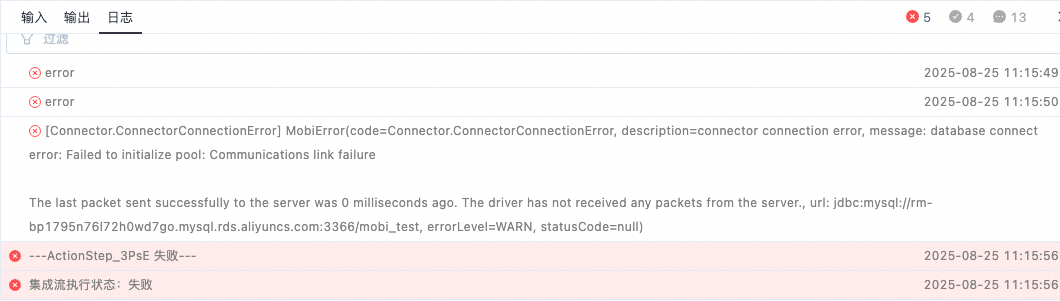
Shows a system or user log. A log entry includes the log content and the time it was created. |
14 |
Log level filter |
Filter logs by level: Success, Failure, or Information. |
Integration flow running instance list
Each time an integration flow runs, a run history record is created. Click an instance in the list to view its input, output, and log information.
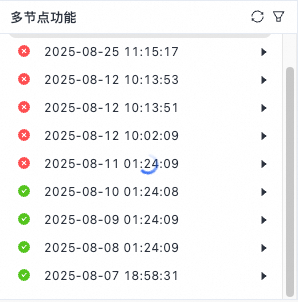
Get more running instances
The list loads more instances as you scroll. Scroll down to automatically load earlier history records.
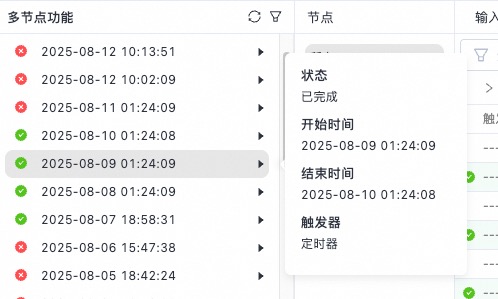
Instance information
Hover over an instance in the list to view its status, start time, end time, and trigger type on the right.
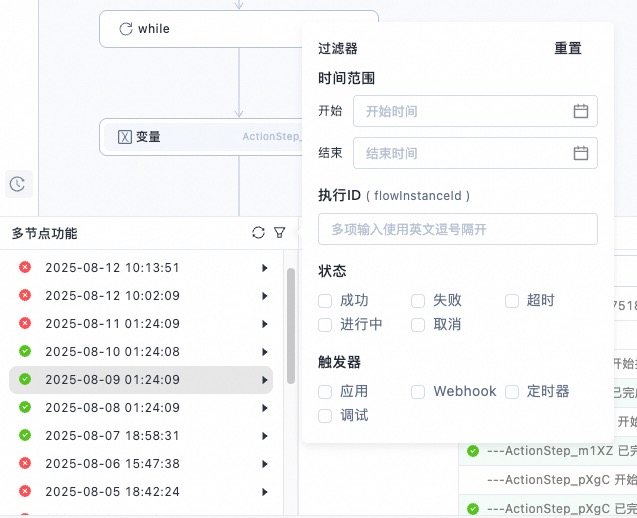
List filter
You can use the list filter to find run records that meet specific conditions. If no filter is applied, all records are displayed by default.
Click Reset to display all records.
Input and output panels
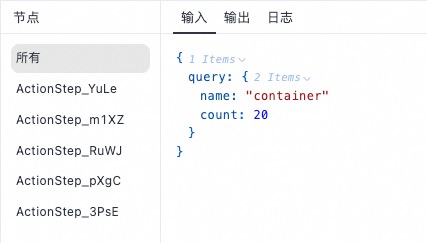
Input parameters
The panel displays input parameters in JSON format. When all nodes are selected, the displayed parameters are the flow's trigger parameters. When a specific execution node is selected, the displayed parameters are the input parameters for that node.
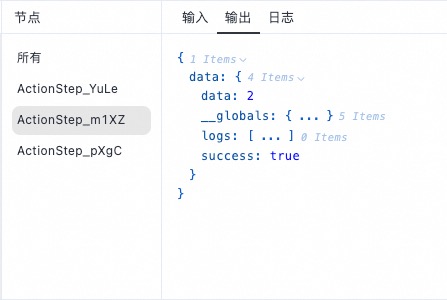
Output results
The panel displays output results in JSON format. When all nodes are selected, the displayed output is the final result of the integration flow. When a specific execution node is selected, the displayed output is the response parameter for that node.
Log panel
Keyword filter
You can filter the log list by keyword.
Log level filter
By default, the log panel displays logs of all levels. Click the level filter in the upper-right corner to display logs of a specific level.
Script support
Integration flows support log output at different levels using JavaScript and Python.
The following user-level log functions are supported:
Error: error
Warning: warn
Information: log
Debug: debug
In a node script, you can output logs as follows.
console.log('log');
console.info('info');
console.warn('warn');
console.error('error');
# The logging object already exists in the context. You do not need to import logging.
logging.debug('debug');
logging.info('info');
logging.warning('warn');
logging.error('error');The icon for each type is as follows: