Note: This topic is adapted from a presentation titled "Building a Highly Reliable and High-Performance React Isomorphic Solution" at the 12th D2 Frontend Technology Forum. All data has been masked for confidentiality.
This topic was originally published on the Beidou Isomorphic GitHub. Please provide attribution if you republish this content.
Cainiao Logistics Marketplace is a line-of-business within Cainiao. You can think of it as the Taobao of the logistics industry. It is a platform that connects logistics service requesters with service providers. Its pages, such as the search page, product page, and Buyer Center, are developed using the beidou isomorphic framework. As technologies such as Node.js and React isomorphic applications become more widespread, memory leaks occur more frequently and require serious attention. I recently encountered such an issue while providing technical support for Cainiao Logistics Marketplace. I have compiled my experiences and the lessons learned from this process for your reference.
First, let's define some basic terms:
SSR: Server-side rendering. In short, SSR renders a page on the server and sends it directly to the browser to improve the initial display performance.
Isomorphic: Building on SSR, an isomorphic application can be rendered on both the server and the browser. This means a single codebase runs on both ends.
Beidou: A React isomorphic framework based on eggjs. It is open source.
Memory leak: A memory leak occurs when a program's dynamically allocated heap memory is not released or cannot be released for some reason. Memory leaks are usually caused by logical errors in the application layer code.
OOM: Out-of-memory. In simple terms, this means all available memory has been consumed and no more can be allocated. Memory leaks are the most common cause of OOM. The direct consequence of an OOM event is a process crash.
RSS: Resident Set Size. This is the amount of physical memory in use, including memory occupied by shared libraries.
Case study
Let's return to the Cainiao Logistics Marketplace case.
Identifying the problem
After Cainiao Logistics Marketplace went online, we frequently received alert notifications from Alimonitor, as shown in the following figure:

I opened the Node.js Performance Platform to check the slow query logs. As expected, there were many slow query log records:

Analysis, verification, and investigation
Analysis
At the time, we observed the following:
The product page sometimes loaded quickly, but other times it took 4 to 5 seconds.
Performance improved significantly after a restart, with very fast response times.
Machine load sampling: CPU consumption was low, but memory consumption was as high as 53.5%.
Based on these observations, I performed a simple analysis and outlined the following actions:
Slow response: This could be caused by a slow HSF interface or slow rendering. Action: Add separate tracking points to record logs.
Inconsistent speed: The condition of different machines might vary, causing large differences in response times. Action: Compare the load conditions of each machine.
Fast speed after restart: An event may have occurred that degraded performance. This points to a memory leak. Action: Analyze heap snapshots using the Node.js Performance Platform.
Low CPU and high memory consumption: A memory leak is highly likely. Action: Analyze heap snapshots using the Node.js Performance Platform.
Based on these deductions, a memory leak was highly probable. However, this hypothesis needed to be verified with actual data. Therefore, I proceeded with data collection according to the outlined actions.
Verification
After another deployment, I collected the following data:

The figure shows that as time passed, the HSF call duration for process 1694 remained stable. However, the server-side rendering time gradually soared to over 3,700 ms. Then, after reaching a critical value, it instantly dropped to around 50 ms. This was likely due to an event that caused the process to crash. I suspected an out-of-memory (OOM) event caused by a memory leak. The beidou framework then automatically restarted the process, restoring it to a healthy state. Checking the process lifecycle in the sandbox confirmed my suspicion. Process 1694 had crashed and was replaced by a new process, 29649.

The figure also shows that the Resident Set Size (RSS), which is the actual physical memory in use, reached as high as 1880.93 MB. At this point, it was almost certain that there was a memory leak. The memory usage curve shows a sawtooth pattern. Memory usage rises steadily, drops sharply after hitting a critical point, and then repeats the cycle. This pattern perfectly matched my deduction and is characteristic of a memory leak.

Final conclusion: The slow access speed was caused by a memory leak that consumed excessive resources.
Investigation
After I identified the memory leak, the next step was to find the specific code that caused it. This is where a powerful tool, the Node.js Performance Platform, comes in.
First, you can create a heap snapshot:

On the analysis page, open the Object cluster view. You can see many Window objects. A search revealed as many as 390 of them:

I sampled a few Window objects and expanded them using GC Root. I found that countless timers were attached. 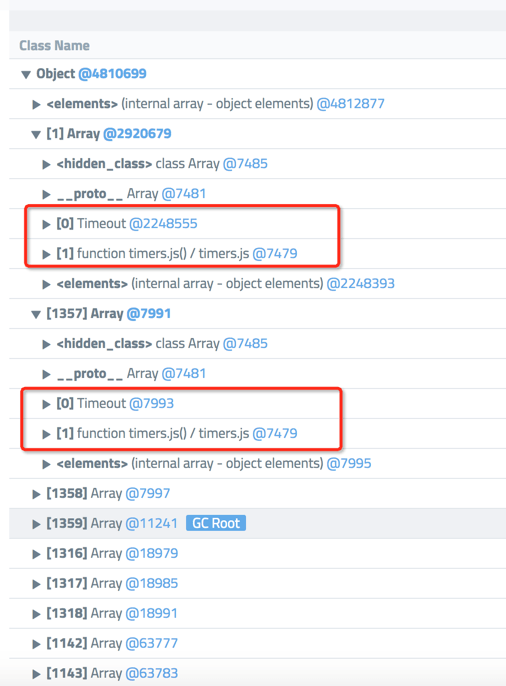
By analyzing the code, I found two places where timers were set. Based on the code logic, these timers would never be released on the server-side.
componentWillMount(){
        let _this = this;
        window.handler = window.setInterval(function(){
            if(typeof AMap){
                _this.renderMap('', AMap);
                window.clearInterval(window.handler);
            }
        }, 300);
    }
After I commented out this code and verified it in the pre-release environment, the window-related memory leak no longer occurred.
P.S.
Later verification revealed two other memory leaks in addition to the timer issue. I will not go into detail, but the following code for one of them (related to AMAP) is provided for your reference:
    componentWillMount(){
        this.createAmapScript();
    }

    createAmapScript(){
        let script = document.createElement('script'),
            body = document.getElementsByTagName('body')[0];
        script.type = 'text/javascript';
        script.src = 'https://webapi.amap.com/maps?v=1.3&key=59699a8cfee7c52f58390357cbdbf27d';
        body.appendChild(script);
    }
Solving the problem
From the two code snippets above, it is clear that the timer does not need to run on the server-side. Also, AMAP itself does not support server-side rendering. Therefore, both operations can be moved to client-side rendering. In React, the componentDidMount lifecycle function does not execute on the server-side. Therefore, moving the code from componentWillMount to componentDidMount solves the problem.
The specific fix is as follows:

I used loadtest to run a local stress test for verification. The following figure shows a comparison of the test results before and after the fix.
A single process was stress tested with 10 QPS in both tests. The comparison shows that before the fix, the response time (RT) continuously increased. After the fix, the RT remained stable at around 200 ms.
The online data shows that the memory usage rate remained stable with no spikes.

You are all set.
Methodology
Now that we have reviewed the case study, it is time to summarize the methodology.
Symptoms
As shown in the case study, the most typical symptom of a memory leak is a gradual increase in memory usage over time. Even when traffic stops, memory usage does not decrease. In a healthy application, memory usage rises with traffic and returns to its original level after the traffic decreases. 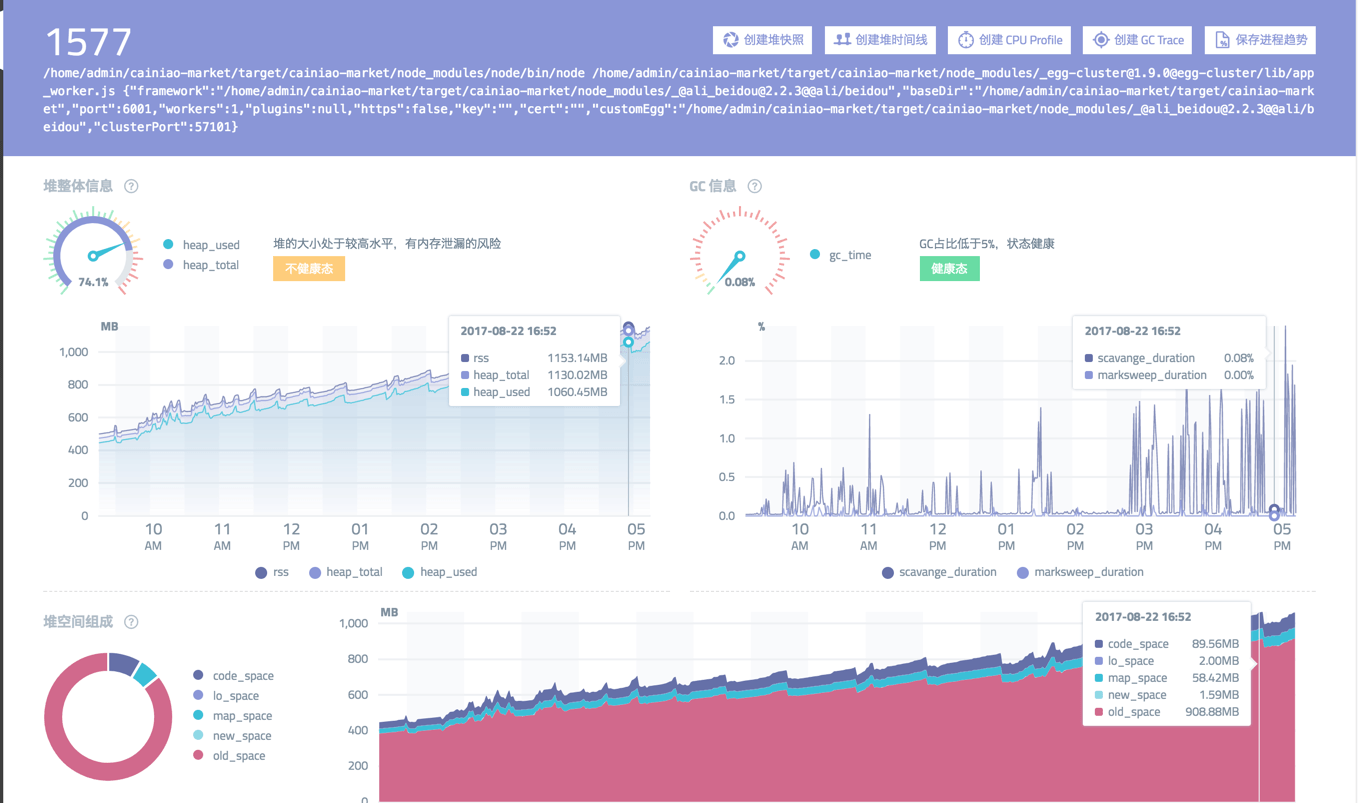
Causes
Memory leaks are usually caused by the following factors:
Cache
Queues that are not consumed promptly
Unreleased scopes
The case described in this topic falls into the category of unreleased scopes.
Solutions
Local environment
You can use loadtest for stress testing to observe the application's health.
If an abnormality occurs, you can use node-heapdump to take a snapshot of the V8 heap memory. Then, you can import the snapshot into Chrome DevTools Profiles for analysis.
Online environment
You can use monitoring platforms such as Alimonitor and EagleEye to monitor application health.
If an abnormality occurs, you can use heap snapshots from the Node.js Performance Platform to investigate the problem.
If the abnormality is difficult to reproduce, you can run stress tests in a pre-release environment or on an isolated online machine. Stress testing can effectively magnify the problem.
During stress testing, you can use heap snapshots from the Node.js Performance Platform to investigate the problem.
Recommendations
The most important recommendation is to perform stress testing during the development phase. There is an old saying:
A superior doctor prevents disease. A mediocre doctor treats disease before it is evident. An inferior doctor treats the full-blown disease.This means it is better to prevent problems than to fix them. It is best to identify issues during development, not after an alert is received from your production environment.You should avoid binding events in the
constructor. Instead, you can bind them in the componentDidMount lifecycle method.You can place components that do not support SSR in componentDidMount. Similarly, you can place native DOM operations such as createElement and appendChild in componentDidMount.
For more information, see Isomorphic Application Considerations.